Alpha-induced cross sections of 106Cd for the astrophysical p-process
Abstract
The 106Cd(Sn reaction cross section has been measured in the energy range of the Gamow window for the astrophysical -process scenario. The cross sections for 106Cd(,n)109Sn and for 106Cd(,p)109In below the (,n) threshold have also been determined. The results are compared with predictions of the statistical model code NON SMOKER using different input parameters. The comparison shows that a discrepancy for 106Cd(Sn when using the standard optical potentials can be removed with a different +106Cd potential. Some astrophysical implications are discussed.
pacs:
25.55.-e, 26.30.+k, 26.50.+x, 27.60.+jI Introduction
Stable heavy isotopes above iron ( 26) can be classified into three categories, -, - and -nuclei corresponding to the topology of the nuclide chart. The -nuclei are located along the valley of stability while the - and -nuclei can be found on the neutron rich and proton rich side of the valley, respectively. The names refer to the production process synthesizing the corresponding isotopes. The -process isotopes are produced by the s (slow) neutron capture process in stellar helium and carbon burning environments with steady neutron production through the 13C, 17O, and 22Ne(,n) reactions. The -process sites have been identified as low mass AGB stars ( 5 ) for the main -process busso and massive red giant stars ( 6 ) for the weak -process eleid . On the other hand, the -isotopes are produced by the (rapid) neutron capture process which takes place in explosive stellar environments providing a high neutron flux. The -process site is still under debate but the presently favored candidates are type-II supernovae qian and merging neutron stars Freiburghaus99 . For the production of a number of isotopes located along the valley of stability both the and processes have their contributions. The -nuclei, however, cannot be produced by neutron capture reactions. Their production mechanism, the -process, has been identified as a sequence of photodisintegration processes in a high -flux scenario wh78 . The initial abundance distribution of - and -nuclei at the -process site is converted by subsequent (,n) reactions toward the neutron-deficient region. As the neutron threshold increases, competing () and () photodisintegration processes branch the reaction flow towards lower mass regions ra05 . The final -nuclei abundance distribution depends critically on the seed abundance distribution as well as on the reaction flow which is determined by the associated reaction rates and reaction branchings. A recent detailed overview of the -process and a discussion about possible -process sites can be found in ar03 .
The modeling of -process nucleosynthesis requires a large network of thousands of nuclear reactions involving stable and unstable nuclei. The relevant astrophysical reaction rates which are derived from the reaction cross sections are necessary input to this reaction network. Their knowledge is essential for -process calculations. In some cases, the cross section of -induced reactions can be measured directly by photodissociation experiments mohr ; however, in such an experiment the target nucleus is always in its ground state while in stellar environments thermally populated excited states also contribute to the reaction rate. Thus theoretical considerations can not be avoided mo03 . Alternatively, the -induced reaction cross sections can be calculated through ”detailed balance” from the cross section of the inverse capture reactions. While there are extensive compilations of neutron capture data along the line of stability above the iron region (e.g. bao ), there are only very few charged-particle cross sections determined experimentally (despite substantial experimental efforts in recent years). Therefore, the -process rates involving charged particles are still based mainly on theoretical cross sections obtained from Hauser-Feshbach statistical model calculations. It is particularly important to study the charged particle photodissociation processes [(), (,p)] since those determine the reaction flow towards the lower mass range.
Because of the large number of experimentally unaccessed or unaccessible nuclei in astrophysical reaction networks, statistical model codes in astrophysics focus on the prediction of reaction rates from microscopic input or global parameterizations. Contrary to standard Hauser-Feshbach calculations applied in other areas of nuclear physics, they deliberately refrain from using local fine-tuning by utilization of local nuclear properties. It is assumed that such models allow better predictions for nuclei further off stability. The trade-off is in a possible loss of accuracy locally while the average deviation over a larger range of nuclei remains low. Nevertheless, also such models have to be tested against local data in order to arrive at further improvements. There is an increasing number of (p,) reactions relevant for the -process which have been measured in recent years la87 ; sa97 ; bo98 ; ch99 ; gyu01 ; ha01 ; oz01 ; ga03 ; gyu03 ; ts04 . Generally, the statistical models are able to reproduce this experimental data to better than a factor of two and the predictions are not very dependent on the input parameters (e.g. optical potentials). However, for () reactions only few cases have been measured fu96 ; so98 ; oz01 ; ra01 ; oz06 or are under study ha05 . The experimental results show substantial discrepancies compared to the model predictions. It has been suggested that these discrepancies are related to insufficiencies in the -optical potential. It is therefore important to measure () cross sections at sub-Coulomb energies and compare the results with the model calculations to identify the source of the observed discrepancies.
In the present work the -capture cross section of 106Cd is measured. This reaction is particularly important since it focuses on the study of photodisintegration of a 110Sn nucleus with = 50 closed proton shell. Near closed shells the level density is reduced and the statistical model may not be fully applicable. The 106Cd(Sn reaction is therefore a prime example to test the validity of the Hauser-Feshbach approach in this mass region. In addition, while for higher nuclei along the -process path the alpha threshold is negative, for 110Sn the -threshold turns positive =1.136 MeV and increases towards lower . This means that () photodissociation into the alpha channel for even-even nuclei below = 50 is reduced and the reaction flow may become diverted towards the line of stability by competing () reactions ra05 . (The experimantal study of the (p,) reactions on 106Cd and 108Cd is in progress. Preliminary results are already available gyu06 ). For nuclei between = 50 and = 50 both proton and -photodissociation channels need to be studied in detail to see how the reaction flow develops in this low mass range of the -process. This in particular will address the question of feeding the 92,94Mo and 96,98Ru -nuclei which remain underproduced in present -process nucleosynthesis simulations ar03 ; rhhw02 .
II Investigated reactions
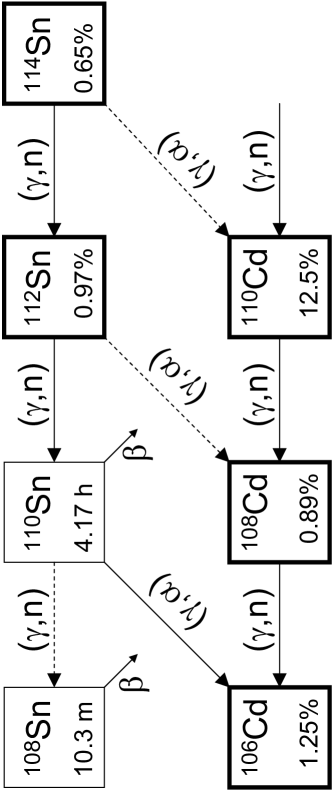
The primary aim of the present study is to extend the existing experimental database relevant to the -process by measuring the cross section of the 106Cd(Sn reaction. Based on the Hauser Feshbach predictions for the reaction rate, the -process branching point at which the () and (,p) reactions become competitive with the (,n) process along the = 50 isotopic chain (Sn isotopes) is located at mass number region 110-112 ra05 (see Fig. 1). The () and subsequent (,p) reactions on 110Sn and 112Sn lead to the production of the -nuclei 106Cd and 108Cd, respectively (108Cd has a slight contribution from the -process as well). The precise knowledge of these reaction rates is essential to the reliable prediction of the 106Cd and 108Cd abundances in -process modeling. In the present work the 106Cd(Sn cross section is determined and the results are compared with the prediction of statistical model calculations performed with the non-smoker code NON-SMOKER using different input parameters such as optical model potentials and nuclear level densities. In addition, the cross sections of the 106Cd(,n)109Sn reaction and the 106Cd(,p)109In reaction below the (,n) threshold have been measured and are compared with the non-smoker predictions.
The peak of the Gamow window for the 106Cd(Sn reaction at a -process temperature of = 3.0 is located at 7.21 MeV, its width is about 4 MeV. The lowest energy reached in our experiments was = 7.56 MeV (well within the Gamow window). The measurements extended up to Ec.m. = 12.06 MeV to probe the reliability of the Hauser-Feshbach predictions over a wider energy range.
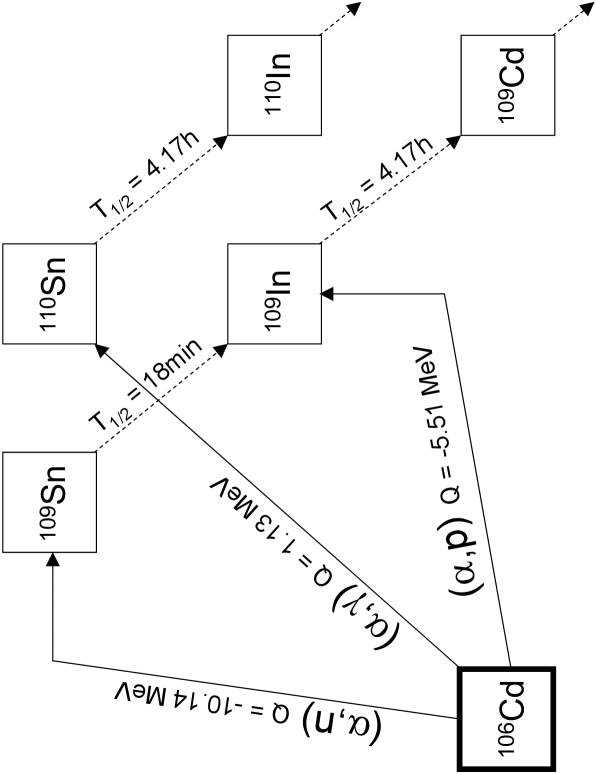
The reaction products of all three investigated reactions: 106Cd(Sn, 106Cd(,n)109Sn and 106Cd(,p)109In are radioactive. This makes it possible to determine the cross sections using the activation technique. The induced activity in a 106Cd target after bombarding with an beam can be measured off-line, and the above reaction cross sections can be deduced from the measured -activity. The reaction product of 106Cd(,p)109In is the same as the daughter of 109Sn from the 106Cd(,n)109Sn reaction. Moreover, above the (,n) threshold (Eα = 10.53 MeV), the (,n) channel becomes stronger than the (,p). Hence the 106Cd(,p)109In cross section is determined only below the (,n) threshold (see Sec. IV). The relevant part of the chart of nuclides can be seen in Fig. 2 where the alpha-induced reactions and the decay of the reaction products are shown. The decay parameters used for the analysis are summarized in Table 1.
| Product nucleus | Half-life [hour] | Gamma energy [keV] | Relative -intensity per decay [%] | Ref. |
|---|---|---|---|---|
| 110Sn | 4.173 0.023 | 280.5 | 97 | gyu05 |
| (4.11 0.1) | NDS89 | |||
| 109Sn | 18.0 0.2 min. | 1099.2 | 30.1 3.0 | NDS06 |
| 1321.3 | 11.9 1.4 | |||
| 109In | 4.167 0.018 | 203.5 | 73.5 0.5 | NDS06 |
III Experimental procedure
In order to increase the reliability of the experimental results and to find any hidden systematic error, the experiments have been carried out independently in ATOMKI, Debrecen, Hungary and at the University of Notre Dame, Indiana, USA. In the following sections the experimental set-ups used in the two laboratories are discussed.
III.1 Experiments in ATOMKI
III.1.1 Target properties
The targets were prepared by evaporating highly enriched (96.47 %) 106Cd onto thin (d = 3 m) Al foil. The Cd powder was evaporated from a Mo crucible heated by electron bombardment. The Al foil was placed 5 cm above the crucible in a holder defining a circular spot with a diameter of 12 mm on the foil for Cd deposition. This procedure made it possible to determine the target thickness by weighing. The weight of the Al foil was measured before and after the evaporation with a precision better than 5 g and from the difference the 106Cd number density could be determined. Altogether 5 enriched targets were prepared with thicknesses varying between 100 and 600 g/cm2.
The thickness of the Al foil ensures that the heavy reaction products are stopped in the backing. At the highest -bombarding energy of 12.5 MeV the energy of the 110Sn recoil is 450 keV and hence its range in Al is roughly 0.17 m, much smaller than the foil thickness.
III.1.2 Activations
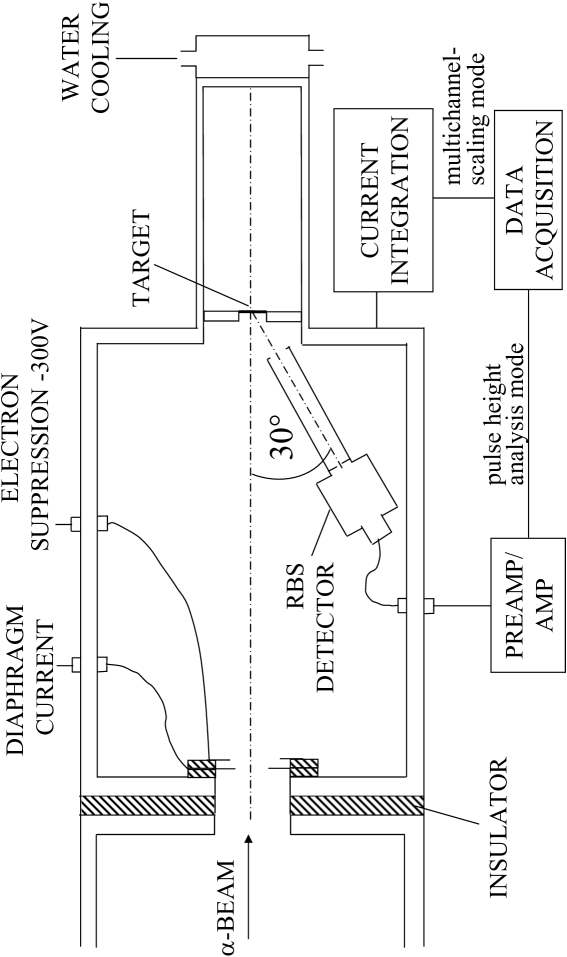
The activations have been performed at the MGC cyclotron at ATOMKI. The energy range from Eα= 8.5 to 12.5 MeV was covered in 10 steps. The schematic view of the target chamber can be seen in Fig. 3. After the last beam defining aperture, the whole chamber served as a Faraday-cup to collect the accumulated charge. A secondary electron suppression voltage of V was applied at the entrance of the chamber. Each irradiation lasted about 10 hours and the beam current was restricted to 500 enA in order to avoid target deterioration. The current was kept as stable as possible but to follow the changes the current integrator counts were recorded in multichannel scaling mode, stepping the channel in every minute. This recorded current integrator spectrum was then used for the analysis solving the differential equation of the population and decay of the reaction products numerically.
A surface barrier detector was built into the chamber at =150∘ relative to the beam direction to detect the backscattered particles and to monitor the target stability this way. The RBS spectra were taken continuously and the number of counts in the Cd peak was checked regularly during the irradiation. Having the beam current restricted to 500 enA, no target deterioration was found within the precision of the RBS measurement i.e. of the order of 1%. Weighing the target foils after irradiation also confirmed this.
The beam stop was placed 10 cm behind the target from where no backscattered particles could reach the surface barrier detector. The beam stop was directly water cooled.
Because of an energy gap of the cyclotron, it is not possible to accelerate -beam in the energy range between Eα = 9 and 10.8 MeV (with the exception of a narrow allowed window around 10 MeV where limited -current is possible). Therefore the energy points of Eα = 9.5 and 10.33 MeV have been measured with higher energy beam and energy degrader foils. For energy degrader Al foil with 8.8 m thickness was used. The thickness was determined with measuring the energy loss of -particles from an -source when passing through the foil. The 10.33 MeV energy was reached from the beam energy of 11.2 MeV using one layer of degrader foil while for the 9.5 MeV point two layers of degrader foil and 11.3 MeV beam was used. In order to test the reliability of the degrader foil method, the reaction cross section at 11.6 MeV was measured directly as well as using 12.4 MeV beam and one degrader foil. The two measurement gave the same result (see Sec. IV).
The highest energy point (Ec.m. = 12.06 MeV) has also been measured using a Cd target with natural isotopic composition. The results with enriched and natural targets are the same within the error (Sec. IV).
III.1.3 Detection of the induced -radiation
The radiation following the -decay of the produced Sn and In isotopes was measured with a HPGe detector of 40% relative efficiency. The target was mounted in a holder at a distance of 10 cm from the end of the detector cap. The whole system was shielded by 10 cm thick lead against laboratory background.
The -spectra were taken for at least 10 hours and stored regularly in order to follow the decay of the different reaction products.
The absolute efficiency of the detector was measured with calibrated 133Ba, 60Co and 152Eu sources in the same geometry used for the measurement. At Eγ = 280.5 keV the photopeak efficiency is (0.811 0.057) %.
Fig. 4 shows an off-line -spectrum taken after irradiation with 12 MeV -s in the first 1h counting interval. The lines used for the analysis are indicated by arrows.
Taking into account the detector efficiency and the relative intensity of the emitted -rays, coincidence summing effects for all three reactions were well below 1% and were neglected.

III.2 Experiments at Notre Dame
III.2.1 Target properties
106Cd targets used at Notre Dame were prepared by rolling with nominal thicknesses of 2.3 mg/cm2 and a 106Cd enrichment of 86.4 %. The foils were mounted on Ta frames with hole diameters of 12.5 mm. The actual thickness was determined prior to the activations by Rutherford backscattering (RBS) to 2.1 0.2 mg/cm2. The targets were also monitored by RBS during the activations (see below) and the thicknesses were again verified after the conclusion of the experiment. Tests with natural targets showed no deterioration of the targets when the -beam currents were limited to 300 enA. Because the Notre Dame experiment was designed to extend the ATOMKI data to lower beam energies, the targets were not backed by a thin Al layer to avoid the short lived -activity associated with the Al activation. For this reason no waiting time was required between the end of the activation and the counting; however, this allows a small fraction of the heavy recoils to escape from the target. At beam energies of 10 MeV the target layer from which recoils can escape is 0.06 mg/cm2 or less than 3 of the target thickness. In addition, the cross section drops significantly across the target thickness (factor of 5) leading to an overall loss of activity of 0.6 %.
III.2.2 Activations
The activations at Notre Dame were carried out with the FN Tandem Van de Graaff accelerator at beam energies between 7.0 and 12.0 MeV. However, no data could be obtained below 8 MeV because of strong Compton background caused by a -line (Eγ=373 keV) from the 40Ca(,p)43Sc reaction. 40Ca is a common contaminant which has a Coulomb barrier substantially lower than 106Cd and the half-life of 43Sc is similar to that of 110In. The cross section for this reaction only changes little over the investigated energy range (see e.g. Howard74 ) while the 106Cd + cross sections drop exponentially with beam energy. The experimental setup of the target chamber was similar to ATOMKI. A collimator with a diameter of 5 mm defined the beam spot. The isolated target chamber served as Faraday cup and a suppression voltage of –300 V was applied to an isolated cathode between collimator and chamber. In addition, a Si detector was placed at 135∘ with respect to the beam direction to monitor the target stability. The target was placed in a brass holder which was air cooled and the beam was stopped in a thick Carbon foil located directly behind the target. The digitized charge and the energy signal of the Si detector were recorded event-by-event together with the time of the event. Each activation lasted 8 hours (approximately 2 half-lives) and the beam current was kept below 300 enA (see above).
III.2.3 Detection of the induced -radiation
The resulting -activity was measured with a pair of Ge clover detectors which were mounted face to face. The detectors were shielded by 5 cm of Pb against the room background and the distance between the detectors was 5 mm. The activated targets were mounted in a holder which placed them at the center of the detection system. The holder was made out of plastic and filled out the whole space between the clover detectors except for the space needed by the target. Each clover detector consists of 4 individual crystals with a relative efficiency of 20 %. The energies of the crystals were recorded event-by-event together with the time of the event. In addition a pulser signal was fed into the test input of one of the Ge preamplifiers. This allowed to reconstruct the dead time as a function of time. Each of the crystals were treated as an independent Ge detector to reduce the problem of pile-up and summing losses.
The absolute and relative -efficiencies of the detectors were determined using calibrated 54Mn, 60Co, and 133Ba sources as well as an uncalibrated 152Eu source. The activity of the 152Eu source was determined relative to the 54Mn and 60Co sources. The efficiency was determined by two independent methods. In the standard method the known decay branchings and activities of the sources were used to determine the efficiency. However, because of the high counting efficiency of the detector system, summing correction has to be applied for the multiple line sources. These were taken from Ref Shima . The second method makes use of the high counting efficiency and granularity of the detection system. Choosing selected -transitions which are in sequence the detector efficiency can be determined independent of the source strength from ratios of single- and coincidence events. In this method, the problem of summing correction is either absent or greatly removed. Both methods agreed within the uncertainties. The off-line detection system has a peak peak efficiency of (22.3 0.5) % for a -energy of 280.5 keV.
IV Experimental results
| Ebeam | E | Cross section | factor | |||
| [MeV] | [MeV] | [barn] | [1021 MeV b] | |||
| ATOMKI results | ||||||
| 8.500 | 8.123 | 0.029 | 0.85 | 0.37 | 180 | 78 |
| 9.008 | 8.632 | 0.026 | 4.87 | 0.55 | 155 | 18 |
| 11.300111measured with energy degrader foil | 9.108 | 0.049 | 22.8 | 2.9 | 143 | 18 |
| 10.000 | 9.599 | 0.030 | 79.1 | 8.2 | 105 | 11 |
| 11.200††footnotemark: | 9.909 | 0.036 | 147 | 15 | 78.4 | 8.1 |
| 10.800 | 10.371 | 0.033 | 234 | 24 | 34.3 | 3.5 |
| 11.200 | 10.775 | 0.033 | 298 | 31 | 15.1 | 1.6 |
| 11.600 | 11.167 | 0.034 | 507 | 53 | 9.8 | 1.0 |
| 12.400††footnotemark: | 11.167 | 0.037 | 471 | 49 | 9.08 | 0.94 |
| 11.998 | 11.544 | 0.035 | 601 | 62 | 4.78 | 0.50 |
| 12.523222measured with natural Cd target | 12.050 | 0.036 | 1270 | 150 | 3.28 | 0.39 |
| 12.523 | 12.057 | 0.036 | 1280 | 133 | 3.26 | 0.34 |
| Notre Dame results | ||||||
| 8.000 | 7.566 | 0.010 | 0.078 | 0.014 | 164 | 29 |
| 8.500 | 8.040 | 0.010 | 0.480 | 0.048 | 141 | 14 |
| 9.000 | 8.513 | 0.011 | 2.59 | 0.26 | 126 | 13 |
| 9.500 | 8.992 | 0.012 | 11.8 | 1.2 | 108 | 11 |
| 10.000 | 9.466 | 0.012 | 46.4 | 4.6 | 92.7 | 9.3 |
| 10.000 | 9.470 | 0.012 | 48.3 | 4.8 | 95.3 | 9.5 |
| 10.000333measured with ATOMKI target | 9.599 | 0.012 | 75.1 | 5.4 | 99.9 | 7.7 |
| 11.000 | 10.429 | 0.014 | 244 | 124 | 30.6 | 3.6 |
| 11.500 | 10.909 | 0.014 | 434 | 43 | 15.8 | 1.6 |
| 12.000 | 11.385 | 0.015 | 596 | 61 | 6.85 | 0.70 |
| Ebeam | E | Cross section | factor | |||
|---|---|---|---|---|---|---|
| [MeV] | [MeV] | [barn] | [1021 MeV b] | |||
| 10.800 | 10.371 | 0.033 | 423 | 74 | 62 | 11 |
| 11.200 | 10.775 | 0.033 | 1420 | 240 | 72 | 12 |
| 11.600 | 11.167 | 0.034 | 2470 | 400 | 48 | 8 |
| 12.400444measured with energy degrader foil | 11.167 | 0.037 | 2600 | 440 | 50 | 8 |
| 11.998 | 11.544 | 0.035 | 4785 | 720 | 38.0 | 5.7 |
| 12.523 | 12.057 | 0.036 | 14400 | 2100 | 36.7 | 5.4 |
| Ebeam | E | Cross section | factor | |||
| [MeV] | [MeV] | [barn] | [1021 MeV b] | |||
| ATOMKI results | ||||||
| 10.000 | 9.599 | 0.030 | 6.0 | 0.8 | 8.0 | 1.1 |
| 11.200555measured with energy degrader foil | 9.909 | 0.036 | 39.6 | 4.2 | 21.1 | 2.2 |
| Notre Dame results | ||||||
| 9.500 | 8.992 | 0.012 | 0.24 | 0.04 | 2.23 | 0.35 |
| 10.000 | 9.470 | 0.012 | 2.76 | 0.28 | 5.45 | 0.55 |
| 10.000666measured with ATOMKI target | 9.599 | 0.01 | 5.70 | 0.67 | 7.58 | 0.89 |
The cross sections and factors for the reactions 106Cd(Sn , 106Cd(,n)109Sn and 106Cd(,p)109In are listed in Tables 2-4, respectively. The second column shows the effective center-of-mass energies Rolfs&Rodney which accounts for the decrease of the cross section over the target thickness. For the ATOMKI measurement, the quoted errors of the energies include the energy loss in the targets calculated with the srim code SRIM , the energy stability of the cyclotron and the energy straggling in the degrader foil where it was applied. For the Notre Dame results, the energy error is determined by the uncertainty in the calculation of the effective energy. The results obtained in ATOMKI and in Notre Dame are listed separately. For the 106Cd(,n)109Sn reaction no results from the Notre Dame experiment are listed. The complex -decay scheme NDS06 as well lack of any dominant -line and the close geometry of the Notre Dame counting system require significant summing corrections leading to large uncertainties. For this reason we abstain from quoting any Notre Dame results for this reaction.
Both sets of data are in excellent agreement (see tables 2 and 4). To test for systematic uncertainties, the 106Cd(Sn cross section was measured at Notre Dame at the same beam energy (10 MeV) using the same target as in ATOMKI. The values are in excellent agreement (see Table 2). The error of the cross section ( factor) values is the quadratic sum of the following partial errors: efficiency of the detector system (7%(ATOMKI), 2.3%(Notre Dame)), number of target atoms (6%,9%), current measurement (3%,3%), uncertainty of the level parameters found in literature (12%), counting statistics (0.1 to 40%).
One possible uncertainty is the decay branching ratio of 110Sn. The compilation NDS89 lists a 100 % -branching ratio to the 345 keV level in 110In. However, this value is based only on an unpublished PhD thesis from 1956 Mead . The resulting log ft value of 3.24 is unusually small when compared with other -transitions between (1) and (1g9/2) in this mass region and some of the decay branches might not have been observed NDS89 . Calculation of the 106Cd(Sn cross section from the mother (110Sn) and from the daughter (110In) activities provide an indirect way to determine this decay branching ratio. This has been done for several activations at ATOMKI and the resulting cross sections are always in good agreement within the errors. The weighted average of the ratios of the two cross sections from the two analyses is 1.041 0.073. This confirms the decay branching of 100 % for the 110Sn -decay.
While the 106Cd(Sn reaction has been successfully observed for all measured energies, 106Cd(,n)109Sn cross sections can only be measured in the upper half of the investigated energy region where the (,n) channel is open. Because of the problems described in Sec. II, the 106Cd(,p)109In cross section has been determined only below the 106Cd(,n)109Sn threshold. Moreover, at the three lowest measured energies the 106Cd(,p)109In cross section is so low that no cross section value could have been derived. Therefore, the 106Cd(,p)109In cross section has been measured only at 4 energies.
V Discussion
V.1 Comparison to theory
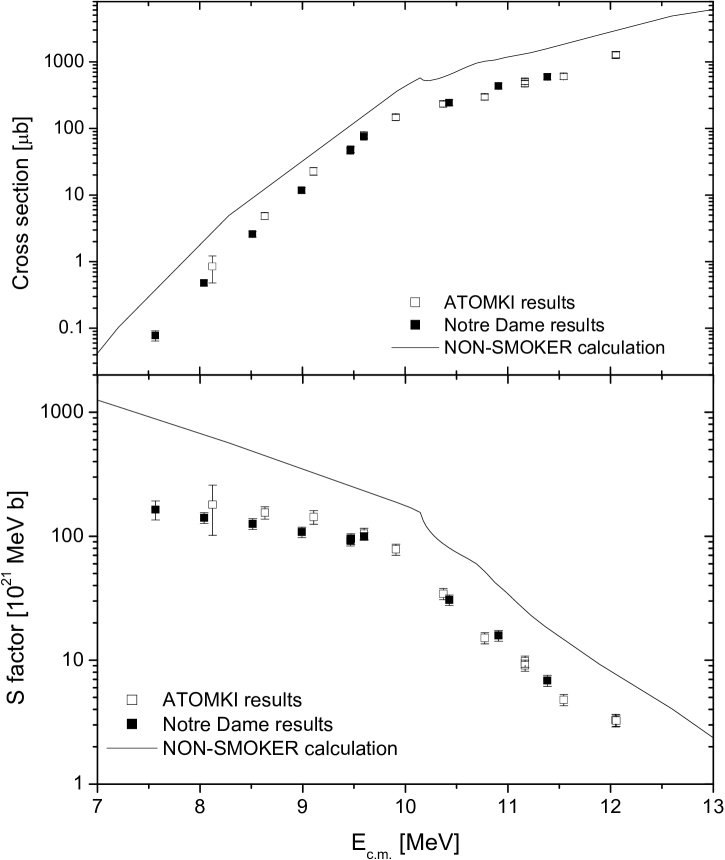
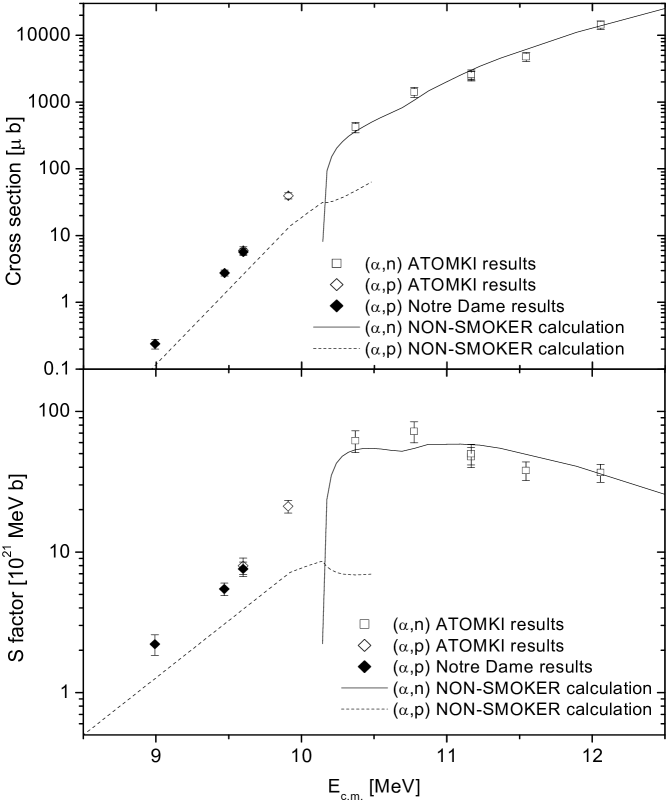
Figures 5 and 6 show a comparison of the experimental results to the Hauser-Feshbach statistical model cross sections NON-SMOKERcs obtained with the standard settings of the non-smoker. There is excellent agreement for the (,n) reaction. The predicted cross sections are too low in the case of the (,p) reaction. Finally, the calculation yields cross sections which are too high by an almost constant factor of about 2.2 compared to the ATOMKI data in the case of the (,) reaction. While being at the same level of disagreement with the (,) Notre Dame data above 9 MeV, the Notre Dame data for the three lowest energies seem to indicate a different energy dependence than the theoretical one. There is a factor of 5 disagreement between theory and experiment at the lowest measured energy of 7.566 MeV.
Since not only the capture reaction was measured but also the neutron and proton emission channels, interesting conclusions on the impacts of different inputs can be drawn. Usually, it is assumed that the widths determine the cross sections in capture reactions because they are smaller than the particle widths. Inspection of the computed widths (directly derived from the calculated transmission coefficients; see koe04 for further details) shows that this is not the case here. Due to the small value and the high Coulomb barrier the widths are smaller or comparable. Only at the upper limit of the range of measured energies the cross section also becomes sensitive to the width. This is shown in Fig. 7 where the sensitivity of the cross section (ranging between 0 for no sensitivity to 1 for full sensitivity) to variations in the and widths, respectively, is plotted. A similar comparison was performed for the other measured channels. Our (,n) cross sections are sensitive to the width and weakly dependent on the neutron width (except close to the threshold where the neutron width becomes smaller than the width). The 106Cd(,p) reaction is equally sensitive to and proton widths. All channels are quite independent of the nuclear level density because transitions to the low-lying states dominate and a number of these are explicitly included in the calculation (see NON-SMOKERcs for a list of included states).

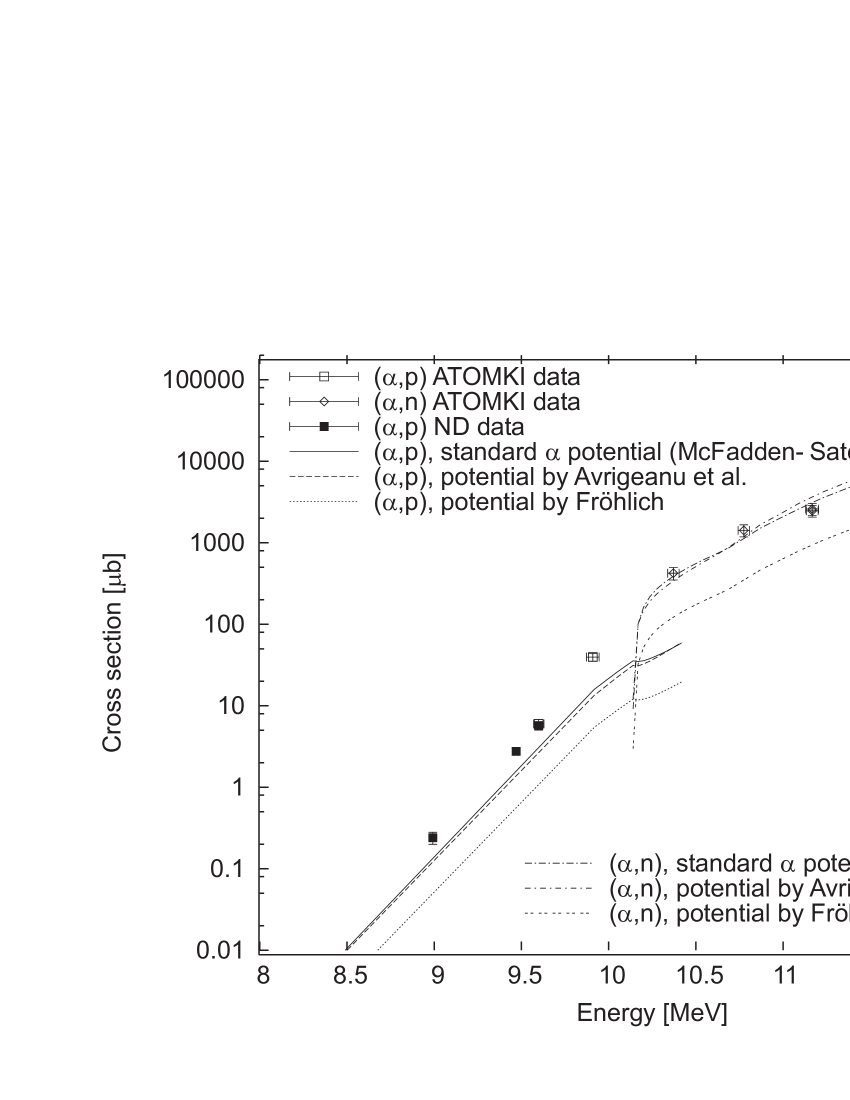
The standard predictions make use of the +nucleus optical potential by McF66 . Although this potential can reproduce scattering data over a large range of masses, it has been found to be problematic in describing capture and emission at low energies (see, e.g., so98 ; koe04 ). In Figs. 8 and 9 cross sections obtained with two different (more recent) +nucleus potentials are shown. Using the potential of avri03 , which was fitted on scattering data across a wide range of energies and masses, we obtain values not much different from those resulting from the use of the standard potential. Using the potential of froh02 ; raufroh , which was fitted to (n,) and (,) reaction data around , the capture cross sections are reduced by more than a factor of two and thus better agreement is found for the (,) reaction. However, due to the sensitivity of the (,p) and (,n) channels to the optical potential, their cross sections are also reduced which removes the previously good agreement with the (,n) data and worsens the case of the (,p) reaction. It is interesting to note that recently the authors of Ref. avri03 have pointed out a possible difference between optical potentials derived from scattering data and such derived from reaction data. They conclude that optical potentials derived from scattering may have to be modified before applying them to reactions avri06 .
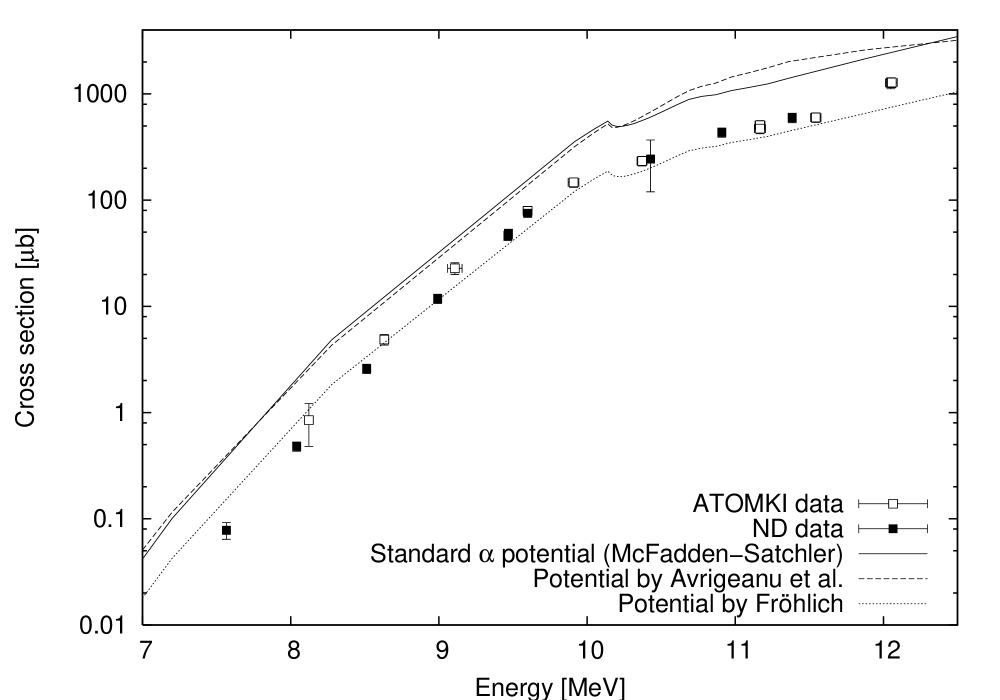
Figure 7 clearly shows the high sensitivity of the capture reaction to the potential. This leads to the conclusion that indeed the potential is the source of the disagreement with the experiment and that the capture reaction is best described with the potential of froh02 ; raufroh , even though it appears to have a similar energy dependence as the standard potential and thus may still overestimate the cross sections at energies below the measured ones. Fixing the potential through the (,) reaction, one could assume that the disagreement between calculation and data for the (,p) channel has to arise from the proton optical potential. This conclusion appears puzzling when finally comparing with the (,n) reaction. For the latter we found only weak sensitivity to the neutron widths and compensating for the disagreement by changing the neutron width would require large modifications of the neutron optical potential. Since good agreement was found for neutron capture in this mass region bao , it seems far-fetched to allow such a large modification. A possible explanation might be the fact that both (,p) and (,n) have a large negative value and that therefore only few, low-energy neutron and proton transitions contribute. These will be very sensitive to the level scheme of low-lying levels. The spin assignments to these levels still bear considerable uncertainty even in the latest compilation NDS06 and the level schemes might still not be complete. This could explain why the neutron and proton emission channels are underestimated in the calculation.
V.2 Astrophysical implications
The standard statistical model rates of NON-SMOKERrates , utilizing the potential of McF66 , are widely used in stellar models. For instance, with those rates the production of -nuclei in the -process in massive stars was studied in rhhw02 . Details on the branchings in the -process path for the usual temperature range can be found in ra05 . In Table I of Ref. ra05 , it can immediately be seen what changes are brought about by switching from the potential of McF66 to the potential of froh02 ; raufroh which better describes our capture data. The branching at remains unchanged (a (,p) branching at 110Sn) because photon-induced proton emission is by far faster than emission. At , proton and emission start to compete when using the standard rates. However, with the lower rates obtained with the potential of froh02 ; raufroh , emission is still suppressed and proton emission is dominating. At the standard rates predict a (,) branching already at 112Sn. With the new potential the branching is shifted back to 110Sn and becomes a combined (,p)+(,) branching. Considering that the energy dependence at low energies may not be well reproduced and that the actual cross section may be even lower, as indicated by the trend seen in the low energy Notre Dame data, it is conceivable that the branching at is even further suppressed and may become negligible compared to the 110Sn(,p) branching.
The modification of the branching in the Sn chain by itself will not lead to large changes in the description of the -process. However, our results show that the treatment of the optical potential at astrophysically relevant energies will have to be improved. They also seem to suggest that the branchings obtained with Rate Set C of ra05 may be more accurate than those obtained with the standard Rate Set A concerning the branchings.
VI Summary
The cross sections of three -induced reactions on 106Cd have been measured using the activation technique. The 106Cd(Sn cross section was determined in the energy range between Ec.m. = 7.56 and 12.06 MeV. Within this energy range, the particle emitting 106Cd(,n)109Sn and 106Cd(,p)109In cross sections have been measured above and below the (,n) threshold, respectively.
For all three investigated reactions, the experimental results were compared with the cross sections calculated using the non-smoker statistical model code. The standard settings of the non-smoker code provided an excellent prediction for the (,n) cross section while the calculated cross sections were too low and too high for the (,p) and () channels, respectively. The sensitivity of the predictions to the input parameters was also examined. It was found that good agreement with the experiment can be obtained for the () channel by modifying the optical potential. The same potential, however, simultaneously results in a worse reproduction of the experimental results in the (,n) and (,p) channels. The calculations for these channels, in turn, appear to have problems in other nuclear properties, the proton and neutron optical potentials or, most likely, the uncertain spin and parity assignments of excited states in the exit channels.
The value of the (,) reaction cross section and rate influences the branching points in the process path. The impact of the new experimental cross section, which is lower than previously predicted, has been examined for the Sn isotopic chain. The result underlines the importance of the experimental investigation of -induced reactions in the mass and energy region relevant to the astrophysical process.
Acknowledgements.
We like to thank J. Greene from Argonne National Laboratory for the preparation of the targets used at Notre Dame. The assistance of C. Ugalde, E. Strandberg, A. Couture, J. Couture, and E. Stech during the course of the experiment is highly appreciated. This work was supported by OTKA (Grant Nos. T042733, T049245, F043408 and D048283), by the NSF-Grant PHY01-40324, MTA-OTKA-NSF grant 93/049901, the Swiss NSF (grants 2024-067428.01, 2000-105328), the Scientific and Technical Research Council of Turkey (TUBITAK) - Grant TBAG-U/111 (104T2467), and through the Joint Institute of Nuclear Astrophysics (www.JINAweb.org) NSF-PFC grant PHY02-16783. Gy. Gy. and Zs. F. acknowledge support from the Bolyai grant.References
- (1) M. Busso, R. Gallino, and G. J. Wasserburg, Ann. Rev. Astron. Astrophys. 37, 239 (1999).
- (2) L.-S. The, M. El Eid, and B. Meyer, Astrophys. J. 533, 998 (2000).
- (3) Y.-Z. Qian, Astrophys. J. Lett. 534, L67 (2000).
- (4) C. Freiburghaus, S. Rosswog, and F.-K. Thielemann, Astrophys. J. 525, L121 (1999).
- (5) S. E. Woosley and W. M. Howard, Astrophys. J. Suppl. 36, 285 (1978).
- (6) T. Rauscher, Phys. Rev. C 73, 015804 (2006).
- (7) M. Arnould and S. Goriely, Phys. Rep. 384, 1 (2003).
- (8) K. Vogt, P. Mohr, M. Babilon, J. Enders, T. Hartmann, C. Hutter, T. Rauscher, S. Volz, and A. Zilges, Phys. Rev. C 63, 055802 (2001).
- (9) P. Mohr, AIP Conf. Proc. 704, 532 (2004).
- (10) Z. Y. Bao, H. Beer, F. Käppeler, K. Wisshak, and T. Rauscher, At. Data Nucl. Data Tables 76, 70 (2000).
- (11) C. E. Laird, D. Flynn, R. L. Hershberger, and F. Gabbard, Phys. Rev. C 35, 1265 (1987).
- (12) T. Sauter and F. Käppeler, Phys. Rev. C 55, 3127 (1997).
- (13) J. Bork, H. Schatz, F. Käppeler, and T. Rauscher, Phys. Rev. C 58, 524 (1998).
- (14) F. R. Chloupek, A. StJ. Murphy, R. N. Boyd, A. L. Cole, J. Görres, R. T. Guray, G. Raimann, J. J. Zach, T. Rauscher, J. V. Schwarzenberg, P. Tischhauser, and M. C. Wiescher, Nucl. Phys. A 652, 391 (1999).
- (15) Gy. Gyürky, E. Somorjai, Zs. Fülöp, S. Harissopulos, P. Demetriou, and T. Rauscher, Phys. Rev. C 64, 065803 (2001).
- (16) S. Harissopulos, E. Skreti, P. Tsagari, G. Souliotis, P. Demetriou, T. Paradellis, J. W. Hammer, R. Kunz, C. Angulo, S. Goriely, and T. Rauscher, Phys. Rev. C 64, 055804 (2001).
- (17) N. Özkan, A. StJ. Murphy, R. N. Boyd, A. L. Cole, M. Famiano, R.T. Güray, M. Howard, L. Sahin, J.J. Zach, R. deHaan, J. Görres, M. C. Wiescher, M.S. Islam, and T. Rauscher, Nucl. Phys. A 710, 469 (2002).
- (18) S. Galanopoulos, P. Demetriou, M. Kokkoris, S. Harissopulos, R. Kunz, M. Fey, J. W. Hammer, Gy. Gyürky, Zs. Fülöp, E. Somorjai, and S. Goriely, Phys. Rev. C 67, 015801 (2003).
- (19) Gy. Gyürky, Zs. Fülöp, E. Somorjai, M. Kokkoris, S. Galanopoulos, P. Demetriou, S. Harissopulos, T. Rauscher, and S. Goriely, Phys. Rev. C 68, 055803 (2003).
- (20) P. Tsagari, M. Kokkoris, E. Skreti, A. G. Karydas, S. Harissopulos, T. Paradellis, and P. Demetriou, Phys. Rev. C 70, 015802 (2004).
- (21) Zs. Fülöp, Á.Z. Kiss, E. Somorjai, C.E. Rolfs, H.P. Trautvetter, T. Rauscher, H. Oberhummer, Z. Phys. A 355, 203 (1996).
- (22) E. Somorjai Zs. Fülöp, Á.Z. Kiss, C.E. Rolfs, H.P. Trautvetter, U. Greife, M. Junker, S. Goriely, M. Arnould, M. Rayet, T. Rauscher, and H. Oberhummer, Astron. Astrophys. 333, 1112 (1998).
- (23) W. Rapp, H.J. Brede, M. Heil, D. Hentschel, F. Käppeler, H. Klein, R. Reifarth, and T. Rauscher, Nucl. Phys. A688, 427 (2001).
- (24) N. Özkan G. Efe, R.T. Güray, A. Palumbo, M. Wiescher, J. Görres, H.-Y. Lee, Gy. Gyürky, E. Somorjai, and Zs. Fülöp, Eur. Phys. J. A direct 27, (2006).
- (25) S. Harissopulos et al., Nucl. Phys. A 758, 505 (2005).
- (26) Gy. Gyürky, G.G. Kiss, Z. Elekes, Zs. Fülöp, and E. Somorjai, Eur. Phys. J. A direct 27, (2006).
- (27) T. Rauscher, A. Heger, R. D. Hoffman, and S. E. Woosley, Astrophys. J. 576, 323 (2002).
- (28) T. Rauscher and F.-K. Thielemann, in Stellar Evolution, Stellar Explosions, and Galactic Chemical Evolution, ed. A. Mezzacappa (IOP, Bristol 1998), p. 519.
- (29) Gy. Gyürky, Z. Elekes, Zs. Fülöp, G. Kiss, E. Somorjai, A. Palumbo, and M. Wiescher, Phys. Rev. C 71, 057302 (2005).
- (30) D. De Frenne and E. Jacobs, Nucl. Data Sheets 89, 481 (2000).
- (31) J. Blachot, Nucl. Data Sheets 107, 355 (2006).
- (32) A.J. Howard, H.B. Jensen, M. Rios, W.A. Fowler, B.A. Zimmerman, Astrophys. J. 188, 131 (1974).
- (33) F.J. Shima and D.D. Hoppes, Int. J. Appl. Radiat. Isotopes 34, 1109 (1983).
- (34) C.E. Rolfs and W.S. Rodney, Cauldrons in the Cosmos (University of Chicago Press, Chicago, 1988)
- (35) J. F. Ziegler and J. P. Biersack, Code SRIM, Version 2003.20.
- (36) W. Mead, PhD Thesis, University of California, Berkeley (1956).
- (37) T. Rauscher and F.-K. Thielemann, At. Data Nucl. Data Tables 79, 47 (2001).
- (38) P. E. Koehler, Yu. M. Gledenov, T. Rauscher, and C. Fröhlich, Phys. Rev. C 69, 015803 (2004).
- (39) L. McFadden and G. R. Satchler, Nucl. Phys. 84, 177 (1966).
- (40) M. Avrigeanu, W. von Oertzen, A. J. M. Plomben, and V. Avrigeanu, Nucl. Phys. A 723, 104 (2003).
- (41) C. Fröhlich, diploma thesis, University of Basel, Switzerland, 2002.
- (42) T. Rauscher, Nucl. Phys. A 719, 73c (2003); A 725, 295 (2003).
- (43) M. Avrigeanu, W. von Oertzen, and V. Avrigeanu, Nucl. Phys. A 764, 246 (2006).
- (44) T. Rauscher and F.-K. Thielemann, At. Data Nucl. Data Tables 75, 1 (2000).