Hydrodynamic description of spectra at high transverse mass in ultrarelativistic heavy ion collisions
Abstract
Transverse mass spectra of pions and protons measured in central collisions of heavy ions at the SPS and at RHIC are compared to a hydrodynamic parameterization. While the chemical temperature needed at RHIC is significantly higher compared to SPS, the spectra may be described using kinetic freeze-out parameters which are similar for both beam energies. At RHIC either the temperature or the flow velocity is higher, but the data provide no unambiguous proof for much stronger transverse flow. The contribution of such hydrodynamic emission at high transverse momenta is investigated in detail. It is shown that hydrodynamics may be relevant up to relatively high transverse momenta. The importance of the velocity profile used in this context is highlighted.
pacs:
25.75.DwParticle and resonance production1 Introduction
The description of transverse momentum (or transverse mass) spectra with hydrodynamic models is one of the well established tools in ultrarelativistic heavy-ion physics Schn93 ; Chap95 ; PBM95 ; wiedemann96 ; na49hydro ; wa80:pi0:98 ; wa98:hydro:99 ; tomasik99 . The applicability of such models is still under discussion, because they require local thermalization, which may not hold for the entire reaction volume. Furthermore, at high transverse momenta hard scattering is expected to provide an important contribution to particle production – the exact momentum region where this would apply is under debate.
Comparisons to experimental data have often been performed using parameterizations of hydrodynamic distributions, which have to use simple assumptions about the freeze-out conditions, e.g. mostly one universal freeze-out temperature is used. While such parameterizations can not replace full hydrodynamic calculations, they can provide a reasonable guideline to the general behavior of particle distributions, especially as systematic studies are more accessible in this case due to the much more modest calculational effort.
In the present paper I will assume the validity of hydrodynamic pictures, but I will not attempt to deliver a full-fledged, realistic hydrodynamic calculation. A parameterization will be used to describe momentum spectra at low and intermediate . 111While such calculations can also be used to compare to two-particle-correlations, this will not be the scope of this paper. Parameters for chemical and kinetic freeze-out will be determined from a simultaneous fit of pion and (anti-)proton spectra. The main intention is to use a not too unrealistic hydrodynamic parameterization fitted to low transverse masses to study the extrapolation to high .
This is very important also in the light of recent attempts to measure jet quenching at RHIC via transverse momentum distributions highpt . If the particle emission at low is governed by hydrodynamics, as e.g. the results on elliptic flow starv2id ; phenixv2 suggest, then such a hydrodynamic source will inevitably contribute at high also. Such a hydrodynamic contribution would have to be taken into account before comparing them to pQCD calculations and obtaining estimates of the amount of suppression of hard scattering.
2 The Model
The calculations presented in this paper are based on a parameterization of the source at freeze-out by Wiedemann and Heinz wiedemann96 which is motivated by a hydrodynamic approach and includes effects of transverse flow and resonance decays. The original computer program calculates the direct production of pions and the contributions from the most important resonances having two- or three-body decays including pions (, , , , , , , ). The transverse momentum spectra of the directly emitted resonances are given by:
| (1) | |||||
where and is the Gaussian radius of the source. Because the integrals are evaluated numerically, fixed integration boundaries have to be chosen. The upper limit of was chosen to ensure that for most reasonable shapes only negligible tails of the distribution extend beyond the limits. The transverse rapidity of the source element is given as , where the default value of the power is . The transverse rapidity parameter controls the amount of transverse flow.
This distribution represents the rapidity integrated spectrum, which will be used in this paper, as it is easier to calculate compared to the general rapidity differential spectrum. In comparison to experimentally measured spectra, which are mostly from limited rapidity regions, this may introduce a bias. This bias should however be small, if the rapidity dependence of the spectra is negligible as in a longitudinal scaling expansion (Bjorken) scenario. In fact, although the Bjorken picture is not at all applicable at SPS, the dependence of the spectral shape on rapidity is already reasonably small na49jones . The dependence of yields of different species on rapidity may have a small effect on the chemical parameters in the fits. We will comment on this again in a later section.
The original version of this model uses the following assumptions:
-
1.
The spatial density distribution at freeze-out is chosen as a Gaussian.
-
2.
One universal freeze-out temperature is used which determines both the spectral shape and the ratio of different particle species (i.e. resonances).
In the calculations performed here the model has been modified in the following way:
-
1.
As the spatial distribution a Woods-Saxon shape:
(2) has been introduced. By varying the parameter the shape can be adjusted. For large values of the shape approaches a box-like distribution. The shape may also be chosen very similar to a Gaussian for comparison. The spatial distributions fix implicitly the shape of the velocity distribution. While this may not be very relevant at low transverse momenta, it has been shown to be important at high wa98:hydro:99 . The influence of different distributions has also been investigated in tomasik99 .
-
2.
The spectra for a given particle (or resonance) are calculated using the kinetic temperature . Finally the normalization is readjusted to the chemical temperature assuming that at midrapidity scales with the temperature as Schn93 :
(3) It is commonly believed that chemical freeze-out (determining particle ratios) should occur at higher temperature than kinetic freeze-out (determining the spectral shape), so at least two independent temperatures may be needed.
-
3.
Furthermore the program has been enhanced to simultaneously describe protons and antiprotons in addition to pions. Here the decay contributions from and have been taken into account. This of course requires the introduction of another parameter: the baryonic chemical potential .
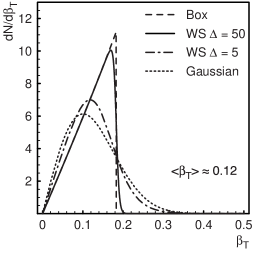
To better understand the importance of the different shapes of the source distribution, it is helpful to investigate the resulting velocity distributions:
| (4) |
and their mean values:
| (5) |
as they directly influence the shape of the momentum distribution, while the spatial distribution is actually not directly relevant. Fig. 1 shows velocity distributions for different shapes at a small average velocity of . For such small velocities the relation between rapidity and velocity may be approximated by a linear relation, so most of the expected properties of the distributions are preserved. One can see that the box profile yields a sharp cutoff of the velocity distribution. The Woods-Saxon with looks very similar to the box with a slightly smeared out edge. The Gaussian has a much more smooth edge resulting from the tail of the spatial distribution. The Woods-Saxon with provides a similar case as the Gaussian, both have considerable contributions at velocities much higher than the average which will finally lead to an inhanced yield at higher transverse momenta for the same inverse slope a low , i.e. to stronger curvature of the spectrum.
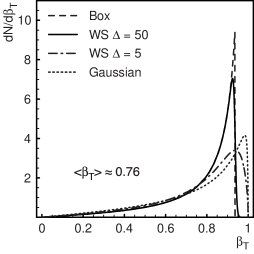
Fig. 2 shows similar distributions for a high average velocity of . Again the box profile leads to a sharp upper limit in velocity, but the triangular shape of the distribution is distorted by the non-linearity of the relation between and . The Woods-Saxon for is again similar to the box, and the one for and the Gaussian are also close. However, in this case the two latter distributions have a maximum shifted towards higher velocity which is also due to the non-linearity. Still, the general property of these distributions is that they have larger contributions at high velocities for the same average velocity as the other two distributions. For such large velocities it is noteworthy that the average velocity depends significantly on the recipe used to calculate it. If instead of equation 5 one uses:
| (6) |
the numerical values are larger by almost , and differ slightly for the different profiles. I will use the definition 5 throughout.
3 Hadron Spectra from SPS
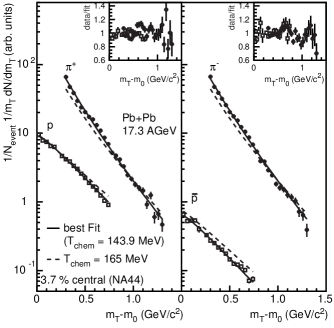
The model described above has first been compared to data from SPS heavy ion experiments. Data on pion, proton and antiproton production in the 3.7 most central Pb+Pb collisions from NA44 na44spec and in the 10 most central Pb+Pb collisions from NA49 na49spec1 ; na49spec2 have been used. The transverse mass spectra of NA44 are shown in Fig. 3, they cover the range of for pions and for protons and antiprotons. The model has been fitted to the data. The best agreement can be achieved with a kinetic temperature , an average transverse flow velocity , a chemical temperature and a baryonic chemical potential . For this fit the width parameter has been set to , allowing for a free variation of this parameter produces a slightly smaller value with a very large error while the other parameters remain unchanged. As the fits seem to be insensitive to small changes in , we have performed most fits with a fixed value. For systematic checks some of the constraints on the fits have been varied. Most of these changes, as e.g. omitting some of the data points (the lowest or highest in , resp.) from the fit, do not affect the parameter values significantly. Significant changes are obtained under the following conditions:
| Remarks | (MeV) | (MeV) | (MeV) | ||||
|---|---|---|---|---|---|---|---|
| NA44 data | |||||||
| best fit | |||||||
| no weak decays | |||||||
| broad profile | |||||||
| high | |||||||
| high | |||||||
| NA49 data | |||||||
| best fit | |||||||
| low omitted | |||||||
-
1.
All contributions from weakly decaying particles are ignored.
In this case the chemical temperature and the baryonic chemical potential change slightly, while the kinetic temperature and the flow velocity are essentially unaltered. This is understandable as the particle ratios may depend more strongly on this contribution than the shape of the spectra. As the quality of the fit is similar to the best fit above and a not precisely specified fraction of weak decays may contribute to the data, this has to be taken into account in the systematic error.
-
2.
The width parameter is set to .
In this case the chemical parameters show small changes, while the temperature and flow velocity change more significantly. This is mainly due to the fact that this spatial distribution, which is similar to a Gaussian, results in a broader velocity distribution. The quality of the fit is significantly worse than the fits given above.
-
3.
The kinetic and chemical temperatures have been set to the same value of and the chemical potential to .
Here, the flow velocity obtained is smaller than in the best fit, as is expected for a higher kinetic temperature. Again the fit quality is worse.
-
4.
The expansion velocity has been fixed to a value of . The fit quality is much worse than the best fit.
-
5.
The chemical temperature has been set to similar to results from fits of hadrochemical models to ratios of total multiplicities of different species pbm99 .
This fit cannot describe the spectra, it essentially has the wrong ratio of pions to protons. Of importance may be the different integration region in rapidity compared to pbm99 . If e.g. the rapidity distribution of protons is broader than the one of pions this may easily explain the smaller chemical temperature obtained here. However, for the purpose of this paper, we will just note this discrepancy and use the fit results as they are. The parameters obtained apparently describe the particle ratios at midrapidity investigated here, and this may be the relevant information which should be used also in estimating the contribution of resonances to the momentum spectra at this given rapidity.
Furthermore, it may be that part of the longitudinal motion of the source is not generated hydrodynamically but is a remnant of the initial state motion, which may be even more likely for participant protons. In this case it is not completely obvious, whether the protons observed at very different rapidities share the same chemical freeze-out temperature. If the spacetime-momentum correlation originates from a very early phase of the collision, a unique chemical temperature might not be applicable and the use of integrated multiplicities might be misleading. Rather, there is the possibility of a local temperature which may be applicable for limited rapidity regions.
The fit parameters obtained from the fits discussed above are summarized in table 1. None of the fits provides a perfect agreement with the data, which is due to a structure in the experimental spectra which can not be described within this model.
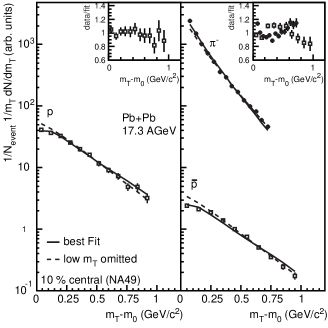
The transverse mass spectra of NA49 cover the range of for pions and for protons and antiprotons, they are shown in Fig. 4 together with fits of the model. As pions and protons are not available for the same centrality selection – pions have been measured for 5 central and (anti-)protons for 10 central – the pions have been rescaled by a factor of according to the number of participants in both samples marek . This will introduce an additional systematic error to the chemical parameters of the fits, which depend most significantly on the relative normalization of different species. The fitting conditions have been varied as above, the relative variation of the parameters is also similarly small. In fact, the chemical parameters are relatively similar with slightly smaller values compared to the NA44 data. However, for these data the best agreement can be achieved with a very low kinetic temperature and a very high average transverse flow velocity . It turns out that this significant difference to the NA44 data is to a large extent due to the behavior of the data (particularly of the protons and antiprotons) at very low . If the lowest three data points of all spectra are omitted from the fit, a kinetic temperature and an average transverse flow velocity are obtained with a much better . The parameters of this fit are relatively close to those obtained from the fit to NA44 data. The low data points of NA49 appear to disagree with the measurements by NA44. It is also seen from the best fit to NA49 data that the agreement is not perfect if all data points are included – there is a tendency of a larger inverse slope of the fit compared to the data especially for the antiprotons.
While the data used above have a limited range in transverse mass, one might also consider comparing such hydrodynamic distributions to data with a wider transverse momentum range. This has actually been done before at the SPS by WA98 wa98:hydro:99 , using also a program derived from the one of Wiedemann and Heinz wiedemann96 . However in this version the original assumption of the same temperature both for chemical and kinetic freeze-out was applied. Also, only neutral pion spectra were used, which give very limited information to determine all relevant parameters.
In the following, information from the above fits will be used while fitting the neutral pion spectra of WA98 wa98pi0 . Ideally one might just try to use exactly the same fits and compare it to the neutral pions. As the data are from different experiments and do not exactly use the same centrality selections, the normalization has to be kept as a free parameter. The centrality selections used below should however be similar enough, so that the shape of the spectra should not differ strongly.
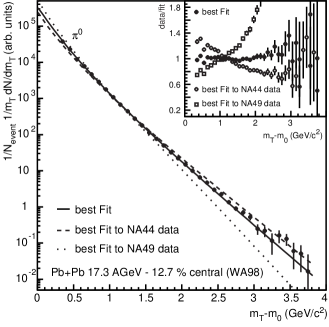
In Figure 5 fits using the parameters obtained above are compared to the neutral pion spectra for the most central reactions of Pb+Pb at 158 GeV. The “best fit” to NA44 in table 1 is shown as a dashed line, the one to NA49 data as a dotted line. The description is only superficially adequate. The fit to NA44 overshoots the data at large transverse masses, and one obtains a . The fit to NA49 is below the data at large transverse masses with a . This large difference for the pion spectra at high is of course due to the much larger flow velocity for the NA49 fit, which increases the proton inverse slope while decreasing the one of the pions compared to NA44. Another fit has been performed keeping only the parameters and the same as in the earlier fit and optimizing the kinetic temperature and the flow for the neutral pions. This fit (shown as a solid line) yields a good description with . The fit parameters obtained are and . The (dis-)agreement of the fits can also be judged from the inset in Figure 5, which shows the ratios of the data to the fits.
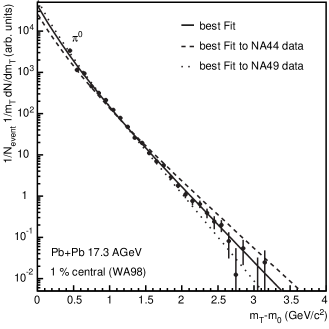
One might argue that the different centrality selections are responsible for the disagreement. Although this does not seem to be very likely, as it has been shown wa98pi0 , that the shape of the pion spectra does not vary strongly for medium-central to central collisions, a comparison to the most central data has been performed. The results are displayed in Figure 6. Again the dashed and dotted lines show fits with all parameters fixed as above from NA44 and NA49. The behavior of the fits is qualitatively similar to the one discussed above, the disagreement of the NA49 fit to the data is not as pronounced as before, which is due to the slightly steeper spectra in this case. The solid line shows a good fit with and . The different parameters for this second fit compared to the other central () sample are most likely not conclusive, but are an example that fitting momentum spectra of just one particle species leaves an ambiguity in the parameters. The higher flow velocity can be compensated by a lower temperature and vice versa. Also I will not put too much emphasis on the fact that the fits to the NA44 data appear to overpredict the pion yield at high , because part of this discrepancy might be due to systematic differences between the two experiments involved.
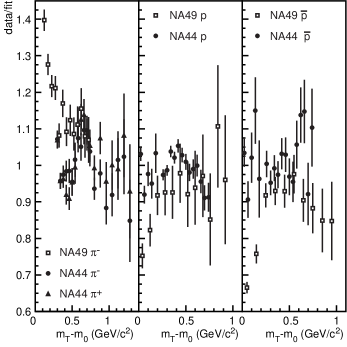
As one of the major uncertainties in this analysis appears to be related to different experimental data sets, it may be worthwhile to compare data of NA44 and NA49 directly. This has been done in Fig. 7 by plotting the ratio of the data to the best fit of the parameterization to NA44 data (first row in table 1). The same fit is used for both data sets, there is one overall normalization for all species which differs between experiments. One can clearly see that the deviations are most significant at low for protons and antiprotons. In the systematic studies it was found that the parameters for the fits to NA44 do not depend very much on the fitting range, while the parameters for NA49 change significantly when the lowest data points are not used. It should also be noted that these fits use data with statistical errors only, as systematic errors were not readily available for all data sets. If systematic errors would account for a significant fraction of the discrepancy between the two experiments, a simultaneous fit might be possible and yield more conclusive information. This could not be attempted in this paper.
One can however note that the hydrodynamic parameterization can account for a large fraction of the pion production at high , even if a profile with a negligible tail towards higher velocities ( – similar to the box profile) has been used. A more diffuse profile () would necessarily lead to a larger yield at high . Most of the other systematic variations studied do not lead to significant variations in this respect. The most important uncertainty relates to the discrepancy already seen between NA44 and NA49. Ignoring the very low data points of NA49 leads to a moderately high flow velocity. In this case the pion spectra may be almost entirely be explained by such a source. A very high flow velocity as suggested by the low NA49 data would considerably reduce the hydrodynamic yield of pions at high .
A fixed chemical temperature of leads to different results, but from Fig. 3 it is obvious that this would also lead to a larger overprediction at high . As sketched above, there may be reasons why this assumption may not be adequate for our analysis. In fact, it has been remarked in sollfrank99 ; kaneta01 that there is a rapidity dependence of chemical parameters. The chemical temperature of and the baryo-chemical potential of of the best fit can be compared to results of other analyses. As stated above, the temperature is lower than the values of becattini:sps and pbm99 obtained from rapidity integrated yields, but compares well with the result given in na44spec .
4 Hadron Spectra from RHIC
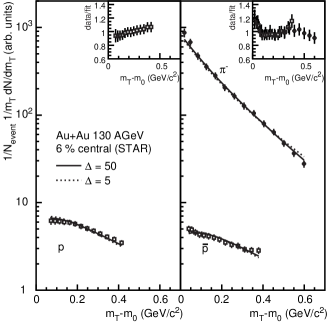
The situation at RHIC is more favorable for this analysis, as there exist data on different particle species partially reaching out to large measured under the same conditions within one experiment. The PHENIX experiment has presented spectra of neutral pions highpt and identified charged hadrons ppg006 ; phenix-hadron in central Au+Au collisions at . I will also use the data from the STAR experiment starpbar ; starp ; starpi , which only cover low . From the STAR experiment, the most recent data on protons and antiprotons use a sample of the most central collisions, while the pions have been extracted from the most central collisions. I will ignore this difference, as it should not significantly affect the shapes of the spectra, however, there may be small effects on the relative normalization which would result in an additional systematic error for the chemical parameters.
A similar procedure as for the SPS data above is followed, with the addition of using dependent systematic errors. For this a systematic error of added in quadrature to the errors for the PHENIX data (which contain part of the systematic error already) has been assumed ppg009 . For STAR data a systematic error of has been used for the antiproton spectra starpbar . The proton and pion spectra starp ; starpi were already quoted with a systematic error. These does not include all of the normalization errors, so they might still further affect the chemical parameters extracted. Fits are performed to the charged pions for and to (anti)protons for . Systematic variations of the fitting assumptions are done as above. In addition I have studied fits to a limited transverse mass range for pions and (anti)protons in PHENIX.
The results are summarized in table 2, a comparison of some of the fits to the PHENIX data is shown in Fig. 8, those to the STAR data are displayed in Fig. 9.
| Remarks | (MeV) | (MeV) | (MeV) | ||||
|---|---|---|---|---|---|---|---|
| PHENIX data | |||||||
| narrow profile (A) | |||||||
| wide profile (A′) | |||||||
| low - narrow | |||||||
| low - wide | |||||||
| no weak decays - narrow | |||||||
| no weak decays - wide | |||||||
| - narrow | |||||||
| - wide | |||||||
| STAR - narrow | |||||||
| STAR - wide | |||||||
| STAR data | |||||||
| narrow profile (B) | |||||||
| wide profile (B′) | |||||||
| no weak decays - narrow | |||||||
| no weak decays - wide | |||||||
| - narrow | |||||||
| - wide | |||||||
| PHENIX - narrow | |||||||
| PHENIX - wide | |||||||
| PHENIX + STAR data | |||||||
| narrow profile (C) | |||||||
| wide profile | |||||||
| no weak decays - narrow | |||||||
| no weak decays - wide | |||||||
| - narrow | |||||||
| - wide | |||||||
The fits to PHENIX data show slightly better agreement for a wide profile (), however, the difference in is small. As can be seen in Fig. 8, the fit for (dotted line) has a more important contribution at high . The STAR data are generally better described using the narrow profile, the differences are, however, not easily discernible in Fig. 9. For PHENIX, the two different kinds of fits yield very similar fit parameters, while there are slightly stronger variations when looking at the STAR data. As there does not seem to be a strong preference for the wider profile in any of the data sets and as there are also theoretical arguments from true hydrodynamical calculations huovinen01 , I will base most of the discussion below on the fits with a narrow profile. For both data sets fits ignoring weak decays yield higher chemical temperatures and slightly lower kinetic temperatures. The biggest difference is again between the two experiments. The chemical parameters still show only a small effect, e.g. while fit (A) to PHENIX data yields and , the values for STAR (B) are slightly smaller with and . These values are similar to the results in pbm-rhic where and are given. The better agreement at RHIC compared to SPS of the chemical parameters of this analysis with those of the integrated yields may be related to the fact that boost invariance is a much better approximation in the RHIC case. Larger differences are seen for the kinetic parameters. Fit (A) yields and , fit (B) and . As a check also fits have been performed which use the kinetic temperature from one experiment as a fixed parameter in a fit to the other experiment, and vice versa. A reasonable fit to the STAR data (with a higher ) can be obtained this way by using a high kinetic temperature, but the flow velocity turns out to be larger than for PHENIX. In the other case, the fit to PHENIX data with a low temperature yields a much higher – no good fit can be obtained. There have been fits to the PHENIX data using hydrodynamic parameterizations that do not include resonances qm02:jane . These yield similar average flow () velocities but smaller kinetic freeze-out temperatures () – this difference is consistent with the influence of resonance decays.
Fits assuming a unique temperature of for both kinetic and chemical freeze-out as in broniowski are again much worse in fit quality for both shapes of the source distribution, as can be seen from the large in table 2. The assumption of simultaneous kinetic and chemical freeze-out underlying this fit is questionable, but I will still consider such a fit once more below. One might argue that the transverse mass range used in these fits does include possible contributions of hard scattering. However, fits which use data only for low () yield very similar results as seen in table 2.
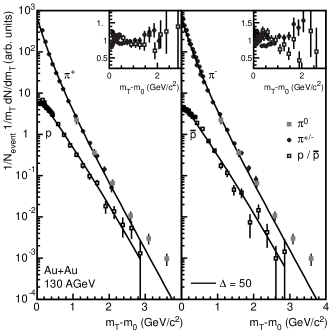
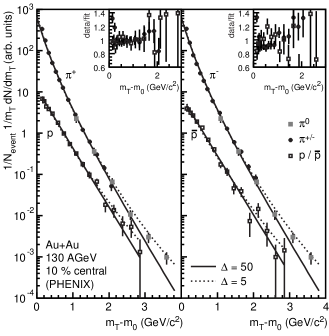
Finally, a simultaneous fit to STAR and PHENIX data has been performed, where the STAR data have been rescaled by a factor 0.92 (ratio of the number of participants) to account for the different centrality selection. Please note that such a simultaneous fit is only successful if one includes the systematic errors. Considering just statistical errors, the data from the two experiments could not be consistently described by this model. The results are also given in table 2, the best fit (C) is compared to the data in Fig. 10. Fit (C) is obtained using and describes the data reasonably well with . Chemical parameters change relatively little. As might be expected the kinetic parameters are intermediate between those for the individual experiments, one finds and . Once again a fit using is significantly worse.
5 Discussion
The results for SPS and RHIC data may now be compared to each other. In both cases a box-like profile is favored over a Gaussian-like profile. It was already discussed in wa98:hydro:99 that a box-like profile would be required in case of a large flow velocity, and this was also found to be the preferred profile in tomasik99 . Such a distribution with little or no “tail” to higher velocities is also closer to expectations from true hydrodynamic calculations huovinen01 . In both cases (SPS and RHIC) there are fits with a range of flow velocities, depending mainly on the experiment that one concentrates on. At the SPS the range of velocities is and the analysis presented here does not allow to constrain this value further. At RHIC a combined fit is possible, which yields as the most likely value . Similarly the range of kinetic freeze-out temperatures for the SPS is , while the RHIC value appears to be . Apparently this analysis indicates that the flow velocities at SPS and RHIC may be similar, and there is no clear indication of stronger collective flow at RHIC as found in xu:qm01 . It can, however, be seen in xu:qm01 that this is strongly influenced by the proton and antiproton spectra from STAR used in the analysis, which show a much larger inverse slope than the PHENIX results.
Both for SPS and RHIC there are still considerable uncertainties which are related to the experimental data themselves. For the SPS these imply large uncertainties for the extrapolation of the hydrodynamical fits to higher . Still, if we attempt to ascribe particle production at low in heavy-ion collisions at the SPS to hydrodynamic scenarios, the extrapolation of the hydrodynamic contribution to high will yield a considerable contribution of hydrodynamic production.
For RHIC the measurement of protons and antiprotons at higher does provide additional constraints and excludes some of the extreme scenarios. A simultaneous fit to STAR and PHENIX has been performed, which yields a reasonable agreement with the available data. In the following I will assume that this fit describes the contribution of a hydrodynamic source to particle emission. It does describe the spectra almost entirely at low . At higher the fit starts to deviate, which is not surprising, as one would expect additional production mechanisms, especially hard scattering, to play a role there. However, this hydrodynamic contribution may be still significant even at high momenta – this would be of particular relevance to any study of hard scattering, because to be able to obtain information on hard scattering production one would have to know this hydrodynamic contribution and take it into account.
A simple partitioning of the produced particles into either hydrodynamic or hard scattering production is not possible. If one believes that equilibration is taking place in these collisions, there will almost necessarily be parts of the reaction volume that are only partially equilibrated. At RHIC the high part of the non-equilibrated spectrum (with a power-law shape from hard scattering) should have a larger inverse slope than the equilibrated spectrum (similar to exponential). So in this case equilibration through multiple collisions will slow particles down and soften the spectrum. As the degree of equilibration will vary throughout the reaction volume, the spectrum might be a superposition of a range of spectra between the one from the initial collisions and a thermalized one.
At this point one does not necessarily need to distinguish between parton and hadron degrees of freedom. Thus, parton energy loss would just be one possible equilibration mechanism. While it is not possible to precisely predict how close the final distribution would be to a thermal (hydrodynamic) distribution, the latter can be taken as a limiting case. If hard scattered partons are completely quenched, one will still end up with a thermal distribution as a minimum yield. Any excess over this minimum might be due to non-equilibrated contributions, either true hard scattering production or not completely equilibrated production, which still has a higher average momentum than the thermal.
The discussion in this paper assumes that the spectra in the intermediate momentum region can be described by thermal distributions. This is not completely correct, as e.g. even hard scatterings will produce some lower momentum component. However, as any comparison of pure hydrodynamics to data, I will assume for the following that this non-thermal contribution at low and intermediate is negligible.
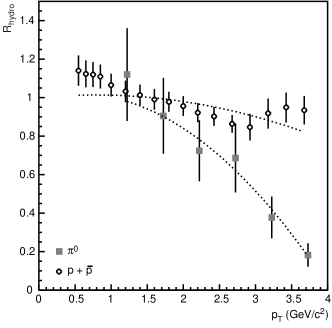
In Fig. 11 ratios of the simultaneous fit (C) to the experimental data, i.e. the fractions of the produced particles accounted for by the hydrodynamic parameterization, are shown for neutral pions (solid squares) and for protons+antiprotons (open circles) as a function of .
The proton+antiproton yield is reasonably described by this fit in the entire range investigated, as can be seen by the more or less constant ratio. The hydrodynamic contribution to pions depends more strongly on . While here hydrodynamics dominates also at lower , there is a steady decrease of the contribution towards higher . Still even for the hydrodynamic contribution to the pion yield is close to .
The not completely thermalized part of the emitted hadrons will reflect itself in other observables. A dependent non-thermalized contribution to the spectrum will be related to a dependent deviation of the measured elliptic flow from the purely hydrodynamic behavior, because the latter relies on equilibration achieved earlier in the collision history than kinetic freeze-out. Quantitative estimates of this are difficult, as the partially thermalized contribution will lead to an unknown contribution to . Full hydrodynamic calculations, when applied to elliptic flow and particle spectra, should be able to extract more information on this.
6 Summary
Results of hydrodynamic fits to momentum spectra at mid-rapidity in heavy ion reactions at the SPS and at RHIC have been presented. While at RHIC a simultaneous description of STAR and PHENIX data is possible, when systematic errors are taken into account, there are still unresolved differences at SPS depending on the experiment used. At SPS a chemical temperature of and a baryo-chemical potential of have been obtained. This chemical temperature is slightly smaller than values obtained from rapidity integrated yields. At RHIC the corresponding values are and . The kinetic parameters are and at SPS and and at RHIC when using a velocity profile similar to a box profile. The momentum spectra at RHIC are broader than at the SPS. However, this analysis does not prove a significantly stronger transverse flow at RHIC, the change in the momentum spectra might also be due to a higher freeze-out temperature. At high transverse momenta the spectra of protons can be nicely described at RHIC. The pion spectra leave room for additional particle production mechanisms (e.g. hard scattering) at high . Estimates of the suppression of hard scattering should, however, take the non-negligible contribution from a hydrodynamic source into account. Important hydrodynamic contributions in spectra at high require even stronger quenching of hard scattering production. In return, quenching is a necessary condition to achieve locally equilibrated distributions.
Acknowledgements.
The author would like to thank U.A. Wiedemann for helpful discussions and J.M. Burward-Hoy, M. Calderón de la Barca Sánchez, M. Gazdzicki, M. Kaneta, K. Schweda, R. Snellings for valuable information regarding the experimental data. Part of this work was created at the University of Münster and at GSI Darmstadt.References
- (1) E. Schnedermann, J. Sollfrank, and U. Heinz, Phys. Rev. C 48 (1993) 2462.
- (2) S. Chapman, J. R. Nix and U. Heinz, Phys. Rev. C 52 (1995) 2694.
- (3) P .Braun-Munzinger et al., Phys. Lett. B 344 (1995) 43.
- (4) U.A. Wiedemann and U. Heinz, Phys. Rev. C 56 (1997) 3265.
- (5) NA49 Collaboration, H. Appelshäuser et al., Eur. Phys. J. C 2 (1998) 661–670.
- (6) WA80 Collaboration, R. Albrecht et al., Eur. Phys. J. C 5 (1998) 255.
- (7) WA98 Collaboration, M.M. Aggarwal et al., Phys. Rev. Lett 83 (1999) 926.
- (8) B. Tomasik, U.A. Wiedemann, and U. Heinz, preprint nucl-th/9907096.
- (9) PHENIX Collaboration, K. Adcox et al., Phys. Rev. Lett. 88 (2002) 022301.
- (10) STAR Collaboration, C. Adler et al., Phys. Rev. Lett. 87 (2001) 182301.
- (11) PHENIX Collaboration, K. Adcox et al., submitted to Phys. Rev. Lett., preprint nucl-ex/0204005.
- (12) NA49 Collaboration, P.G. Jones et al., Nucl. Phys. A 610 (1996) 188c.
- (13) NA44 Collaboration, I.G. Bearden et al., submitted to Phys. Rev. C, preprint nucl-ex/0205002.
- (14) NA49 Collaboration, S.V. Afanasiev et al., submitted to Phys. Rev. C, preprint nucl-ex/0202019.
- (15) NA49 Collaboration, S.V. Afanasiev et al., proceedings of Quark Matter 2002, Nantes, France.
- (16) P. Braun-Munzinger, I. Heppe, and J. Stachel, Phys.Lett. B 465 (1999) 15-20.
- (17) M. Gazdzicki, private communication.
- (18) WA98 Collaboration, M.M. Aggarwal et al., Eur. Phys. J. C 23 (2002) 225-236.
- (19) J. Sollfrank, U. Heinz, H. Sorge, and N. Xu, Phys. Rev. C 59 (1999) 1637.
- (20) M. Kaneta, and N. Xu, J. Phys. G 27 (2001) 589.
- (21) F. Becattini, J. Cleymans, A. Keränen, E. Suhonen, and K. Redlich, Phys. Rev. C 64 (2001) 024901.
- (22) PHENIX Collaboration, K. Adcox et al., Phys. Rev. Lett. 88 (2002) 242301.
- (23) PHENIX Collaboration, J. Velkovska et al., talk at ICPA-QGP 2001 Jaipur, to be published in Pramana - Journal of Physics.
- (24) STAR Collaboration, C. Adler et al., Phys. Rev. Lett. 87 (2001) 262302.
- (25) STAR Collaboration, K. Schweda et al., proceedings of RIKEN BNL Workshop Vol.42 (2002) p.57,eds. M. Gyulassy, D. Kharzeev, and N. Xu, Brookhaven National Laboratory, Upton, NY 11973-500, USA.
- (26) M. Calderon, PhD thesis, Yale university, 2001, preprint nucl-ex/0111004.
- (27) PHENIX Collaboration, K. Adcox et al., in preparation.
- (28) P. Huovinen, P.F. Kolb, U. Heinz, P.V. Ruuskanen, and S.A. Voloshin, Phys. Lett. B 503 (2001) 58-64
- (29) P. Braun-Munzinger, D. Magestro, K. Redlich and J. Stachel, Phys. Lett. B 518 (2001) 41-46.
- (30) PHENIX collaboration, J.M. Burward-Hoy et al., talk at Quark Matter 2002, Nantes, to be published in Nucl. Phys. A, preprint nucl-ex/0210001.
- (31) W. Broniowski and W. Florkowski, Phys.Rev.Lett. 87 (2001) 272302.
- (32) N. Xu and M. Kaneta, Nucl. Phys. A 698 (2002) 306c.