Present address:]Department of physics, University of Notre Dame, Notre Dame, IN 46556
Isoscaling bearing information on the nuclear caloric curve
Abstract
We show that the qualitative behavior of the nuclear caloric curve can be inferred from the energy dependence of the isoscaling parameters. Since there are strong indications that the latter are not distorted by the secondary decay of primary hot fragments, in contrast to other observables, this suggests that valuable information on the nuclear caloric curve may be obtained through the analysis presented in this work.
pacs:
25.70.Pq, 24.60.-kThe determination of the nuclear caloric curve is key to the understanding of the multifragment emission observed in heavy-ion collisions at intermediate energies Campi et al. (1996); Das et al. (2003). Indeed, equilibrium statistical calculations predict a continuous rise of the breakup temperature as a function of the excitation energy of the disassembling system if the multifragment emission takes place at fixed density Tan et al. (2003); Das et al. (2003); Bondorf et al. (1998). In this case, the pressure at the breakup stage increases monotonously as a function of the excitation energy. On the other hand, a wide plateau should be observed Bondorf et al. (1985a); Bondorf et al. (1998) if the onset of multifragmentation occurs after a rapid rise of the pressure, which is accompanied by a steady decrease of the breakup density as the excitation energy increases Bondorf et al. (1985a). Similar conclusions have also been obtained with a soluble thermodynamic model by Das et al. Das et al. (2003).
The experimental observation of the caloric curve has been intensively debated in the last years Natowitz et al. (2002); Moretto et al. (1996); Campi et al. (1996); Péter (1998); Gupta et al. (2001) since different measurements have led to distinctly different conclusions Natowitz et al. (2002); Ruangma et al. (2002); Kwiatkowski et al. (1998); Pochodzalla et al. (1994); Hauger et al. (1996); Ma et al. (1997); Serfling et al. (1998); Xi et al. (1998). One problem is due to the great difficulties in measuring the nuclear temperature as this quantity can only be inferred from fragment information measured long after the breakup stage. It has been shown that side feeding from the deexcitation of the primordial hot fragments Xi et al. (1999); Gupta et al. (2001); Péter (1998); Siwek et al. (1998); Kolomiets et al. (1996) may bias empirical conclusions drawn from the different methods currently employed Morrissey et al. (1984); Albergo et al. (1985); Veselsky et al. (2001); Siwek et al. (1998) in the determination of the breakup temperature.
In this context, the isotopic scaling recently observed in nuclear reactions, in a broad range of bombarding energies Xu et al. (2000); Tsang et al. (2001a, b); Botvina et al. (2002); Shetty et al. (2003); Souliotis et al. (2003), is expected to be rather insensitive to effects associated with the secondary decay of the primary fragments Tsang et al. (2001b); Souza et al. (2003). More precisely, the ratio between the multiplicity of a fragment whose proton and neutron numbers are, respectively, and , measured in two reactions (1 and 2) with different isospin, follows the relation:
| (1) |
where and are the isoscaling parameters and is a normalization constant. This scaling property is very robust. As is shown in refs. Tsang et al. (2001a); Shetty et al. (2003); Souliotis et al. (2003), it has been observed in deep inelastic reactions, evaporation processes, besides nuclear multifragmentation.
One explanation for this scaling behavior may be found in the grand-canonical ensemble, in which the multiplicity is given by:
| (2) |
where is the breakup temperature, and respectively stand for the neutron and proton chemical potentials and
| (3) |
In the above expression, is the mass number, and are, respectively, the fragment’s binding energy and spin degeneracy factor. The excitation energy of the fragment is taken into account by the internal free energy . The free volume is a parameter of the calculation and , where is the nucleon mass.
If the breakup takes place in the two reactions at the same temperature and density, the ratio involving cancels out and one finds that:
| (4) |
where the superscripts label reactions (1) and (2). Although the observed yields are affected by the decay of the primary fragments, the form of Eq. (2) is still expected to hold, even though will be given by a more complex expression. Since might be very similar in the two reactions, as long as the breakup temperatures are close enough, the isoscaling parameters should be safely obtained from the final yields Tsang et al. (2001b); Souza et al. (2003) and, therefore, should bear reliable information on the breakup stage.
Owing to the exponential relationship between the system mass and the chemical potential, should be a slowly varying function of the temperature. This is indeed confirmed by our calculations (see below), in agreement with the findings of ref. Botvina et al. (2002). Therefore, the robustness of the isoscaling parameters may be used to investigate the qualitative behavior of the caloric curve.
To address this point, we apply the isoscaling analysis to the decay products of reactions in which a thermally equilibrated source with excitation energy breaks up statistically. We consider a proton rich source, whose mass and atomic numbers are and , which corresponds to reaction (1). In the second reaction, we use a neutron rich source, with and . The improved version Tan et al. (2003) of the statistical multifragmentation model (ISMM) developed in refs. Bondorf et al. (1985b, a); Sneppen (1987), and described below, is used in the following calculations to simulate the decay of the excited source. Either implementation of this model is useful in the present study since, under different assumptions for the breakup density, it predicts qualitatively different caloric curves Bondorf et al. (1998). Thus its predictions can provide the input to investigate the sensitivity of the isoscaling parameters on the qualitative shape of the caloric curve.
In the ISMM model, partitions strictly consistent with the constraints:
| (5) |
and
| (6) |
are imposed. In the above equations, denotes the multiplicity, in each generated partition, of fragments whose mass and atomic numbers are and , is the ground state energy of the source, represents the elementary charge, and is the radius of a sphere with a volume , corresponding to the breakup volume. The energy contains contributions from the fragment’s binding energy, excitation energy, translational motion, besides the remaining Coulomb terms which, through the Wigner-Seitz approximation, provide the corrections to account for the Coulomb repulsion between the fragments Bondorf et al. (1985b). A Monte Carlo sample of the possible fragmentation modes is carried out following Sneppen (1987). The breakup temperature is determined, for each partition, by solving Eq. (6).
The main differences from the ISMM Tan et al. (2003) and the original SMM Bondorf et al. (1985b, a); Sneppen (1987) are in the use of internal free energies built from empirical data on discrete states wherever available and of experimental binding energies all over the mass table Audi and Wapstra (1995). Careful extrapolations are carried out to mass regions where the information is not available in either case Tan et al. (2003); Souza et al. (2003). Both quantities influence directly the determination of in each fragmentation mode , whereas the free energies also play an important role in the evaluation of the entropy , which enters in the calculation of any physical observable :
| (7) |
Due to the constraints imposed on each partition, a physical observable fluctuates from one fragmentation mode to the other.
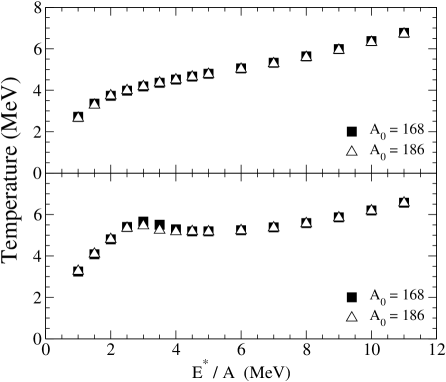
The average breakup temperature may be obtained through the above expression and it is shown in Fig. 1 as a function of the excitation energy for the two sources we consider. In order to suppress statistical fluctuations, a billion events have been generated for each excitation energy. A monotonous increase of the temperature is observed in the upper panel, in which case the breakup volume of the system is kept constant and is 6 times larger than its value at normal density. One also observes that the average temperatures are very similar for both sources, which justifies the assumption that the temperature dependent terms in cancel out in Eq. (1). As stated before, and reported in ref. Bondorf et al. (1998), the situation is qualitatively different as one allows the breakup volume to be multiplicity dependent and a plateau is observed approximately between 3.5 and 7 MeV/A. The breakup temperatures in both systems are quite close, except at the region around the onset of multifragmentation, MeV, where small differences may be noticed.
In contrast to an earlier study also using the SMM Ogul and Botvina (2002), in which a larger isospin dependence in the plateau region was predicted, such effect is rather reduced in our calculations. To understand this aspect, we rewrite Eq. (6) in the following way:
| (8) |
where denotes the multiplicity of fragments with mass in the fragmentation mode considered and the total fragment multiplicity is represented by . The quantity stands for the radius of the cell in which the fragment is embedded as one subdivides the system in order to apply the Wigner-Seitz approximation Bondorf et al. (1985b).
The first term on the right hand side of Eq. (8) corresponds to the fragments’ kinetic energy (in the center of mass reference frame of the total system) and represents the internal excitation energy of a fragment with mass at temperature . We suppressed any dependence in since it has been introduced in SMM only in ref. Tan et al. (2003). It entered in previous calculations only in the case of nuclei because all light fragments () were assumed to have no internal degrees of freedom, except for the alpha particles. Therefore, all the dependence on isospin is confined to the left hand side of this equation.
An increase of enhances the Coulomb term between brackets in Eq. (8) and, as a consequence, tends to lower the temperature, which appears only on the right hand side of the above expression. This is the effect observed in ref. Ogul and Botvina (2002).
Nevertheless, the binding energies play a very important role in the balance of the equation and, consequently, on the temperature extracted from it. It is shown in ref. Souza et al. (2003) that total binding energies calculated through simple liquid drop mass formulae, such as that used in ref. Ogul and Botvina (2002), deviate appreciably from empirical values. The differences reported in ref. Souza et al. (2003) can be as large as 40 MeV for heavy nuclei and are, on the average, around 10 MeV for light fragments. Therefore, calculated in Ogul and Botvina (2002) has systematic errors which further increase the isospin dependence of the temperature. Our results, which are obtained with empirical binding energies and careful extrapolations to mass regions where this information is not avaliable, as described in Souza et al. (2003); Tan et al. (2003), exhibit a much weaker isospin dependence.
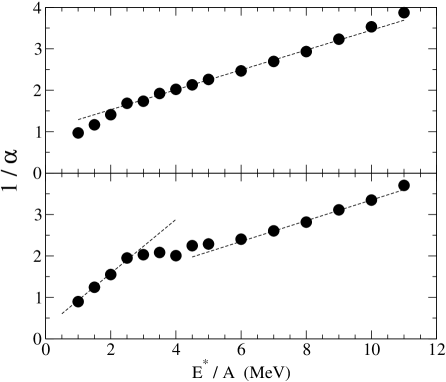
We now investigate the extent to which the isoscaling parameters carry informaton on the caloric curve and show, in Fig. 2, as a function of the excitation energy. The parameters are obtained by fitting Eq. (1) to the primary yields predicted by the microcanonical ISMM calculations, with the same isotopes, , 2,, 8, used in ref. Tsang et al. (2001b). We have checked that, in agreement with Tsang et al. (2001b); Souza et al. (2003), the changes in due to the secondary decay Tan et al. (2003) of the primordial fragments are of the order of 5% at , 6, and 9 MeV and, therefore, do not change our conclusions. As in the previous plot, the results shown in the upper panel correspond to a fixed breakup density whereas it is allowed to change in the lower part of the picture. The results reveal distinct qualitative behaviors in each case. More specifically, the reciprocal of follows approximately a straight line for almost the full range of excitation energies considered if the breakup density is kept fixed. A clear change of slope, before and after the plateau region, appears if the breakup volume is multiplicity dependent. The plateau observed in the caloric curve is not so apparent in the plot because, although varies slowly compared to , it somewhat distorts the curve. The relevant point here is that one should observe different qualitative behaviors in the plot according to the characteristics of the caloric curve. Similar conclusions are obtained with the parameter, but we concentrate on because, as shown in refs. Tsang et al. (2001b); Souza et al. (2003), might change more than after secondary decay of the primary fragments, probably due to Coulomb effects. The distinction between the two scenarios allows one to ascertain the existence of the plateau in the caloric curve. It is worth mentioning that the experimental results presented in Botvina et al. (2002) seem to favour the monotonous increase of the breakup temperature. However, since in this reference is plotted as a function of the bombarding energy, further analysis is needed to draw more precise conclusions.
In order to investigate the dependence of the results on the statistical ensemble employed, we also calculate the primary yields, for the two sources considered here, in the framework of the grand-canonical approach. To prevent artificial deviations, we use the same ingredients of the micro-canonical case, such as binding energies, internal free energies, and spin degeneracy factors. The free volume and the breakup temperature, which enter into eqs. (2) and (3), are obtained from the micro-canonical calculation for each excitation energy, instead of considering them as free parameters as is usually assumed. Given these two quantities, the chemical potentials are calculated by imposing that:
| (9) |
where is computed through eqs. (2) and (3). The chemical potentials are found by minimizing the difference between the left and the right hand sides of the above equations. We impose that the constraints are fulfilled with a precision better than 3 digits. Once the chemical potentials are obtained, the primary yields may be evaluated through eqs. (2) and (3).
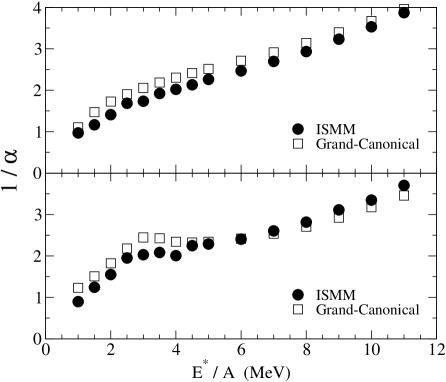
The predictions of the two ensembles are compared in Fig. 3, where the results of the grand-canonical calculations are depicted by the open squares whereas the full circles represent those obtained with the micro-canonical ensemble. The isoscaling parameters are obtained by fitting Eq. (1) using the grand-canonical yields, as is done in the micro-canonical calculation. It may be noticed that, although the absolute values differ from one statistical approach to the other, both exhibit the same qualitative behavior. We have checked that and obtained through Eq. (4) agree fairly well with the grand-canonical values displayed in this picture. Small deviations are observed only in the regions in which the difference between the breakup temperatures of the sources are non-negligible. Besides showing the consistency of the isoscaling assumptions, this confirms the expectation that small differences between the average temperatures of the two sources should not appreciably affect the scaling properties.
The difference between the predictions of the two statistical approaches may be attributed to the strong mass, charge, and energy constraints imposed in the micro-canonical calculations in each partition. These restrictions lead to a fairly broad temperature distribution Souza et al. (2000), corresponding to different fragmentation modes. In contrast, the temperature is kept constant in the grand-canonical ensemble whereas the charge, mass and energy are fixed only on the average and not event by event. However, the qualitative agreement between the two calculations is a very positive aspect since it is extremely difficult to select events whose decaying sources strictly obey these constraints in experiments. Therefore our analysis seem to indicate that, at least, the qualitative behavior of the caloric curve may be studied experimentally.
In conclusion, we suggest that the existence of the plateau in the nuclear caloric curve may be better investigated experimentally through the isoscaling analysis. Clear deviations from the linear behavior are expected to be found in the vs curve if the plateau exists. Conversely, if this plateau does not exist, the vs curve should follow a straight line over a wide excitation energy domain. Our results indicate that the determination of the qualitative shape of the caloric curve can be done more reliably using the isoscaling analysis than through measurements of the temperature from the multiplicities of the detected fragments.
Acknowledgements.
We would like to acknowledge CNPq and FUJB for partial financial support. This work was supported in part by the National Science Foundation under Grant No. PHY-01-10253 and INT-9908727 and by the CNPq-NSF agreement.References
- Campi et al. (1996) X. Campi, H. Krivine, and E. Plagnol, Phys. Lett. B 385, 1 (1996).
- Das et al. (2003) C. B. Das, S. Das Gupta, and A. Z. Mekjian, Phys. Rev. C 68, 014607 (2003).
- Tan et al. (2003) W. P. Tan, S. R. Souza, R. J. Charity, R. Donangelo, C. K. Gelbke, W. G. Lynch, and M. B. Tsang, Phys. Rev. C 68, 034609 (2003).
- Bondorf et al. (1998) J. P. Bondorf, A. S. Botvina, and I. N. Mishustin, Phys. Rev. C 58, 27 (1998).
- Bondorf et al. (1985a) J. P. Bondorf, R. Donangelo, I. N. Mishustin, and H. Schulz, Nucl. Phys. A444, 460 (1985a).
- Natowitz et al. (2002) J. Natowitz, R. Wada, K. Hagel, T. Keutgen, M. Murray, A. Makeev, L. Qin, P. Smith, and C. Hamilton, Phys. Rev. C 65, 034618 (2002).
- Moretto et al. (1996) L. Moretto, R. Ghetti, L. Phair, K. Tso, and J. Wozniak, Phys. Rev. Lett. 76, 2822 (1996).
- Péter (1998) J. Péter, Il Nouvo Cimento A 111, 977 (1998).
- Gupta et al. (2001) S. D. Gupta, A. Z. Mekjian, and M. B. Tsang, Adv. Nucl. Phys. 26, 91 (2001).
- Ruangma et al. (2002) A. Ruangma, R. Laforest, E. Martin, E. Ramakrishnan, D. J. Rowland, M. Veselsky, E. M. Winchester, S. J. Yennello, L. Beaulieu, W. c. Hsi, et al., Phys. Rev. C 66, 044603 (2002).
- Kwiatkowski et al. (1998) K. Kwiatkowski, A. S. Botvina, D. S. Bracken, E. R. Foxford, W. A. Friedman, R. G. Korteling, K. B. Morley, E. Pollacco, V. E. Viola, and C. Volant, Phys. Lett. B 423, 21 (1998).
- Pochodzalla et al. (1994) J. Pochodzalla, T. Möhlenkamp, T. Rubehn, A. Schüttauf, A. Wörner, E. Zude, M. Begermann-Blaich, T. Blaich, H. Emling, A. Ferrero, et al., Phys. Rev. Lett. 75, 1040 (1994).
- Hauger et al. (1996) J. A. Hauger, S. Albergo, F. Bieser, F. P. Brady, Z. Caccia, D. A. Cebra, A. D. Chacon, J. L. Chance, Y. Choi, S. Costa, et al., Phys. Rev. Lett. 77, 235 (1996).
- Ma et al. (1997) Y. Ma, A. Siwer, J. Péter, F. Gulminelli, R. Dayras, L. Nalpas, B. Tamain, E. Vient, G. Auger, C. Bacri, et al., Phys. Lett. B 390, 41 (1997).
- Serfling et al. (1998) V. Serfling, C. Schwarz, R. Bassini, M. Begemann-Blaich, S. Fritz, S. J. Gaff, C. Gross, G. Immé, I. Iori, U. Kleinevoss, et al., Phys. Rev. Lett. 80, 3928 (1998).
- Xi et al. (1998) H. F. Xi, G. J. Kunde, O. Bjarki, C. K. Gelbke, R. C. Lemmon, W. G. Lynch, D. Magestro, R. Popescu, R. Shomin, M. B. Tsang, et al., Phys. Rev. C 58, 2636 (1998).
- Xi et al. (1999) H. Xi, W. G. Lynch, M. B. Tsang, W. A. Friedmann, and D. Durand, Phys. Rev. C 59, 1567 (1999).
- Siwek et al. (1998) A. Siwek, D. Durand, F. Gulminelli, and J. Péter, Phys. Rev. C 57, 2507 (1998).
- Kolomiets et al. (1996) A. Kolomiets, E. Ramakrishnan, H. Johnston, F. Gimeno-Nogues, B. H. D. O’Kelly, D. J. Rowland, S. Shlomo, T. White, J. Winger, and S. J. Yennello, Phys. Rev. C 54, 472 (1996).
- Morrissey et al. (1984) D. J. Morrissey, W. Benenson, E. Kashy, B. Sherrill, A. D. Panagiotou, R. A. Blue, R. M. Ronningen, J. van der Plicht, and H. Utsunomiya, Phys. Lett. B 148, 423 (1984).
- Albergo et al. (1985) S. Albergo, S. Costa, E. Constanzo, and A. Rubbino, Il Nouvo Cimento 89, 1 (1985).
- Veselsky et al. (2001) M. Veselsky, R. W. Ibbotson, R. Laforest, E. Ramakrishman, D. J. Rowland, A. Ruangma, E. Winchester, E. Martin, and S. J. Yennello, Phys. Lett. B 497, 1 (2001).
- Xu et al. (2000) H. S. Xu, M. B. Tsang, T. X. Liu, X. D. Liu, W. G. Lynch, W. P. Tan, A. Vander Molen, G. Verde, A. Wagner, H. F. Xi, et al., Phys. Rev. Lett. 85, 716 (2000).
- Tsang et al. (2001a) M. B. Tsang, W. A. Friedman, C. K. Gelbke, W. G. Lynch, G. Verde, and H. S. Xu, Phys. Rev. Lett. 86, 5023 (2001a).
- Tsang et al. (2001b) M. B. Tsang, C. K. Gelbke, X. D. Liu, W. G. Lynch, W. P. Tan, G. Verde, H. S. Xu, W. A. Friedman, R. Donangelo, S. R. Souza, et al., Phys. Rev. C 64, 054615 (2001b).
- Botvina et al. (2002) A. S. Botvina, O. V. Lozhkin, and W. Trautmann, Phys. Rev. C 65, 044610 (2002).
- Shetty et al. (2003) D. V. Shetty, S. J. Yennello, E. Martin, A. Keksis, and G. A. Souliotis, Phys. Rev. C 68, 021602 (2003).
- Souliotis et al. (2003) G. A. Souliotis, D. V. Shetty, M. Veselsky, G. Chubarian, L. Trache, A. Keksis, E. Martin, and S. J. Yennello, Phys. Rev. C 68, 024605 (2003).
- Souza et al. (2003) S. R. Souza, P. Danielewicz, S. Das Gupta, R. Donangelo, W. A. Friedman, W. G. Lynch, W. P. Tan, and M. B. Tsang, Phys. Rev. C 67, 051602 (2003).
- Bondorf et al. (1985b) J. P. Bondorf, R. Donangelo, I. N. Mishustin, C. J. Pethick, H. Schulz, and K. Sneppen, Nucl. Phys. A443, 321 (1985b).
- Sneppen (1987) K. Sneppen, Nucl. Phys. A470, 213 (1987).
- Audi and Wapstra (1995) G. Audi and A. Wapstra, Nucl. Phys. A 595, 409 (1995).
- Ogul and Botvina (2002) R. Ogul and A. S. Botvina, Phys. Rev. C 66, 051601 (2002).
- Souza et al. (2000) S. R. Souza, W. Tan, R. Donangelo, C. K. Gelbke, W. G. Lynch, and M. B. Tsang, Phys. Rev. C 62, 064607 (2000).