Application of novel techniques for interferogram analysis to laser-plasma femtosecond probing.
Abstract
Recently, two novel techniques for the extraction of the phase-shift map (Tomassini et. al., Applied Optics 40 35 (2001)) and the electronic density map estimation (Tomassini P. and Giulietti A. , Optics Communication 199, pp 143-148 (2001) ) have been proposed. In this paper we apply both methods to a sample laser-plasma interferogram obtained with femtoseconds probe pulse, in an experimental setup devoted to laser particle acceleration studies.
1 Introduction
The phase-shift extraction from interferogram images is generally performed via a straightforward method based on Fast Fourier Transforms (FFT) (Takeda, 1982). This method is fast and generally very effective, but it can fail in producing accurate phase-shift maps in facing with low quality fringe structures. Unfortunately, the number of physical processes that can degrade the fringe visibility is very large. Even if the effects of some of these sources can be strongly reduced with refinement of the interferometry techniques (e.g. in the case of uncorrelated noise in the image, non uniform illumination…) or a reduction of the probe duration (in the case of fringe smearing due to the plasma evolution), the effect of the deviation of the probe light due to strong electronic density gradients cannot be eliminated in the interferometer acquisition step. As a result, standard FFT technique hardly work properly when applied to interferograms of very steep density gradients. Recently (Tomassini et. al., 2001) a new method to extract the phase-shift map from interferograms has been proposed. The new method IACRE (”Interferogram Analysis via Continuous wavelet transform Ridge Extraction”) takes advantage of the combined spatial and spectral resolution of the Continuous Wavelet Transforms (CWT) (Holschneider, 1995) to identify the fringe structures and results more flexible, accurate and robust than standard FFT based one.
Once the phase-shift map has been obtained, one has to face with Abel Inversion in order to retrieve the electronic density map. The Abel Inversion method is based on the strong assumption that the full electronic density is axisymmetric along an axis parallel to the interferometry plane. This assumption is often poorly verified and if we force in using Abel Inversion we can introduce large errors in the density map, especially near the best estimated symmetry axis. In a recent procedure (Tomassini and Giulietti, 2001), Abel Inversion has been generalized and can be applied to density distributions with a moderate asymmetry. As a corollary, this generalized Abel Inversion provides a first step in density map extraction.
In this paper we show the preliminary results of the analysis of interferograms obtained with femtosecond laser pulses probing plasmas produced by the exploding foils technique. The set of interferograms has been produced in order to characterize the plasma before, during and after the passage of a ultrastrong laser pulse, in an experimental setup devoted to the study of the production of multi-MeV electrons generated by laser-plasma interactions (Giulietti et. al., 2001).
2 Interferometry setup
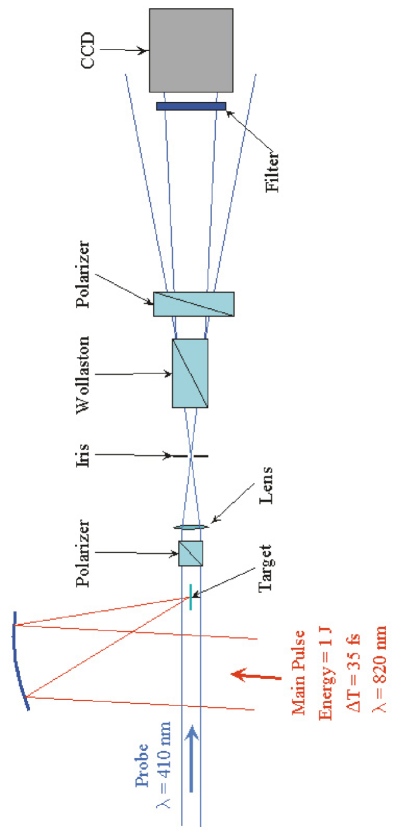
The experiment has been performed on the Salle Jaune of the Laboratoire d’Optique Appliquee with a laser pulse of wavelength delivering in . A portion of the pulse has been doubled in frequency with a KDP cristal (probe pulse) and the remaining portion (main pulse) has been focused with an off-axis parabola on the target, a thin foil of FORMVAR (see Fig. 1).
The nanosecond Amplified Spontaneous Emission (ASE) which precedes the main pulse makes the foil to explode in the focal spot. As a consequence, the main pulse interacts with a preformed plasma of peak density well below the critical density and of scalelength of few tens of ’s.
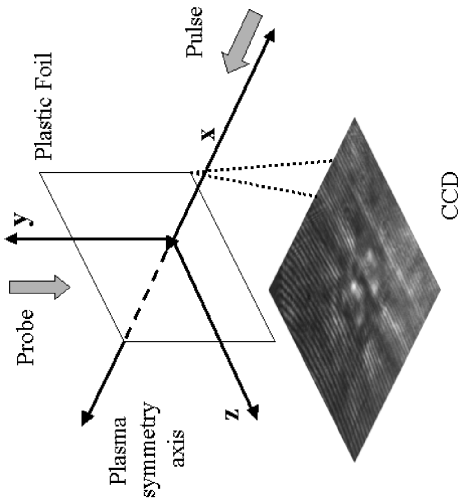
The interferometry pulse probes the plasma in a direction parallel to the plastic foil, i.e. perpendicular to the plasma expansion axis which is also roughly the plasma symmetry axis. A modified Normarski interferometrt setup (Benattar et al., 1979) is used to generate the interferometry images on a CCD camera (see Figg. 1 and 2).
3 The phase-shift extraction with the IACRE method
A detailed description of the IACRE method and an accurate comparison between IACRE and the standard FFT-based methods performances has been published elsewere (Tomassini, Giulietti and Gizzi, 2000; Tomassini et. al., 2001). In this section we will just sketch the main steps of the novel method.
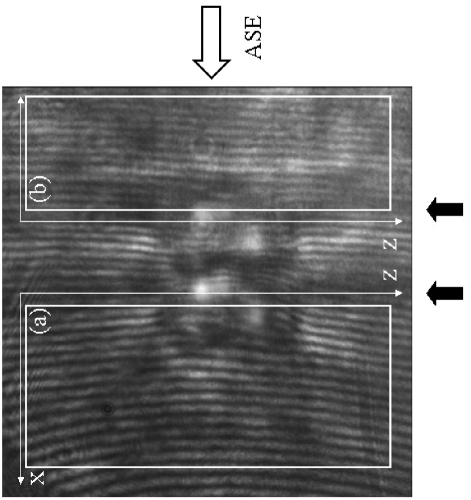
Consider the interferogram of Fig. 3. It has been produced after the interaction of a preformed plasma with a main pulse focused on it with an intensity of .
The laser radiation came from the right hand side and the plasma is approximately symmetric along the horizontal coordinate. The two black arrows refer to the positions of the two images of the target, while the boxes show the two analyzed regions, one on the side of the incoming laser radiation (the right one) and one on the rear side.
To apply the IACRE method to the each sub-image (left and right boxes), we extract the phase shift as follow. For each build a sequence by taking the line-out of the sub-image. Next:
-
•
compute the Continuous Wavelet Transform coefficients of , being and the ”voice” and ”time” parameters, respectively;
-
•
detect the ”Ridge” of the map, recording the phase of the signal rebuilted with ;
-
•
estimate the wavevector of the unperturbed fringes and, finally, compute the phase-shift as
(3.1)
The analysis of the test interferogram is complicated by the presence of fringe curvature also in absence of the plasma. This problem has been solved by acquiring a ”Mask” interferogram (without plasma) before each shot. A phase-shift of the ”Mask” is estimated and the corrected phase-shift due to the electronic plasma density is obtained simply as
| (3.2) |
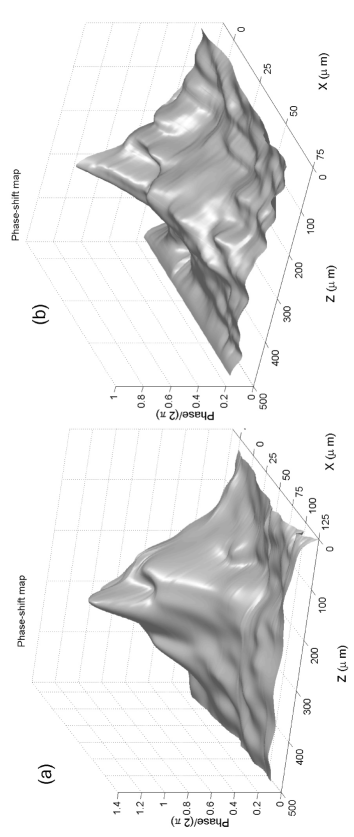
The results for the left and right boxes sub-images are reported in Fig. 4.
The two phase-shift maps of the front (right box) and rear (left box) sides of the plasma have quite similar structures, with strong evidence of a hole in the electronic density near the target, where steep density gradients occur. These gradients are responsible of the reduction of fringe visibility at the edges of the hole.
4 Non axisymmetric Abel Inversion
We now proceed in the estimation of the electronic density map . As it is clear in Fig. 4, the phase-shift maps are not really mirror symmetric so we expect that the computation of via standard Abel Inversion could introduce relevant errors. We then apply the Generalized Abel Inversion (Tomassini and Giulietti, 2001) to the corrected phase-shift maps (left and right boxes) in order to minimize inversion errors. As in the standard Abel Inversion, the position of the best symmetry axis must be determined by maximizing, for example, the cross-correlation between the two half maps
| (4.3) |
next two maps and are numerically computed with the integrals:
| (4.4) |
where is the critical density for the probe wavelength and , are the symmetrized and anti-symmetrized half maps:
The electron density map can now be built-up as follow. First, the map is mirror-symmetric along the plane. This assumption is necessary because in the process of formation of the interferogram an integration along the direction is made. Consider then one half space (let’s say the one with positive) and, for each , identity a point in the plane by using polar coordinates . Finally, the three dimensional map
| (4.5) |
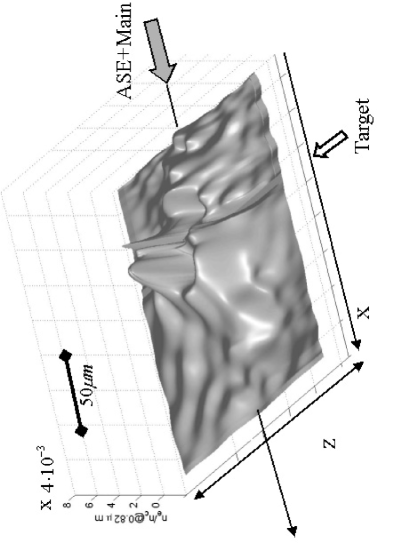
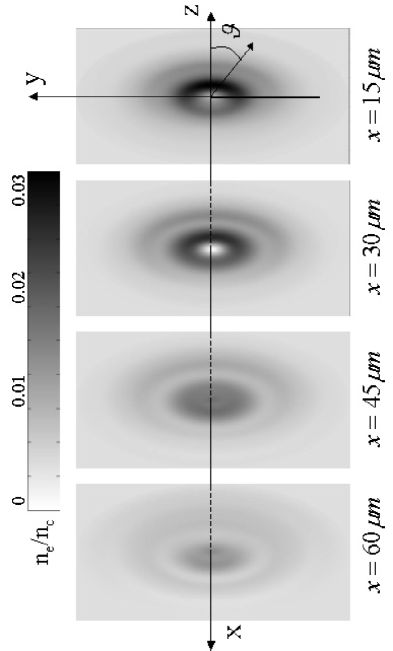
represents the best estimation of the electronic density map obtained with the Generalized Abel Inversion. In Fig. 5 the projection in the plane of the density map at both sides of the target is reproduced, while in Fig. 6 a sequence of slices of the density map in the left box at constant is shown.
5 Comments
We applied the IACRE and Generalized Abel Inversion to a sample interferogram, obtained just few after the interaction of an ultraintense femtosecond laser pulse with a preformed plasma from an exploding thin foil. The density map evidences the creation of a sharp electron density depression near the original target position.
We mention that the methods has been also applied to a series if interferograms taken before, during and after the propagation of the ultrarelativistic pulse with the plasma.
The analysis is still in progress and preliminary results confirm (Tomassini et al., 2001) that the IACRE method is much more robust and sensitive than standard FFT-based method, which frequently failed in producing reasonably accurate phase-shift maps. We then expect that IACRE and Generalized Abel Inversion methods will give a strong contribution in the comprehension of such an extreme laser-plasma interaction regime.
6 References
Benattar, R., Popovics, M., Siegel, R., Polarized light interferometer for laser fusion studies, Rev.Sci.Instrum. 50, 1583 (1979)
Holschneider, M. ; Wavelet: An analysis tool, Clarendon Press -Oxford (1995).
Takeda, M., Ina, H., Kobayashi, S. Fourier-transform method of fringe-pattern analysis for computer-based topography and interferometry, J.Opt.Soc.Am. 72, 156 (1982).
Tomassini, P., Giulietti, A., and Gizzi,L. A. Analyzing laser-plasma interferograms with the continuous Wavelet Transform, IFAM-Note 2/2000, 15-11-2000, available at http://xray.ifam.pi.cnr.it.
Tomassini, P., Borghesi, M., Galimberti, M., Giulietti,A., Giulietti, D., Willi, O., Gizzi, L.A. Analyzing laser-plasma interferograms with a Continuous Wavelet Transform Ridge Extraction technique, Applied Optics. 40 35 (2001).
Tomassini, P. and Giulietti, A. A generalization of Abel Inversion to non axisymmetric density distribution, Opt. Comm. 199, pp 143-148 (2001).
7 Figure Captions
Fig. 1 Interferometer setup: a modified Nomarski interferometer has been used to generate digital interferometry images. A probe pulse (a fraction of the second harmonic of the main pulse) probes the plasma perpendicularly to the symmetry axis.
Fig. 2 A plastic foil explodes under the intense ASE radiation coming along the axis. The plasma is approximately symmetrical along the axis. The probe beam probes the plasma along the direction and generates an interferometry image on a CCD camera.
Fig. 3 Interferometry pattern of a plasma obtained from thick foil. The probe pulse followed the main pulse by . The laser pulse came from the right. The (a) and (b) boxes refer to the two analyzed regions of the plasma (left and right sides of the foil target, respectively). The two images of the thin foil are indicated by the black arrows.
Fig. 4 Corrected phase-shift of the left (a) and right (b) boxes of Fig. 3.
Fig. 5 Projection of the density map in the left and right boxes of the interferogram of Fig. 3 onto the plane. A hole in the electronic density map is apparent.
Fig. 6 Slides of the electron density map in the left box of the interferogram of Fig. 3. A hole in the electronic density is evident at distance from the target between and .
Figures