Method for control gas diffusion and bubbles formation in liquid porosimetry
Abstract
The main problem in liquid porosimetry, which prevents to see the pore sizes smaller than microns in diameter, is direct gas diffusion flow through a micro-porous membrane. This diffusion causes bubbles formation below the membrane and that spoils extrusion (intrusion) data, as one cannot distinguish the volume of extrusion (intrusion) liquid from the volume of formatted bubbles. The suggested below method cures the problem by creating the liquid flow below the membrane. The flow washes out all of the small bubbles preventing them to grow. That allows using the membrane at higher differential pressures, even higher than minimum bubble point of the membrane, without spoiling data.
I. Description
A. Background of the invention
A1. Field of the invention
The present invention relates to the field of
porosimetry, particularly to the liquid (not mercury) extrusion or
intrusion porosimeter. In suggested method the porosity is
measured by detecting volume of liquid extruded from (or intruded
in) the sample by applying step by step increasing (decreasing)
gas pressure. The sample is placed on a porous membrane with
pore-size less than the pore-size of the sample.
A2. Description of the previous art
The liquid porosimeter, described by Bernard Miller and Ilya Tyomkin [1], is shown schematically in the Fig. 1.
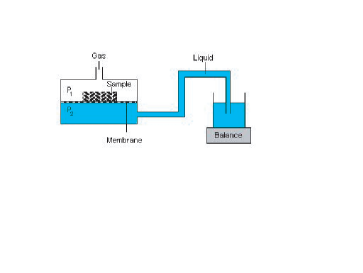
It can be used in both liquid extrusion porosimetry (LEP) and liquid intrusion porosimetry (LIP). For the LEP mode a presaturated sample is placed on a micro-porous membrane (membrane is supported by a rigid porous plate). The gas pressure is increased in steps and that causes liquid to extrude from the pores. The largest pores extrude first. The top-loading balance for each pressure step measures the liquid out-coming from the sample. The final data for analyzes could be represented as a function relation , i.e. extruded volume versus differential pressure (. Assuming that all of the through-pores are cylindrical we can apply Laplas equation to convert the final data to the form .
The same principal works for LIP mode, with the difference in starting at high pressure and decreasing it stepwise; and, of course, the sample is not initially saturated. Also LIP test can be run just after LEP test to see for example liquid extrusion-intrusion hysteresis. Different liquids can be used in LEP and LIP tests. The only requirements are the following: liquid must wet the sample and membrane; the contact angle for the system of sample-liquid-gas must be known; liquid should be stable and should have relatively low viscosity. That is the principle of a liquid porosimetry test.
One of the technical problems in LEP and LIP is the control of pressure steps during a test. B. Miller and I. Tyomkin [1] have proposed several innovations to control pressure changes more accurately. Standard scheme of liquid porosimetry allows testing pore sizes from to micron in diameter. To see smaller pores the differential pressure should be increased and as it was mentioned in [2] to see the smaller pores one need to increase the pressure hyperbolically. Also the smaller pores have smaller flow rate through and that requires a longer exposure- time for high pressure. Under these specific conditions the gas diffusion flow causes the major problem – the bubble formations below the membrane. The volume of the bubbles cannot be distinguished from the volume of the liquid extruded from (intruded in) the sample and that spoils the final data when one tries to see the smallest pores. At this point I will discuss the problem in more details.
B. Problem with standard liquid porosimetry
To see the mentioned above gas diffusion clearly, it is enough to run LEP test without a sample (just a membrane alone). If you neglect the effect of diffusion (hypothetical situation) the final data must look like data 1(ideal graph) on Fig. 2.
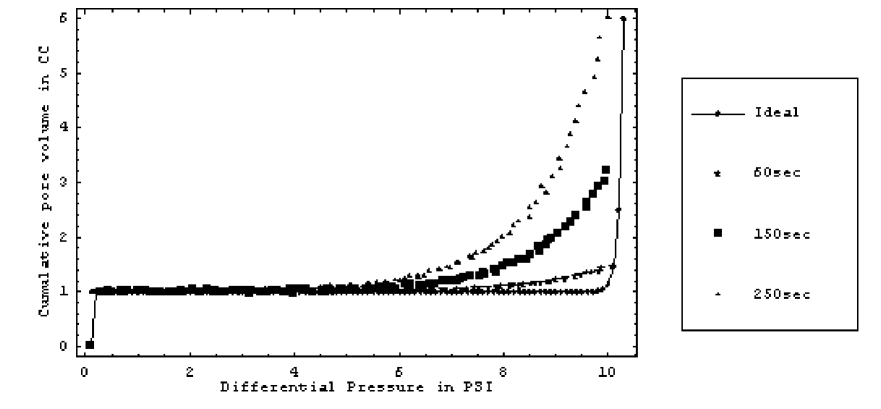
But in real test the data looks like graphs 2-4 on Fig 2. One can see that the longest in time exposure under pressure causes the largest deflection from theoretical curve (ideal graph) and that is due the bubbles formatted below the membrane. To prove the last statement it is enough to perform some changes in LEP scheme.
Let’s do the test with little modification as it shown schematically on Fig. 3.
The difference with standard liquid porosimeter is that the pump creates a flow below the membrane. That flow washes out the bubbles. And if all of the tubes are made from the transparent material one can see the bubbles coming from membrane. Since the pressure, when the bubbles start to come out, is far below from the bubble point pressure (pressure which opens the largest pores of the membrane) one concludes that bubble formation is due to the gas diffusion flow.
There are at least two possibilities to correct the effect of gas diffusion in liquid porosimetry tests. The first possibility is to run the test as fast as possible when the test-time is less then the time for significant effect of gas diffusion. But that is possible under very special condition such as high liquid flow rate through the system sample-membrane. The second possibility is to study the bubble formation effect of the given membrane and then by knowing that information try to subtract the bubble formation from the final data. Practically that means to run just the membrane as a blank test then to subtract the blank data from the final sample data. Both these possibilities are useful but they cannot solve the problem radically.
C. Description of the invention
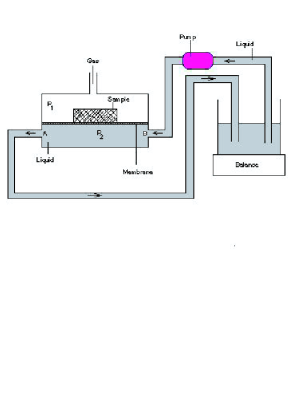
To solve the problem of the gas diffusion bubble formation I suggest a method of controlling gas diffusion and bubble formation in liquid porosimetry. The essence of the method is the creation of the liquid-flow bellow the membrane to wash out the gas bubbles during the test. On Fig. 3 the scheme of the method is shown. The differences with standard liquid porosimetry presented on Fig.1 are obvious. I used the pump with variable flow. The pump can be switch on in reverse mode. The direction of the flow is not important here. During the test the pump was on constantly. The bubbles wash out into the glass, which is placed on the top-loading balance. When pump is on it causes differential pressure between points A and B below the membrane no more than PSI depending on flow through the pump. That causes an error in real pressure reading of DP. To reduce this error I recommend switching the pump to high pressure. For example at PSI and PSI the error in pressure reading is just , at PSI and PSI the error is . At low pressure there is no need to have a liquid flow bellow membrane because the rate of bubble formation is not significant.
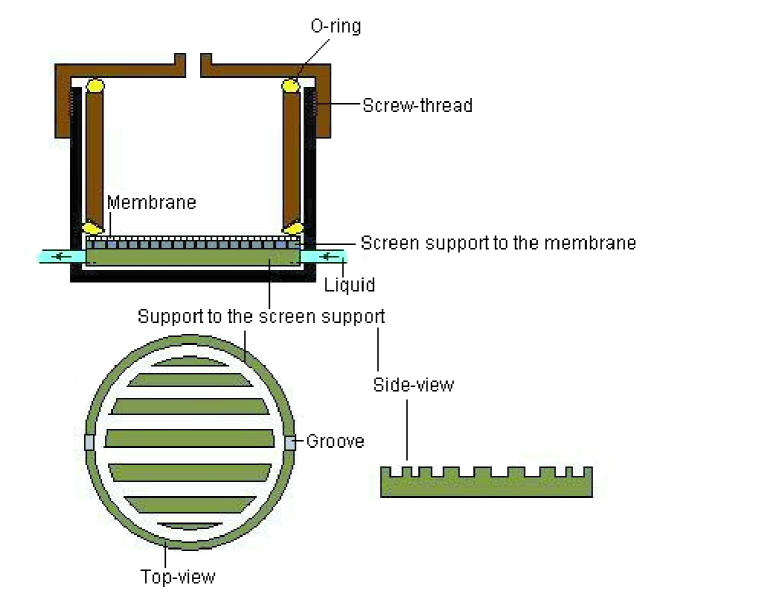
The actual realization of the method is the following: The membrane is placed on thin metal screen support (I used Millipore mm SST Support Screen). To prevent the deformation of the screen under the pressure another support is placed under the first screen-support. The last one contains parallel grooves to direct the liquid flow (see Fig. 4) and two holes for incoming and out-coming tubes. The pump used was Fisher brand Variable-Flow Peristaltic Pump with ability to regulate the liquid flow from up to mL/min. All other features are the same in principle as in standard liquid porosimetry [1, 2].
II. Conclusion
The suggested method allows controlling the diffusion through membrane. It allows the using membrane up to bubble point pressure and even more, if the gas flow through membrane just after the bubble point is very small (several cc/min.). For example, with a milli-pore micron (mm) membrane using Galwick as a liquid it is possible to see micron pore sizes in diameter, which correspond to up -PSI pressure.
Using the considered scheme and method the liquid porosimetry overcomes its current physical limits pointing to the left problem of finding better membranes.
References
- [1] B. Miller, I. Tyomkin, Journal of colloidal and interface science 162, 163-170 (1994).
- [2] L. Rebenfeld, B. Miller, J.Text.Inst., 1995, 86 No.2@Textile Institite.