Photonic mode density effects on single-molecule fluorescence blinking
Abstract
We investigated the influence of the photonic mode density (PMD) on the triplet dynamics of individual chromophores on a dielectric interface by comparing their response in the presence and absence of a nearby gold film. Lifetimes of the excited singlet state were evaluated in ordet to measure directly the PMD at the molecules position. Triplet state lifetimes were simultaneously determined by statistical analysis of the detection time of the fluorescence photons. The observed singlet decay rates are in agreement with the predicted PMD for molecules with different orientations. The triplet decay rate is modified in a fashion correlated to the singlet decay rate. These results show that PMD engineering can lead to an important suppression of the fluorescence, introducing a novel aspect of the physical mechanism to enhance fluorescence intensity in PMD-enhancing systems such as plasmonic devices.
pacs:
32.50.+d, 73.20.Mf, 78.67.-nThe rate of spontaneous photon emission by an excited molecule can be modified by changing the density of possible electromagnetic decay channels, i.e. the photonic mode density (PMD) Purcell1946 ; Barnes1998 ; Lakowicz2003 at the emitter position. In particular, a nearby metallic object supporting plasmonic excitations can produce noticeable changes in the PMD. Together with the increased optical excitation in a locally enhanced electric field, modifications of the PMD leading to a faster de-excitation have been identified as responsible for the enhanced fluorescence signal close to metal structures. This approach to obtain stronger fluorescence signals promises significant progress for experimental schemes whrere weak fluorescence signals need to be retrieved with high signal-to-noise ratios such as single molecule methods, fluorescence correlation spectroscopy and biosensors Dulkeith2005 ; Levene2003 . Following first experiments in front of a metallic mirror Drexhage1968 ; Kuhn1970 ; Chance1978 , recent progress in nanofabrication technologies allowed to investigate more sophisticated geometries showing more drastic modifications of the PMD Ditlbacher2001 ; Rigneault2005 ; Farahani2005 .Recently, a number of investigations addressed the quantitative analysis of fluorescence in PMD modifying environments Anger2006 ; Buchler2005 ; Enderlein2005 . In all these investigations, the PMD effects were analyzed in the framework of an enhanced singlet decay. In this paper, we show that the PMD can also influence the triplet state dynamics (fluorescence blinking) of chromophores, leading to a significant additional fluorescence enhancement mechanism.
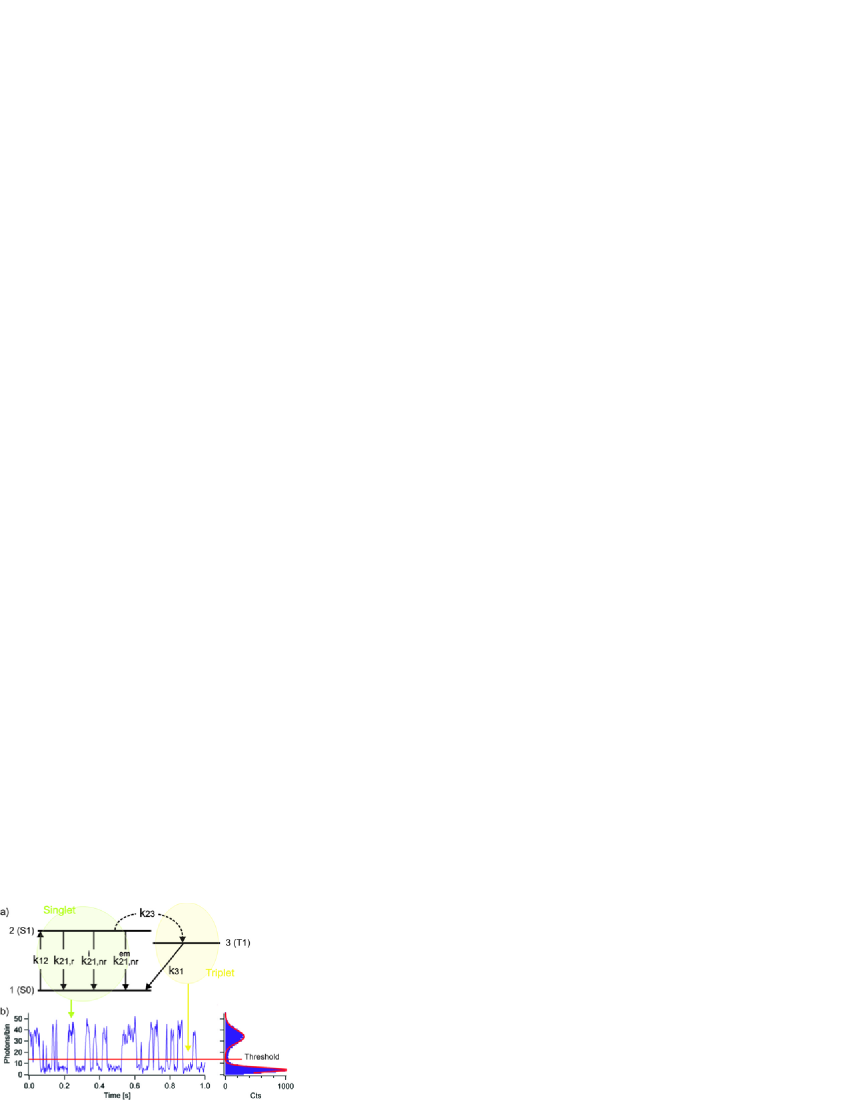
FIG. 1 depicts a simplified picture of the molecular fluorescence process in terms of a three-state model Moerner1997 . A molecule initially in the ground singlet state S0 is excited upon photon absorption to the singlet excited state S1 with a rate . From S1, the molecule returns to S0 with a total rate composed of a radiative decay and an intramolecular non-radiative relaxation ; based on previous studies Vasilev2004 ; Stefani2005 , we will consider as negligible. A nearby metallic object can modify and introduces additional electromagnetic non-radiative channels . Efficient fluorophores perform many cycles like this in the singlet subspace while fluorescence photons are emitted. Although suppressed by spin selection rules, singlettriplet and tripletsinglet transitions (inter-system crossing ISC) still occur. An excited molecule has a finite probability () of undergoing ISC to a lower energy, long-lived triplet state (T1) from which the molecule decays back to S0 with a rate ; this latter step may involve photon emission (phosphorescence). As a result, the fluorescence emission of single molecules is intermittent Basche1995 . If the triplet lifetime is long enough (small ) this triplet blinking can be clearly observed in the fluorescence emission of single molecules as successive bright (on) and dark (off) periods (FIG. 1b), each characterized by its fluorescence and background intensity, respectively. Although ISC does not usually affect the overall fluorescence quantum yield due to the low absorption of T1 at the frequency of the excitation, it limits the maximum achievable fluorescence intensity Basche1995 . A reduction of the triplet lifetime of organic fluorophores, with a corresponding increase in brightness, was demonstrated by the presence of molecular oxygen which quenches T1 and returns the molecules to S0 up to 100 times fasterEnglish2000 ; Huebner2001 . However, oxygen is undesired as it is also responsible for most photodegradation processes.
Although most pronounced PMD enhancements are observed on irregular metal structures such as silver island films or sharp metallic tips or junctions, we used planar systems which are better suited for a quantitative study of the underlying physical effects because they can be prepared with high accuracy and can be fully modeled.
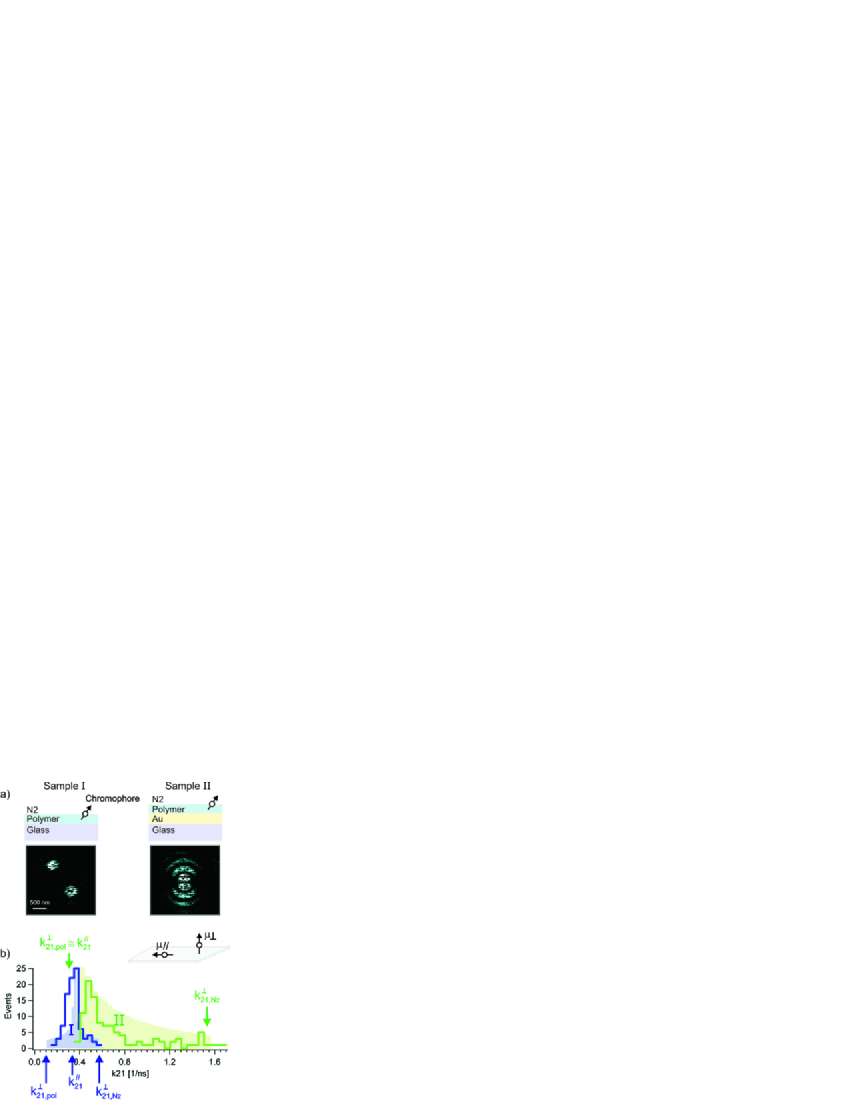
Two sample architectures were employed. Firstly, chromophores were placed on top of a dielectric layer (Samples I). Secondly, the same dielectric layer was used as a spacer to place the chromophores at a controlled distance from a thin gold film (Samples II). FIG. 2a shows a schematic of the two sample architectures and corresponding single molecule fluorescence confocal micrographs (epi-illumination through the glass slides) Stefani2005 ; the fluorescence blinking can be directly observed. The thicknesses of the gold film and the dielectric spacer layer were 44 nm and 30 nm, respectively in order to achieve optimum single molecule detection Stefani2005 ; Vasilev2004 . The dielectric spacer was composed of alternating layers of poly(allylamine) (PAH) and poly(styrenesulfonate) (PSS). On the samples with the gold film, the polyelectrolyte layers were prepared following a published method Stefani2005 . The samples without the gold film were prepared using the same procedure to deposit 2.5 PSS/PAH bilayers on optically transparent glass substrates, which were previously functionalized with 3-aminopropyltriethoxy-silane (3-APTES) SI . On both types of samples, fluorescent 1,1′,3,3,3′,3′-hexamethylindicarbocyanine iodide (DiIC1(5), Molecular Probes) molecules were deposited electrostatically on the negatively charged surface of the multilayer terminated with PSS by immersing the samples in a M, Milli-Q water solution. The immersion time (10-30 seconds) was adjusted such as to obtain well separated chromophores. The polyelectrolytes were chosen as dielectric spacer because they can be prepared with controlled thickness and allow for the chromophores at their interface to adopt all possible orientations Stefani2005 . Chromophores of the DiI family are a well investigated model system for ISC effects English2000 ; Huebner2001 mainly due to their relatively long triplet lifetime of 10-50 ms (in the dry state and absence of O2). All measurements were conducted under continuous flow of dry nitrogen in order to exclude triplet quenching by oxygen.
A region of the samples was imaged on a home-built confocal microscope, in an epi-illumination scheme from the glass side, a single molecule moved into the focus, and its fluorescence emission recorded as a function of time. Light from a laser-diode (Hamamatsu PLP10-063/C) was used for pulsed excitation (100 ps FWHM, 100 MHz repetition rate) at nm through a 1.4 NA oil-immersion objective. In order to optimize the signal to background ratio, annular illumination was used for samples II Stefani2005 . Fluorescence photons were collected by the same objective, separated from the excitation light by suitable dichroic and notch filters and their arrival times were recorded by means of an avalanche photo-diode (Perkin-Elmer SPCM-AQR-13) and a time correlated single photon counting module (Becker & Hickl SPC-630). For each detected photon two times were recorded independently: the time elapsed since the last excitation pulse (micro-time) and the time elapsed since the beginning of the measurement (macro-time), with a resolution of 7 ps and 50 ns, respectively. The excited singlet state decay was obtained by a single-exponential fit to a histogram of the micro-times SI . The system response was limited to approx. 0.6 ns by the response of the photodetectors SI . Information about the fluorescence blinking is provided by the macro-times, which permit to obtain the fluorescence intensity vs.time trace as shown in FIG. 1 and in turn the length of the on- and off-times. The probabilities of a certain on- or off-time length are exponentially distributed Basche1995 ; Huebner2001 ; SI and therefore, average times and can be extracted which are connected to the transition rates in the 3-level system (FIG. 1) by and . Alternatively, and can also be obtained from an exponential fit to the fluorescence intensity autocorrelation Bernard1993 . The latter method turns out to be more reliable, especially at low signal to background conditions SI .
Changes in the PMD affect all transitions coupled to the electromagnetic field. This effect is well understood for and can be fully modeled by considering point oscillating electric dipoles interacting classically with the electromagnetic field Anger2006 ; Buchler2005 ; Barnes1998 . In the following, an analysis of the variations of is presented which gives direct access to the PMD experienced by the individual molecules. This information is a prerequisite for the analysis of the PMD-induced variations of the triplet dynamics that is shown later.
For chromophores near a plane interface, depends on the polar angle between the dipole moment of the molecule and the surface normal and can be calculated from the limiting cases of molecules parallel () and perpendicular () to the interfaces:
| (1) |
and are determined by the dielectric properties of the layered system Vasilev2004 .
Due to the very short immersion times used in the sample preparation, the chromophores cannot diffuse inside the polymer vonKlitzing1996 and are placed at the interface. In point-dipole theory, varies continuously across the interface whereas takes two different values at each side of the interface according to the dielectric contrast:
| (2) |
with the subscripts and referring to an infinitely small displacement to the nitrogen and polymer side, respectively. On a molecular level, the chromophores have a finite size and the polymer surface has a certain structure leading to different radiative decay rates for molecules that probe more one or the other side of the interface. Thus, a distribution of due to molecular orientation and local environment may be anticipated.
In FIG.2b, the experimental distributions of obtained from approximately 100 molecules in each type of samples are displayed, together with calculated distributions. Arrows indicate the theoretical decay rates for parallel and perpendicular dipoles at each side of the interface Vasilev2004 . These calculated rates need to be adjusted to the experimental ones by one commom scaling factor for all calculated rates Stefani2005 ; i.e. a reference is needed. We assign the most frequent value of in samples I to parallel molecules because those are the statistically most probable and most effectively detected molecules. The adequacy of this choice is supported by the very good agreement between the calculated and experimentally detected extreme values of for molecules in samples I and the maximum detected for molecules in samples II. We know from previous studies that in samples II, parallel molecules and molecules probing more the polymer side of the interface are not detectable in this scheme Stefani2005 . Then, the minimum observed is expected to be larger than the minimum calculated (). The calculated distributions of shown in FIG. 2b correspond to randomly oriented molecules, half of them placed in N2 and half in the polymer. Comparing the calculated and experimental distributions of , it is possible to conclude that the sample preparation yields a smaller fraction of molecules with extreme lifetimes than expected from random orientations and location; i.e. more molecules lie parallel to the surface and/or probe the polymer side of the interface. In summary, the variations of the PMD has been quantified by means of for both samples and its distribution can be fully explained by the different location and orientation of the molecules with respect to the interface and, in samples II, to the nearby gold film.
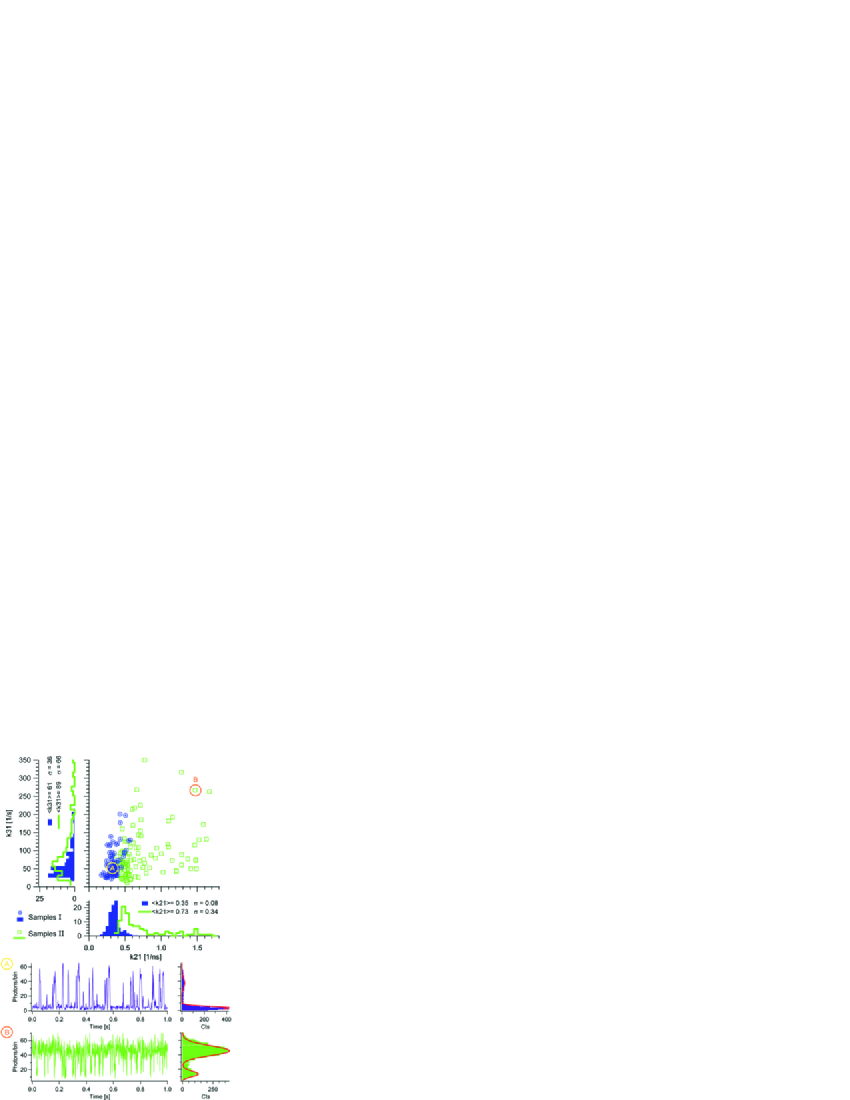
With this information in hand, we proceed to investigate the effect of the PMD on . In FIG. 3, the distributions of and obtained from molecules in samples I and II are shown together with a scatter plot of vs . The distributions of in samples I and II differ significantly (Student-t test: t=3.25, P=0.14%): Molecules in samples II have both an increased average and large values exceeding that are not observed in the absence of the gold film. In spite of some statistical scatter, a positive correlation between and can be observed in both data sets. Pearson linear correlation coefficients of and are obtained for the molecules in samples I and II, respectively. The significance of these correlations was tested by computing the probability of obtaining by chance such values or higher from non-correlated and data. Probabilities of and for samples I and II, respectively were obtained SI . The correlation between and can be explained by PMD variations for the individual molecules due to their local environment and orientation if depends in a similar fashion on the PMD as does . While some interaction with the surroundings on a molecular scale affecting both transitions could also produce such a positive correlation, this can be excluded as the reason for any difference between the molecules in samples I and II because they experience the same chemical environment in both samples. Therefore, the significant difference between the distributions of in samples I and II must be assigned to a PMD-mediated enhancement due to the nearby gold film. This in turn supports the interpretation of the positive correlation between and in terms of similar PMD effects on the singlet and triplet de-excitations.
The noticeable effect of the PMD on indicates that the transition T1S0 occurs mainly radiatively and that the transition dipoles associated with the T1S0 and S1S0 transitions have similar orientations. The latter is reasonable because for ISC to occur S1 and T1 should share the same molecular geometry. It is important to note that the PMD enhancements achieved in this planar geometry are quite modest in comparison to what can be achieved in more complex structures. The enhanced can lead to noticeable stronger fluorescence signals, due to the faster return to the singlet manifold which allows to obtain more fluorescence photons per time unit. As illustrative examples, two 1-second traces of an average (A) and a strongly enhanced (B) molecule are shown also in FIG. 3 (An intermediate case is shown in FIG. 1). Clearly, molecule B is a much brighter emitter than A because it spends much more time in the singlet subspace emitting fluorescence photons.
In conclusion, the influence of the PMD on the electronic transition rates involved in molecular fluorescence was investigated by studying the emission blinking and excited state lifetime of individual molecules. The singlet de-excitation rate is affected in good agreement with theory. It was demonstrated that the triplet de-excitation is affected in a similar way by the PMD indicating that for the investigated system the T1S0 transition has a strong radiative component with a transition dipole moment of similar orientation to the S1S0. These findings complete the picture of the PMD-mediated fluorescence enhancement which was so far only discussed for the singlet manifold. Firstly, an enhanced excitation () and singlet decay () at constant branching rate to the triplet () allows the dye to emit more photons before entering the triplet and secondly, the residence time in the triplet is reduced due to its enhanced decay (). This new finding on the improvement of chromophore performance should encourage further the investigation of PMD enhancing structures such as plasmonic nano-objects to obtain single super emitters.
Acknowledgements.
This work was supported by the Bundesministerium für Bildung und Forschung (grant No. 03N8702).References
- (1) E. M. Purcell, Phys. Rev. 69, 681 (1946).
- (2) W. L. Barnes, J. Mod. Opt. 45, 661 (1998).
- (3) J. R. Lakowicz et al., J. Phys. D. 36, R240 (2003).
- (4) K. Drexhage, H. Kuhn, F. Schäfer, Ber. Bunsenges. Phys. Chem. 72, 329 (1968).
- (5) H. Kuhn, J. Chem. Phys. 53, 101 (1970).
- (6) R. R. Chance, A. Prock, R. Silbey, Adv. Chem. Phys. 37, 1 (1978).
- (7) H. Ditlbacher et al., Appl. Phys. B. 73, 373 (2001).
- (8) J. N. Farahani et al. Phys. Rev. Lett., 95, 017402 (2005).
- (9) H. Rigneault et al., Phys. Rev. Lett. 95, 117401 (2005).
- (10) K. Kneipp et al. Phys. Rev. Lett. 78, 1667 (1997).
- (11) J. B. Jackson et al. Appl. Phys. Lett. 82, 257 (2003).
- (12) P. Anger, P. Bharadwaj, L. Novotny, Phys. Rev. Lett. 96, 113002 (2006).
- (13) B. C. Buchler et al. Phys. Rev. Lett. 95, 063003 (2005).
- (14) J. Enderlein, T. Ruckstuhl, Optics Express 13, 8855 (2005).
- (15) M. J. Levene et al. Science 299, 682 (2003).
- (16) E. Dulkeith et al. Nano Lett. 5, 585 (2005).
- (17) Synthesis and Plasmonic Properties of Nanostructures ed. by Y. Xia and N. J. Halas MRS Bull. 30, 338 (2005).
- (18) R. Grober, R. Schoellkopf, D. Prober, Appl. Phys. Lett. 70, 1354 (1997).
- (19) H. G. Frey et al. Phys. Rev. Lett. 93, 200801 (2004).
- (20) P. Mühlschlegel et al. Science 308, 1607 (2005).
- (21) P. J. Schuck et al. Phys. Rev. Lett. 94, 017402 (2005).
- (22) T. Kalkbrenner et al. Phys. Rev. Lett. 95, 200801 (2005).
- (23) W. E. Moerner, M. Orrit, U. P. Wild, Single Molecule Optical Detection, Imaging, and Spectroscopy. Wiley-VCH, Munich. (1997)
- (24) F. D. Stefani et al. Phys. Rev. Lett. 94, 023005 (2005)
- (25) K. Vasilev, W. Knoll, M. Kreiter, J. Chem. Phys., 120, 3439 (2004).
- (26) T. Basché, S. Kummer, C. Bräuchle, Nature, 373, 132 (1995).
- (27) C. G. Hübner et al. J. Chem. Phys., 115, 9619 (2001).
- (28) D.S. English, A. Furube, P. F. Barbara, Chem. Phys. Lett., 324, 15 (2000).
- (29) See EPAPS Document No. [xxx] for additional information. For more information on EPAPS, see http://www.aip.org/pubservs/epaps.html.
- (30) J. Bernard, H. Talon, M. Orrit, J. Chem. Phys. 98, 850 (1993).
- (31) R. von Klitzing, et al., Macromolecules. 29, 6901 (1997)