Exploitation dynamics of fish stocks
Abstract
I address the question of the fluctuations in fishery landings. Using the fishery statistics time-series collected by the Food and Agriculture Organization of the United Nations since the early 1950s, I here analyze fishing activities and find two scaling features of capture fisheries production: (i) the standard deviation of growth rate of the domestically landed catches decays as a power-law function of country landings with an exponent of value ; (ii) the average number of fishers in a country scales to the power of country landings. I show how these socio-ecological patterns may be related, yielding a scaling relation between these exponents. The predicted scaling relation implies that the width of the annual per capita growth-rate distribution scales to the power of country landings, i.e. annual fluctuations in per capita landed catches increase with increased per capita catches in highly producing countries. Beside the scaling behavior, I report that fluctuations in the annual domestic landings have increased in the last 30 years, while the mean of the annual growth rate declined significantly after 1972.
keywords:
scaling law , growth dynamics , capture fisheries , stock exploitation , Fishstat Plus , FAOE-mail address: Hiro.S.Niwa@fra.affrc.go.jp (H.-S. Niwa).
1 Introduction
Fluctuations in fishery landings have been a collective human concern (Botsford et al., 1997; Pauly et al., 2002). Variation in supply (stock size) is a central problem in determining the optimal organization of the fishing industry and in how governments can best regulate fishing effort. Since the industrialization of fishing, fisheries scientists have been subject to intense political pressures: “Determine the causes of fluctuations in fish catches.” For example, in the mid-1800s the Norwegian parliament asked zoologists Michael Sars and George Ossian Sars to investigate the biology of Norwegian fisheries and to answer why the cod catches from the Lofoten Islands in Northern Norway fluctuated so greatly (Smith, 1994).
Nonlinear dynamics have been applied to understanding the ups and downs of populations. In the mid-1920s, an Italian biologist Umberto D’Ancona found the increase in predator fish and decrease in prey fish of various species in the Adriatic Sea during the World War I period from a statistical study of the numbers of each species sold on the fish markets of three ports, Fiume, Trieste, and Venice (D’Ancona, 1926, 1954). A famous Italian mathematician Vito Volterra, asked by D’Ancona whether he could come up with a mathematical model of predator-prey population dynamics, developed the first and simplest model of predator-prey interactions (Volterra, 1926). Because an American mathematical biologist Alfred J. Lotka produced the two-species interaction model independently and at about the same time (Lotka, 1925), it is called Lotka-Volterra model. The nonlinear model predicts a cyclical relationship between predator and prey numbers.
Thus, the jagged oscillation in populations was nothing new to ecologist, but before the 1970s, they put most of the patterns down to the stochastic, unaccountable effects: year-to year fluctuations in fish stocks are usually attributed to variability in recruitment, competition, predation, changes in fishing effort, and other sources of so-called environmental noise. May (1974, 1976) discovered that a density-dependent (i.e. nonlinear), deterministic model of ecology could produce complex, random-looking patterns “chaos”. Conklin and Kolberg (1994) researched the effects of market demand on halibut populations of Pacific Ocean fisheries, and provided a model of chaotic dynamics for the Pacific halibut fishery. Weisbuch et al. (1997) studied the influence of biological and socio-economic mechanisms on the amplitude of resource depletion, and showed not only that the depletion is most often due to inertial factors in the dynamics of exploitation, i.e. capital and labor overshoot, but also that capital and labor inertia results into dangerous oscillations of the resource level, eventually finishing with a fishery crash.
A central question in ecology for last decades has been how to quantify the relative importance of stochastic and nonlinear factors for fluctuations in population size (Sæther et al., 2000; Turchin, 2003; Hsieh et al., 2005). Characterizing the fluctuation patterns is the major challenge for time series analysis in fisheries and for modeling the process of fish production. One major approach to dealing with ecological complexity is to reduce the system to one or a few species: a number of detailed analysis of specific systems have captured the patterns of fluctuations in fish stocks and catches, including noise-driven fluctuations and chaos (Wilson et al., 1991; Matsuda et al., 1991, 1992; Takeuchi et al., 1992; Higgins et al., 1997; Bjørnstad et al., 1999; Dixon et al., 1999; Bjørnstad and Grenfell, 2001).
Inspired by work of Keitt and Stanley (1998) and Keitt et al. (2002), I here explore an alternative approach to socio-ecological system dynamics, i.e. population dynamics within which fisheries are embedded. From the macro-ecological viewpoint, I analyze the time-series of annual fishery landings (all commercial species items fished inclusive) of 244 countries in total during the period 1950–2002, after excluding non-fish vertebrates such as whales. The data on annual domestically-landed catch are taken from Fishstat Plus (FAO, 2004a), a set of statistical database compiled by the Food and Agriculture Organization (FAO) of the United Nations. FAO is the only one institution that maintains global fisheries statistics. The country-structured time-series of landed catch is a complex source of information. Annual landed catch is the aggregate of a large number of complex interactions between fishers and the stock. Some aspects of landed catch are biological phenomena (biomass of fish vulnerable to the gear) and technical efficiencies (use of machinery power and modern equipments such as echo sounders and fish detection devices); others are economic (market price of fish and the cost of applying effort), legal (regulations applied to fishing effort) and some are behavioral (skill of the fisher targeting the stock and accurate completion of catch records). Besides the fluctuations in fishery landings, I investigate the employment statistics based on the FAO data on the number of commercial and subsistence fishers (FAO, 1999, 2004b). I report two power-law relationships between the following quantities for the capture fisheries sector:
-
(i)
the variability of landings time-series and the country landings
-
(ii)
the number of fishers in a country and the country landings
In order to understand the scaling structure for the stock exploitation, a relation between these power-law exponents is hypothesized, such as the Widom scaling relation (Widom, 1965a, b).
In the paper, symbols and are used for the annual domestically-landed catch and the number of fishers in countries, respectively.
2 World fisheries trend
Fisheries have recently become a topic for the media with global audiences, as well as for the scientific community [e.g. Beddington and Kirkwood (2005); Ehrhardt (2005); Symes (2005)], with a focus on the wretched history, the poor current practice, and the future scenarios. For instance, the New Orleans Times-Picayune’s eight-part 1996 series by McQuaid et al. (1996) on “Oceans of Trouble” won the Pulitzer Prize for public service in 1997, in reporting on threats to the world’s fisheries.
In 1950, the newly founded Food and Agriculture Organization of the United Nations began collection of global statistics. Fisheries in the early 1950s were at the onset of a period of extremely rapid growth. Everywhere that industrial-scale fishing (mainly trawling, but also purse seining and long-lining) was introduced, it competed with small-scale, or artisanal fisheries. Throughout the 1950s and 1960s, this huge increase of global fishing effort led to an increase in catches so rapid that their trend exceeded human population growth, encouraging an entire generation of fisheries managers and politicians to believe that launching more boats would automatically lead to higher catches (Pauly et al., 2002).
In 2002, fisheries provided direct employment to about 38 million people and accounted for more than 15 percent of the total human consumption of animal protein (FAO, 2004b). Globally, first-sale capture-fishery revenues produced about 78 billion US dollars. Total world trade of fish products increased to an export value of 58.2 billion US dollars, continuing the last decade’s underlying 4.5 percent annual growth. The world’s population has been increasing more quickly than the total food fish supply; as a result the average per capita fish supply has declined. Total production from marine and inland capture fisheries for the world reached 93.2 million tonnes (84.5 million tonnes marine and 8.7 million tonnes inland) [excluding China, 76.6 million tonnes from capture fisheries (70.1 million tonnes marine and 6.5 million tonnes inland)].
Figure 1A shows the trend of the global harvests with capture fisheries, demonstrating that the global capture production has been exponentially growing. The annual growth rate of global catches (defined as , where and are the total capture production in the years and ) changed discontinuously at the critical time 1972, correspondent to the collapse of the Peruvian anchoveta fishery, signaling an abrupt transition of bio-economic regime. The fisheries exploitation has expanded in two-exponential mode, and possibly reached a plateau with no transient period contrary to a logistic growth.
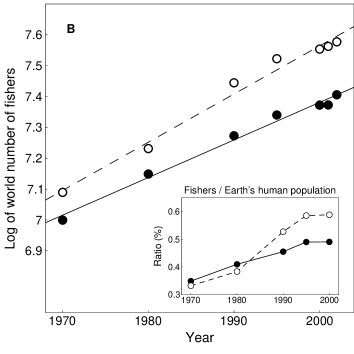
In line with the increase in fisheries production, over the last three decades employment in fisheries and aquaculture has continued to increase in many countries. The world number of fishers and fish farmers has been exponentially (i.e. in a Malthusian mode) growing at annual rate of 3.6 percent (excluding China, 2.8 percent) for the period 1970–2002, depicted in Fig.1B. The world fishers population has been growing at a faster rate than the earth’s human population (see inserted figure of Fig.1B). Since 1970 to 2000, the ratio of fishers and fish farmers to the whole population has increased from 0.332 to 0.588 percent (excluding China, 0.349 to 0.490 percent).
Since there is the possibility of China’s misreporting (Watson and Pauly, 2001), for further analysis, I use the data with the exclusion of China’s reported catches (including China does not change the results).
3 Scaling of country growth rate
In Fig.2, shown are the probability distributions of the annual domestic landings (A) and the number of people actively fishing and fish farming in countries (B), both which are consistent with a log-normal distribution
| (1) |
where and denote a geometric mean and a geometric standard deviation of the distribution, respectively. The log-normal relationship remained unchanged for the time period studied. This log-normal distribution of the country landings is suggestive of Gibrat’s law on market structure (Gibrat, 1931). It is interesting to note that, contrary to city sizes (resident population) or US firm sizes (employees and revenue), the country population engaged in fishing and fish farming does not reduce to the Zipf’s power-law distribution characterized by the absence of a characteristic size (Zipf, 1949; Axtell, 2001). However, the conditional probability distributions of fishers population for countries with the same landings show “fat tails” with characteristic scales (for details, consult §4).
In the limit of small annual changes in , we can define the relative growth rate as
| (2) |
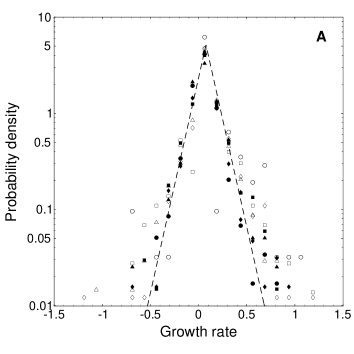
where and are the annual landings of a country in two consecutive years. I calculate the conditional distribution of annual growth rate for countries with landings . The distribution of the growth rate from 1950 to 1971 is shown in Fig.3A, depicting a simple tent-shaped form on a semi-logarithmic scale. The distribution is not Gaussian, as expected from the Gibrat model, but rather is exponential:
| (3) |
where and are the average growth rate and the standard deviation of for countries with landings equal to , respectively. An implication of this result is that the distribution of the growth rate has much broader tails than would be expected for a Gaussian distribution. Notice that the fluctuation in growth rate is independent of .
In Fig.3B, shown is the empirical conditional probability density of for countries from 1972 to 2002 with approximately the same landings, suggesting that has the same functional form, consistent with the Laplace distribution [Eq.(3)], with different widths , for all . In these years, contrary to the period of 1950–1971, we expect that the statistical properties of the growth rate depend on landed catch : the growth-rate distribution depends on the initial value of .
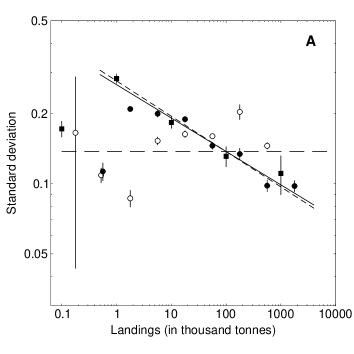
The study of the fluctuations has been shown to give important information regarding the underlying processes responsible for the observed macroscopic behavior. I therefore analyze the fluctuations in the growth rate of the country landings. While different plots for the values of landings fall onto one another for the 1950–1971 period, there is clear dependence of on the value of landed catch for both the periods of 1972–1989 and 1990–2002. Figure 4A shows that for the periods 1972–2002, statistically decreases with increasing . The width of the growth-rate distribution, , scales over three order of magnitude, from landings about tonnes up to landings about tonnes, as a power law:
| (4) |
where and for the both investigated periods (landed value of catch unit in thousand tonnes).
What is remarkable about Eqs.(3) and (4) is that they govern the growth rates of a diverse set of countries. Fishery labor productivity and capital intensity vary widely among countries. They range not only in their amount of landings but also in what and where they catch: the harvest included in the database is classified according to more than 1000 commercial species items, and according to the inland or marine area. Indeed, the data of growth rate for a wide range of production values plotted in terms of scaled coordinates collapse onto a single curve (Fig.4B), if the ordinate and the abscissa are chosen as
| (5) |
respectively. Accordingly, the probability density function of growth rate for a country with tonnes landings, detrended by the average growth rate , should scale as
| (6) |
where the scaling function is exponential, and the detrended growth rate is denoted by .
3.1 -year growth rate
We now question whether Eq.(3) of landed catches in countries is still valid for the growth rates for longer time scales. Consider the -year growth rate
Is then for large Gaussian? Figure 5A shows the distributions of growth rates for time scales from 1 year up to 30 years over the entire period (1950–2002) for all countries (excluding China). In Fig.5B shown are the probability distributions of the normalized growth rate defined as
| (8) |
where and are the average and the standard deviation of the -year growth rate. We see that the distributions of are, to a good approximation, symmetric with respect to zero. Figure 5C shows the positive tails of the complementary cumulative distributions of the normalized growth rates for the same time scales, compared to the standardized Gaussian distribution with a mean of 0 and a standard deviation of 1. Because of the central limit theorem, the convergence to a Gaussian distribution on longer time scales is observed, as the Gibrat model predicts.
We can further test the convergence to Gaussian behavior by analyzing the moments of the distribution of normalized growth rates. A more global quantitative measure of distributions is in terms of the moments:
| (9) |
where denotes the average. The fractional moments of the normalized growth rates for , 10, 20 and 30 years (Fig.5D) show clear indication of convergence to Gaussian behavior with increasing . However, it is remarkable that they do not satisfyingly approach the Gaussian moments even for large years.
Moreover, notice that the distribution of annual () growth rates for all countries and all years can be well-described by an exponential (Fig.5A),
| (10) |
with and , while the conditional probability density of the yearly growth rates for countries with approximately the same landings depends on [Eqs.(3) and (4), Figs.3 and 4]. Using a saddle point approximation (Lee et al., 1998), we may integrate the conditional Laplace distribution, Eq.(3), over a log-normal distribution of the country landings, Eq.(1), and obtain Eq.(10).
4 Scaling structure of the fisheries sector
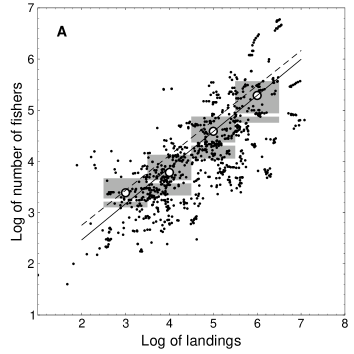
Let us analyze employment data in the fisheries sector in order to gain further insight into the organization of fisheries structure of countries. Figure 6A, showing a scatter plot of the number of fishers versus country landings, suggests that the conditional probability density to find a country with total catch landed by fishers has a long right tail. I here propose a model for the conditional distributions of fishers population in terms of “stretched exponentials” (Laherrère and Sornette, 1998):
| (11) |
such shat the complementary cumulative distribution is
| (12) |
where denotes a reference scale of the distribution, expected to depend on the landings, . Stretched exponentials are characterized by an exponent smaller than one. The meaning “reference” is that from all moments can be determined, e.g. the means of and are given by
| (13) |
and
| (14) |
respectively, where is the gamma function [equal to for integer]. When is small, will be much larger than . The expression (12) of the stretched exponential complementary CDF means that the stretched exponential distribution is qualified by a straight line when plotting the negative log of complementary CDF, , as a function of on a double-logarithmic scale. As shown in Fig.6B, lines appear: the values of the exponent range from 0.60 to 0.86, numerically evaluated from Eqs.(13) and (14). Accordingly, the fishers population for countries with the same landings follows a stretched exponential distribution [aka Weibull (1951) distribution with exponent lass than one].
Moreover Fig.6A suggests that the typical (i.e. average) number of fishers increases as a power law with the country landings . We make the hypothesis that the conditional probability density obey the scaling relation
| (15) |
where denotes a scaling function. To test the scaling hypothesis in Eq.(15), we plot the scaled quantities
| (16) |
and observe the data collapse with a exponent (Fig.7). Since the data exhibit scaling, we identify a universal scaling function fitted with a stretched exponential distribution
| (17) |
Notice that the average number of fishers scales with country landings as
| (18) |
As shown in Fig.6A this is indeed the case.
The multiplicative cascade model (Frisch and Sornette, 1997) may explain the stretched exponential distribution of fishers: the probability distribution function of the product of independent identically distributed positive random variables with an exponential-like distribution leads to stretched exponentials [see also Laherrère and Sornette (1998)]. The reciprocal number of levels in the multiplicative cascade reads the index . Interpreted within the multiplicative cascade model, the value of the exponent corresponds to about one to three generation levels in the generation of a typical fisher.
Notice that the conditional distribution reduces to a stretched exponential distribution, while the distribution of the country population engaged in fishing and fish farming is log-normal (Fig.2B). It is numerically demonstrated (Fig.8) that a log-normal distribution of the number of fishers approximately results from a convolution of a stretched exponential distribution and a log-normal distribution of the country landings, Eq.(1):
| (19) | |||||
with .
5 Modeling scaling behavior in the exploitation dynamics
Total catch of a country is made up of individual fisher activity in the country. Fisheries management ranges along a continuum from community to government as sole managers of the resource, and the field of impact of their decisions can be local, regional, provincial, or national. Fishers get involved in their respective management arrangements in a country.
We now consider the following two limiting cases.
-
(i)
There are strong correlations between the fishers in a country, following that the growth dynamics are indistinguishable from the dynamics of structureless organizations. As a result, there is no country-size dependence of the growth fluctuation , following .
-
(ii)
The annual landed catches by individual fishers change independently of one another. Then, if the number of fishers in a country were proportional to its domestic fishery product, the growth fluctuations as a function of domestically-landed catch would decay as a power law with an exponent (Buldyrev et al., 1997). This is because the standard deviation of the sum of independent quantities grows like (i.e. catches by fishers).
As to the stock status during the period 1950–1971, there was much room for continued expansion of capture fisheries (Grainger and Garcia, 1996). The fishing policy those days would have been virtually that “Strive for as much fish as possible from the resources.” All the decisions in a country would have been perfectly coordinated as if they had been all dictated by a single “boss”. The state of stock exploitation is then expected to have corresponded to the case (i): annual catches by individual fishers in a country were correlated strongly each other.
In 1972 or subsequent years, the observed decrease in fluctuations with country landings, Eq.(4), is considerably slower (i.e. ) than in the case (ii). Our empirical results suggest an important consequence for dynamics of stock exploitation: although countries with large fisheries tend to diversify into a wider range of fishing activities leading to smaller relative fluctuations in country landings, fisheries catches reported are more variable than what would be expected if the number of fishers would increase linearly with the country landings—which would correspond to .
5.1 Scaling relation between exponents
The country landings does not scale in a simple linear fashion with increasing number of fishers, but instead the typical number of fishers scales with landings as Eq.(18). The total capture production is broken down by numbers of landing sites (i.e. fishing ports) in a country. The fishery products in landing sites are landed by numbers of local fishers. These production equals the marketing volume of fish at local landing sites. Let us analyze fishery statistics of Japan on the marketing of fishery products in major landing areas (Ministry of Agriculture Forestry and Fisheries of Japan, 2002, 2003, 2004). It is virtually apparent in Fig.9, showing the probability distribution of catches landed at 203 ports (A) and the probability density of annual growth rate of port landings (B), that the same behavior holds for subsystems, i.e. the single country’s fisheries sector, as the world capture fisheries sector. The subsystems or hierarchical systems of capture fisheries sector are expected to be characterized by the same fundamental laws.
To account for the increased variability for highly producing countries (i.e. for years 1972–2002), we suppose that in a country with tonnes domestic fisheries production, the width of the annual per capita growth-rate distribution, denoted by , scales with landings as
| (20) |
with an exponent . Motivated by scaling behavior in the exploitation dynamics, I expect that there exist scaling relations among three exponents , and (Widom, 1965a, b). Assume that the per capita growth rate is independent (uncorrelated), identically distributed, though individual fishers may not be right fishing units that produce catches independently of one another; e.g. there are thousand fishery establishments while thousand fishers exist in Japan in 2003 (Ministry of Agriculture Forestry and Fisheries of Japan, 2005). The central limit theorem is then applied to give
| (21) |
leading to a scaling relation
| (22) |
For and , Eq.(22) predicts . It is remarkable that, contrary to country landings (Fig.4A), the per capita landings of highly producing countries fluctuate more than do those of low producing countries [Eq.(20) with ]: fishers in a country with larger landings risk more than do fishers in a country with smaller landings in capture fisheries.
6 Discussion
Studying the biological properties of the FAO global fisheries statistics on landed catches has given ecological insight to the state of world fish stocks: e.g. in Refs (Pauly et al., 1998; Caddy and Garibaldy, 2000; Pauly et al., 2005), global conclusions drawn state that a general decline in mean trophic level of marine and inland landings has occurred in many regions, reflecting a change in catch composition from long-lived, high trophic level, piscivorous bottom fishes toward short-lived, low trophic level invertebrates and planktivorous pelagic fishes. In this paper, from the socio-ecological viewpoint, I have analyzed the FAO data and found the universal scaling behavior in the dynamics of stock exploitation. Moreover, we empirically find from Fig.6 and Eq.(18), that the per capita production of countries with landings scales as
| (23) |
showing the increased per capita catches for highly producing countries (i.e. ). However, fishing business may have a high-risk premium: the larger their expected revenues in highly producing countries, the larger the fluctuations in annual per capita revenues, which is predicted by Eq.(20) with ; whereas the empirical data demonstrate decreasing fluctuations in annual domestically-landed catches with increased country landings [Fig.4A and Eq.(4) with ]. The expected fishing risk (i.e. fluctuations in the individual catches) in a country with tonnes annual domestic landings scales with the individual expected catches: , with an exponent , which seems to agree with the value of the exponent .
Though the growth era of the capture fisheries production has been ended during the last decade, the world fishers have been growing in number (35.8 percent from 1990 to 2002). The fishers population to total world population ratio has been increasing for the past thirty years and stood at 60.7 fishers per one thousand people in 2002. In most developing countries of low and middle-income, the number of people employed in the fisheries sector has been growing steadily. In industrialized economies offering occupational alternatives, the numbers of fishers have been on a declining trend or at best stationary. For instance in two important fishing countries, Japan and Norway, fishers have decreased in number by 34.3 and 19.7 percent, respectively, during the 1990 to 2002 period. The increasing trend of world fishers population may suggest that wages received by fishers (mostly in developing countries) exceed the level of wages that fishers could expect to earn in alternative employment opportunities, as commonly understood in economic analysis from the static viewpoint of the common-property fishery. Because fishers would be making money more than their opportunity costs (i.e. resource rent is positive), additional fishers would be attracted to the fishery, until it reaches the “bionomic” equilibrium (Gordon, 1954) where total sustained revenue equals total sustained cost. Contrary, if net revenues from fishing are negative, fishers leave the fishery.
The exploitation dynamics of fish stocks exhibits two-phase behavior, which may be according to stock status together with management policy. There was a change in scaling behavior of the standard deviation of production growth rates at 1972. It may be more than coincidence that the emergence of the United Nations’ Convention on the Law of the Sea, in the late 1970s, which enabled countries to claim exclusive economic zones reaching 200 nautical miles into the open sea, put the responsibility for fisheries resource management squarely with maritime countries, thus ending many decades of fighting over traditional fishing grounds (Johnstone, 1977).
Another possible cause for the observed transition at 1972 in scaling structure is that, having depleted large valuable stocks, fishing has redirected some effort and added a lot of it on other species lower down the food web. The strategy was advocated in the 1970s to increase fisheries production (Sprague and Arnold, 1972; Garcia and Grainger, 2005). The phenomenon of change in catch composition, i.e. “fishing down marine food webs” (Pauly et al., 1998), contrasts strikingly with D’Aancona’s observation on Mediterranean fisheries (D’Ancona, 1926) that the cessation of the fishery during World War I from 1914–1918 changed the species composition in favor of fish-eating fishes (the frequency of predators decreased with an increase in fishing after the war). The decline in mean trophic level of the world fish stocks leads to increasing variability in catches (Pauly et al., 2002). Indeed, we find from the analysis of the FAO data for all countries (excluding China) that the country landings fluctuate more for the periods 1972–2002 than do those for the periods 1950–1971. The standard deviation of growth rate of the annual domestically-landed catches for 30 one-year periods between 1972 and 2002 shows an increase of more than 10 percent over that for 21 one-year periods between 1950 and 1971:
| (24) |
whereas the average yearly growth rate declined significantly after 1972:
| (25) |
Besides highly variable recruitment of planktivorous pelagic fishes that is strongly influenced by environmental fluctuations, the schooling behavior common among such pelagics is a possible cause of variation in catch in purse seine fisheries. Some fishers catch more than others: the distribution of fishers’ yearly total landed value of catch in a commercial purse seine fishery is skewed to the right (Hilborn, 1985). School-size distributions of pelagic fishes, i.e. catch-per-haul distributions in purse seine fisheries, are generally heavy-tailed, and a typical school-size (rigorously defined as a crossover size from power-law to exponential decay of the school-size distribution) is proportional to the abundance of the fish stock (Niwa, 2003, 2004), seeming to be consistent with Eq.(20) with .
The global potential harvest (e.g. maximum sustainable yield) may be one of the causes for the observed transition in scaling behavior of fishery landings. Grainger and Garcia (1996) estimated the most likely potential of conventional marine species to range from 80 to 100 million tonnes, which has indeed been reached probably in the 1970s and is unlikely to change in the next 20–30 years (Garcia and Grainger, 2005). Undeveloped resource fisheries, producing much less than their potential, decreased rapidly to zero by the middle of the 1970s (Grainger and Garcia, 1996). The latest analysis of the state of resources (Garcia et al., 2005) indicates that, in 2003, approximately half the world’s stocks are exploited at or close to their maximum, and about 25 percent of them are exploited either below or above such maximum.
The same scaling laws as found here describe a number of other complex organizations (Stanley et al., 2002), such as business firms (Stanley et al., 1996), gross domestic product (Lee et al., 1998), university research budgets (Plerou et al., 1999), and bird populations (Keitt et al., 2002), suggesting the underlying universal mechanism. It is no wonder that commercial fisheries world-wide resemble competitive economic activities. In the same way that market forces operate in business, the stock exploitation appears to keep competition among fishers strong enough to leave capture fisheries with a shrinking resource base. According to FAO press release (FAO, 1998), most small-scale fishers find it increasingly difficult to survive in an over-exploited environment.
Amaral et al. (1998) proposed a model for the growth of organizations with complex internal structure. In the model, each organization (e.g. firm, university, or bird population) is made up of units. The units composing the system have a complex evolving structure, e.g. business firms competing in an economy are comprised of divisions; universities are composed of schools or colleges; population of breeding birds living in a given ecosystem is composed of groups living in different areas. Their model postulates that the units grow through an independent, Gaussian-distributed, random multiplicative process. Later this postulate empirically proved not to be accurate (Matia et al., 2004). Thus the model proposed by Amaral et al. (1998) can now be regarded as a first step towards the explanation of the growth dynamics of organizations. Scaling concepts offer an avenue to study heterogeneous assemblies in ecological and economic systems for which the microscopic processes are (probably) not knowable, except in terms of their statistical properties (Chave and Levin, 2003).
References
- Amaral et al. (1998) Amaral, L. A. N., Buldyrev, S. V., Havlin, S., Salinger, M. A. and Stanley, H. E., 1998. Power law scaling for a system of interacting units with complex internal structure. Phys. Rev. Lett. 80, 1385–1388.
- Axtell (2001) Axtell, R. L., 2001. Zipf distribution of U.S. firm. Science 293, 1818–1820.
- Beddington and Kirkwood (2005) Beddington, J. and Kirkwood, G. (Editors), 2005. Fisheries: a Future? Phil. Trans. R. Soc. B 360 (1453).
- Bjørnstad and Grenfell (2001) Bjørnstad, O. N. and Grenfell, B. T., 2001. Noisy clockwork: time series analysis of population fluctuations in animals. Science 293, 638–643.
- Bjørnstad et al. (1999) Bjørnstad, O. N., Fromentin, J.-M., Stenseth, N. C. and Gjøsæter, J., 1999. Cycles and trends in cod populations. Proc. Natl. Acad. Sci. USA 96, 5066–5071.
- Botsford et al. (1997) Botsford, L. W., Castilla, J. C. and Peterson, C. H., 1997. The management of fisheries and marine ecosystems. Science 277, 509–515.
- Buldyrev et al. (1997) Buldyrev, S. V., Amaral, L. A. N., Havlin, S., Leschhorn, H., Maass, P., Salinger, M. A., Stanley, H. E. and Stanley, M. H. R., 1997. Scaling behavior in economics: II. modeling of company growth. J. Phys. I France 7, 635–650.
- Caddy and Garibaldy (2000) Caddy, J. F. and Garibaldy, L., 2000. Apparent changes in the trophic composition of world marine harvests: the perspective from the FAO capture database. Ocean and Coastal Management 43, 615–655.
- Chave and Levin (2003) Chave, J. and Levin, S., 2003. Scale and scaling in ecological and economic systems. Environ. Resource Econ. 26, 527–557.
- Conklin and Kolberg (1994) Conklin, J. E. and Kolberg, W. C., 1994. Chaos for the halibut? Mar. Resour. Econ. 9, 153–182.
- D’Ancona (1926) D’Ancona, U., 1926. Dell’influenza della stasi peschereccia del periodo 1914-1918 sul patrimonio ittico dell’Alto Adriatico. Regio Comitato Talassografico Italiano, Memoria 126.
- D’Ancona (1954) D’Ancona, U., 1954. The Struggle for Existence. E. J. Brill, Leiden.
- Dixon et al. (1999) Dixon, P. A., Milicich, M. J. and Sugihara, G., 1999. Episodic fluctuations in larval supply. Science 283, 1528–1530.
- Ehrhardt (2005) Ehrhardt, N. M., 2005. Introduction to the world conference on the “scientific and technical bases for the sustainability of fisheries”. Bull. Mar. Sci. 76, 167–170.
- FAO (1998) FAO, 1998. Number of fishers doubled since 1970. FAO Press Release 98/09. web-site at http://www.fao.org/WAICENT/OIS/PRESS_NE/ PRESSENG/1998/pren9809.htm.
- FAO (1999) FAO, 1999. Numbers of fishers, 1970–1996. FAO Fisheries Circular No.929, Rev.1. FAO, Rome. I here use the CSV (comma separated value) data of World Resources Institute, at Internet site “EarthTrends/Fisheries: People actively fishing, number” (http://earthtrends.wri.org/text/COA/variables/ 698.csv).
- FAO (2004a) FAO, 2004a. Fishstat Plus: Universal software for fishery statistical time series (version 2.3) with the dataset “Capture production 1950–2002”. web-site at http://www.fao.org/fi/statist/fisoft/FISHPLUS.asp. Data included in the dataset are published as “FAO Yearbook of Fishery Statistics, Capture production 2002, Vol.94/1 (2004).” FAO, Rome.
- FAO (2004b) FAO, 2004b. The State of World Fisheries and Aquaculture 2004. web-site at http://www.fao.org/sof/sofia/.
- Frisch and Sornette (1997) Frisch, U. and Sornette, D., 1997. Extreme deviations and applications. J. Phys. I France 7, 1155–1171.
- Garcia and Grainger (2005) Garcia, S. M. and Grainger, R. J. R., 2005. Gloom and doom? the future of marine capture fisheries. Phil. Trans. R. Soc. B 360, 21–46.
- Garcia et al. (2005) Garcia, S. M., de Leiva Moreno, I. and Grainger, R. J. R., 2005. Global trends in the state of marine fisheries resources 1974–2003. In: FAO, Review of the State of World Marine Fishery Resources. FAO Fish. Tech. Pap. 457, 10–14.
- Gibrat (1931) Gibrat, R., 1931. Les Inégalitiés Économiques; Applications: aux inégalitiés des richesses, à la concentration des extreprises, aux populations des villes, aux statistiques des familles, etc., d’une loi nouvelle, la loi de l’effet proportionnel. Librarie du Recueil Sirey, Paris.
- Gordon (1954) Gordon, H. S. 1954. The economics of a common property resource: the fishery. J. Polit. Econ. 62, 124–142.
- Grainger and Garcia (1996) Grainger, R. J. R. and Garcia, S. M., 1996. Chronicles of marine fishery landings (1950–1994): trend analysis and fisheries potential. FAO Fish. Tech. Pap. 359.
- Higgins et al. (1997) Higgins, K., Hastings, A., Sarvela, J. N. and Botsford, L. W., 1997. Stochastic dynamics and deterministic skeletons: population behavior of Dungeness crab. Science 276, 1431–1435.
- Hilborn (1985) Hilborn, R., 1985. Fleet dynamics and individual variation: why some people catch more fish than others. Can. J. Fish. Aquat. Sci. 42, 2–13.
- Hsieh et al. (2005) Hsieh, C., Glaser, S. M., Lucas, A. J. and Sugihara, G., 2005. Distinguishing random environmental fluctuations from ecological catastrophes for the North Pacific Ocean. Nature 435, 336–340.
- Johnstone (1977) Johnstone, K., 1977. The Aquatic Explorers: A History of the Fisheries Research Board of Canada. University of Toronto Press, Toronto.
- Keitt and Stanley (1998) Keitt, T. and Stanley, H. E., 1998. Dynamics of North American breeding bird populations. Nature 393, 257–260.
- Keitt et al. (2002) Keitt, T. H., Amaral, L. A. N., Buldyrev, S. V. and Stanley, H. E., 2002. Scaling in the growth of geographically subdivided populations: invariant patterns from a continent-wide biological survey. Phil. Trans. R. Soc. Lond. B 357, 627–633.
- Laherrère and Sornette (1998) Laherrère J. H. and Sornette, D., 1998. Stretched exponential distributions in nature and economy: “fat tails” with characteristic scales. Eur. Phys. J. B 2, 525–539.
- Lee et al. (1998) Lee, Y., Amaral, L. A. N., Canning, D., Meyer, M. and Stanley, H. E., 1998. Universal features in the growth dynamics of complex organizations. Phys. Rev. Lett. 81, 3275–3278.
- Lotka (1925) Lotka, A. J., 1925. Elements of Physical Biology. Williams & Wilkins Co., Baltimore.
- Matia et al. (2004) Matia, K., Fu, D., Buldyrev, S. V., Pammolli, F., Riccaboni, M. and Stanley, H. E., 2004. Statistical properties of business firms structure and growth. Europhys. Lett. 67, 498–503.
- Matsuda et al. (1991) Matsuda. H., Wada, T., Takeuchi, Y. and Matsumiya, Y., 1991. Alternative models for species replacement of pelagic fishes. Res. Popul. Ecol. 33, 41–56.
- Matsuda et al. (1992) Matsuda, H., Wada, T., Takeuchi, Y. and Matsumiya, Y., 1992. Model analysis of the effect of environmental fluctuation on the species replacement pattern of pelagic fishes under interspecific competition. Res. Popul. Ecol. 34, 309–319.
- May (1974) May, R. M., 1974. Biological populations with nonoverlapping generations: stable points, stable cycles and chaos. Science 186, 645–647.
- May (1976) May, R. M., 1976. Simple mathematical models with very complicated dynamics. Nature 261, 459–467.
- McQuaid et al. (1996) McQuaid, J., Marshall, B., Schleifstein, M. and Jackson, T., 1996. Oceans of Trouble. The Times-Picayune, New Orleans. March 24–31, 1996. available at Internet site “1997 Pulitzer Prizes” (http://www.pulitzer.org/year/1997/ public-service/works/).
- Ministry of Agriculture Forestry and Fisheries of Japan (2002, 2003, 2004) Ministry of Agriculture Forestry and Fisheries of Japan, 2002, 2003 and 2004. Yearbook of Statistics on the Marketing of Fishery Products (2000, 2001 and 2002). Association of Agriculture-Forestry Statistics, Tokyo. Data downloadable at: http://www.tdb.maff.go.jp/toukei/a02smenu?TouID=C005. (in Japanese)
- Ministry of Agriculture Forestry and Fisheries of Japan (2005) Ministry of Agriculture Forestry and Fisheries of Japan, 2005. The 11th Fishery Census of Japan 2003. Association of Agriculture-Forestry Statistics, Tokyo. Summary of survey results available at: http://www.maff.go.jp/ toukei/sokuhou/data/gyogyou-census2003-v/gyogyou-census2003-v.htm. (in Japanese)
- Niwa (2003) Niwa, H.-S., 2003. Power-law versus exponential distributions of animal group sizes. J. Theor. Biol. 224, 451–457.
- Niwa (2004) Niwa, H.-S., 2004. Space-irrelevant scaling law for fish school sizes. J. Theor. Biol. 228, 347–357.
- Pauly et al. (1998) Pauly, D., Christensen, V., Dalsgaard, J., Froese, R. and Torres, Jr., F., 1998. Fishing down marine food webs. Science 279, 860–863.
- Pauly et al. (2002) Pauly, D., Christensen, V., Guénette, S., Pitcher, T. J., Sumaila, U. R., Walters, C. J., Watson, R. and Zeller, D., 2002. Towards sustainability in world fisheries. Nature 418, 689–695.
- Pauly et al. (2005) Pauly, D., Watson, R. and Alder, J., 2005. Global trends in world fisheries: impacts on marine ecosystems and food security. Phil. Trans. R. Soc. B 360, 5–12.
- Plerou et al. (1999) Plerou, V., Amaral, L. A. N., Gopikrishnan, P., Meyer, M. and Stanley, H. E., 1999. Similarities between the growth dynamics of university research and of competitive economic activities. Nature 400, 433–437.
- Sæther et al. (2000) Sæther, B.-E., Tufto, J., Engen, S., Jerstad, K., Røstad, O. W. and Skåtan, J. E., 2000. Population dynamical consequences of climate change for a small temperate songbird. Science 287, 854–856.
- Smith (1994) Smith, T. D., 1994. Scaling Fisheries: the science of measuring the effects of fishing, 1855-1955. Cambridge University Press, Cambridge.
- Sprague and Arnold (1972) Sprague, L. M. and Arnold, J. H., 1972. Trends in the use and prospects for the future harvest of world fisheries resources. J. Am. Oil Chem. Soc. 49, 345–350.
- Stanley et al. (2002) Stanley, H. E., Amaral, L. A. N., Buldyrev, S. V., Gopikrishnan, P., Plerou, V. and Salinger, M. A., 2002. Self-organized complexity in economics and finance. Proc. Natl. Acad. Sci. USA 99, suppl. 1, 2561–2565.
- Stanley et al. (1996) Stanley, M. H. R., Amaral, L. A. N., Buldyrev, S. V., Havlin, S., Leschhorn, H., Maass, P., Salinger, M. A. and Stanley, H. E., 1996. Scaling behaviour in the growth of companies. Nature 379, 804–806.
- Symes (2005) Symes, D., 2005. Fishing, the environment and the media. Fish. Res. 73, 13–19.
- Takeuchi et al. (1992) Takeuchi, Y., Oshime, Y. and Matsuda, H., 1992. Persistence and periodic orbits of a three-competitor model with refuges. Math. Biosci. 108, 105–125.
- Turchin (2003) Turchin, P., 2003. Complex Population Dynamics: a theoretical/empirical synthesis. Princeton University Press, Princeton.
- United Nations Population Division (2004) United Nations Population Division of the Department of Economic and Social Affairs, 2004. World Population Prospects: the 2004 revision. web-site at http://esa.un.org/unpp.
- Volterra (1926) Volterra, V., 1926. Fluctuations in the abundance of a species considered mathematically. Nature 118, 558–560.
- Watson and Pauly (2001) Watson, R. and Pauly, D., 2001. Systematic distortions in world fisheries catch trends. Nature 414, 534–536.
- Weibull (1951) Weibull, W., 1951. A statistical distribution function of wide applicability. J. Appl. Mech. 18, 293–297.
- Weisbuch et al. (1997) Weisbuch, G., Stanley, E. A., Duchateau-Nguyen, G., Antona, M. and Clément-Pitiot, H., 1997. Influence of capital inertia on renewable resource depletion. Theory Biosci. 116, 97–117.
- Widom (1965a) Widom, B., 1965a. Surface tension and molecular correlations near the critical point. J. Chem. Phys. 43, 3892–3897.
- Widom (1965b) Widom, B., 1965b. Equation of state in the neighborhood of the critical point. J. Chem. Phys. 43, 3898-3905.
- Wilson et al. (1991) Wilson, J. A., J. French, P. Kleban, S. R. McKay and Townsend, R., 1991. Chaotic dynamics in multiple species fishery: a model of community predation. Ecol. Model. 58, 303–322.
- Zipf (1949) Zipf, G. K., 1949. Human Behavior and the Principle of Least Effort. Addison-Wesley, Reading, Massachusetts.
Figure legends
-
Fig.1
World fisheries trend including ()/excluding () China. (A) Semi-logarithmic scale plot of global capture trend. Exponentially growing behavior with two growth-rates is observed. There is a knee in the curve at 1972, probably figuring the boundary between two distinct regimes of the bio-economies. The solid lines are fits of an exponential function [] to the data () with average yearly growth rates and for the periods 1950–1971 and 1972–1989, respectively. A plateau in the 1990s follows immediately (to be precise ). Fitting the data () gives and for the periods 1950–1971 and 1972–2002, respectively (depicted by broken lines). (B) Trend of the world fisher population . The ordinate represents . The broken and solid lines depict exponential fits to the data including and excluding China, giving population growth rate and for the period 1970–2002, respectively (annual growth rate of the fisher population world-wide is defined as same as the global harvest case). The inserted figure shows the fisher-to-population ratio. The earth’s human population data from 1970 to 2000 were retrieved from the web-site of United Nations Population Division (2004). The human population has been growing at an average rate of 1.67 percent per year (excluding China, 1.74 percent) since 1970 to 2000.
-
Fig.2
Fisheries production and employment statistics. Data exclude China’s statistics. (A) Semi-logarithmic scale plot of probability distribution of country landings, . The abscissa is chosen as logarithmically scaled landings . The data from 6 one-year periods between 1950 and 2000 are plotted, where geometric means of landings (in thousand tonnes) and geometric standard deviations are as follows: , 9.8, 15.4, 16.9, 20.1 and 20.4, and , 2.6, 2.7, 2.9, 2.9 and 2.9, from years 1950 , 1960 , 1970 , 1980 , 1990 and 2000 , respectively. Log-scaled landings fall onto the standardized Gaussian distribution (dashed line) with zero mean and unit variance. (B) Semi-logarithmic scale plot of probability distributions of the number of fishers and fish farmers in countries, . The abscissa is chosen as logarithmically scaled fishers population , where geometric means of the number of fishers (in thousand fishers) and geometric standard deviations are as follows: , 8.1 and 10.2, and , 2.1 and 2.0, from years 1970 , 1980 and 1990 , respectively. Log-scaled fishers population fall onto the standardized Gaussian distribution (dashed line). The log-normal distribution holds robustly for fishers as well as landings.
-
Fig.3
Exploitation dynamics of fish stocks. (A) Semi-logarithmic scale plot of probability density of the annual growth rate for eight different bins of fisheries production (in tonnes): , , , , , , , . The data are aggregated over all 21 one-year periods between 1950 and 1971. The distribution decays with fatter tails than for a Gaussian. The broken line is a fit of a Laplace distribution [Eq.(3)] for the period, with and . It is depicted that does not depend on . (B) Semi-logarithmic scale plot of probability density of the growth rate for countries with small and large landings in the years 1972–1989/1990–2002: and in tonnes. The broken and solid lines are Laplacian fits using the means and and standard deviations and , calculated from data for countries with small and large landings in the years 1972–1989, respectively. Fits with Eq.(3) for small and large landings in 1990–2002 give the means and and standard deviations and , overlapping broken and solid lines in the graph.
-
Fig.4
Scaling in stock exploitation dynamics. (A) Standard deviation of the one-year growth rates of the 21 annual intervals from the period 1950–1971 (), of the 17 annual intervals from the period 1972–1989 (), and of the 12 annual intervals from the period 1990–2002 (), as a function of the landings (plotted on a double-logarithmic scale). Each data point indicates the width of the growth-rate distribution for countries with approximately the same landings (binned evenly spaced on a logarithmic scale). The long-dashed horizontal line depicts the average of the growth fluctuations for years 1950–1971 (), showing . The solid and broken lines are fits with Eq.(4) to the data from years 1972–1989 () and 1990–2002 (), respectively. There are cutoffs at the small landings in power laws. Error bars of one standard deviation about each data point are shown. (B) Scaled probability density as a function of the scaled growth rate for seven different bins of production in the years 1972–1989 (in tonnes): , , , , , , . The values are scaled by using the measured values of and , and plotted on a semi-logarithmic scale. All the data collapse upon the universal curve (broken line). A data collapse can be obtained for 1990–2002 as well.
-
Fig.5
Growth rates of country landings for longer time scales. The data points are aggregated over the entire period, 1950–2002, for all countries (excluding China). (A) Probability densities of -year growth rates are shown for (), 10 (), 20 () and 30 years (), plotted on a semi-logarithmic scale. Averages and standard deviations of the -year growth rate are as follows: , 0.39, 0.73 and 1.08, and , 0.80, 0.99 and 1.11 for the same time scales. The solid line indicates a Laplace distribution [Eq.(10)] with and . It is visually apparent that the distributions approach a Gaussian as increases. (B) Semi-logarithmic scale plot of probability distributions of the normalized growth rates . The broken line shows the standardized Gaussian distribution. (C) Double-logarithmic scale plot of complementary cumulative distributions for the positive tails of the probability densities shown in Fig.B. The complementary CDFs for the negative tails have the same functional forms as for the positive tails. (D) Fractional moments for the normalized growth rates for the same time scales: (long-dashed line), 10 (medium-dashed line), 20 (short-dashed line) and 30 years (dotted line). The solid line shows the Gaussian moments.
-
Fig.6
Statistical analysis of the number of fishers. Data exclude China’s statistics. (A) Number of fishers versus country landings (in tonnes). The ordinate and the abscissa are chosen as and , respectively. Data are aggregated for seven years (1990–1996). The rectangle in gray reads the inter-quantile range of binned data and the slit indicates the median, showing that the conditional distribution is skewed to the right, where the bins are chosen equally spaced on a logarithmic scale as with . The dashed line shows a power-law fit to scatter plot data, suggesting that the typical number of fishers scales with country landings as . From the slope of the dashed line, the exponent is evaluated at . (B) Stretched exponential law in the conditional probability of given , . The negative logs of complementary CDF, , are plotted versus decimal log of the number of fishers, , on a semi-logarithmic scale. The data points fall onto straight lines. The countries are partitioned into four groups according to landings (in tonnes): , , , . The solid lines are stretched exponential fits to the data, representing power-law curves, , where , , and , estimated from Eqs.(13) and (14). The estimated reference scales are depicted in Fig.A with symbol (), which closely follow the dashed line. The exponent characterizing stretched exponential distributions should be the exponent in the power-low dependence of the average number of fishers in a country with annual domestic landings as suggested in Fig.A (dashed line). A power-law fit with to estimated ’s (solid line in Fig.A) gives and , exhibiting a good agreement with values of the exponent estimated from Eqs.(13) and (14).
-
Fig.7
Scaling in employment statistics for the period 1990–1996. (A) To test the scaling hypothesis in Eq.(15), the scaled probability distributions are plotted versus scaled number of fishers (double-logarithmic scale). The data for four different bins are scaled by using the values of landings , , , tonnes (), with and . The conditional PDF exhibits scaling, i.e. the data collapse onto a single curve, yielding a scaling function . The solid line depicts the stretched exponential distribution [Eq.(17)]. (B) Shown is the data collapse of the four curves in Fig.6B. The negative logs of complementary CDF, , are plotted versus scaled number of fishers (double-logarithmic scale). The solid line depicts the power-law curve, .
-
Fig.8
Recovering a log-normal distribution from a stretched exponential. Semi-logarithmic scale plot of probability distribution of the number of fishers for all countries (excluding China). The abscissa is chosen as . The data points are the average over the period 1990–1996, and the dashed line is a fit of the log-normal PDF to the data with geometric mean (in thousand fishers) and geometric standard deviation . Numerically integrating the conditional PDF using stretched exponential function Eq.(17) with over a PDF of the country landings using Eq.(1), a log-normal distribution of the number of fishers is approximately recovered (solid line). The reference size of the stretched exponential distribution is with . The distribution of the landing data for years 1990–1996 has the geometric mean (in thousand tonnes) and the geometric standard deviation .
-
Fig.9
Statistics on the marketing of fishery products in landing sites (203 ports) in Japan. (A) Semi-logarithmic scale plot of probability distribution of local capture production . The abscissa is chosen as logarithmically scaled landings , where geometric means of landings (in thousand tonnes) and geometric standard deviations are as follows: , 3.60 and 3.33, and , 1.70 and 1.66, from years 2000 , 2001 and 2002 , respectively. Log-scaled landings fall onto the standardized Gaussian distribution (dashed line). The port landing data exhibit the log-normal probability distribution, same as the distribution of country landings (Fig.2A). (B) Semi-logarithmic scale plot of probability density function of annual growth rate of port landings. The points are the average over the years 2000–2002. We find the same tent shape distribution as the distribution of country landings growth rate plotted on a semi-logarithmic scale. The solid line is an exponential fit, , with average growth rate and standard deviation . The dashed line is a Gaussian fit with standard deviation .
Figures
-
Fig.1
World fisheries trend including ()/excluding () China.
-
Fig.2
Fisheries production and employment statistics.
-
Fig.3
Exploitation dynamics of fish stocks.
-
Fig.4
Scaling in stock exploitation dynamics.
-
Fig.5
Growth rates of country landings for longer time scales.
-
Fig.6
Statistical analysis of the number of fishers.
-
Fig.7
Scaling in employment statistics for the period 1990–1996.
-
Fig.8
Recovering a log-normal distribution from a stretched exponential.
-
Fig.9
Statistics on the marketing of fishery products in landing sites in Japan.