Targeted Projection Pursuit for Gene Expression Data Classification and Visualisation
Abstract
We present a novel method for finding low dimensional views of high dimensional data: Targeted Projection Pursuit. The method proceeds by finding projections of the data that best approximate a target view. Two versions of the method are introduced; one version based on Procrustes analysis and one based on a single layer perceptron. These versions are capable of finding orthogonal or non-orthogonal projections respectively. The method is quantitatively and qualitatively compared with other dimension reduction techniques. It is shown to find two-dimensional views that display the classification of cancers from gene expression data with a visual separation equal to, or better than, existing dimension reduction techniques.
1 Contact:
joe.faith@unn.ac.ukjoe.faith@unn.ac.uk
2 Introduction
This paper considers the problem of visualising classifications of samples based on high dimensional gene expression data. There are many powerful automatic techniques for analysing such data, but visualisation represents an essential part of the analysis as it facilitates the discovery of structures, features, patterns and relationships, enables human exploration and communication of the data and enhances the generation of hypotheses, diagnoses, and decision making.
Visualising gene expression data requires representing the data in two (or occasionally one or three) dimensions. Therefore techniques are required to accurately and informatively show these very high-dimensional data structures in low imensional representations. In the particular case considered here, that of showing the classification of gene expression data taken from cancer samples, the most useful view will be one that clearly shows the separation between classes, allowing the analyst to easily identify outliers and cases of possible misdiagnosis, and to visually compare particular samples.
There are many established techniques for viewing high-dimensional data in lower dimensional spaces. Among these, multi-dimensional scaling (MDS), including Sammon mapping, finds a view of the data that best preserves the distances between points (Ewing et al,, 2001); VizStruct is a technique based on radial coordinates (Zhang et al,, 2004); dendrograms may be used to linearly arrange and display clustered gene expression data (Eisen et al,, 1998); and projection pursuit (Lee et al,, 2005) finds linear projections that optimise some measure of their quality (the projection pursuit index ).
Each of these techniques has limitations. MDS is a map-based, rather than projection-based, technique in which adding single datum requires creating a new view of the entire set; thus it is not possible to visualise the relationships of new or unclassified samples to existing ones. VizStruct is not optimized for viewing classifications of the data, and is also reliant on reducing the dimensionality of the original data through some form of feature selection. Dendrograms use linear arrangements of the data and so are restricted to a single dimension for display. Projection pursuit can optimize views for classification, and is based on a linear projection, but is based on some form of search-based optimisation and so also relies on feature selection to reduce the size of the search space.
Here we present an alternative method for finding linear and non-linear two-dimensional projections that yield views of the data that are closest to a hypothesised optimal target. The method is efficient and, in one version, not reliant on feature selection. It is compared both quantitatively and subjectively with existing techniques and is found to perform similarly to the best of alternatives. When combined with other techniques it can efficiently find views that are better than all alternatives and which are close to the theoretical optimum.
3 Targeted Projection Pursuit
Conventional projection pursuit proceeds by searching the space of all possible projections to find that which aximises an index that measures the quality of each resulting view. In the case considered here, a suitable index would measure the degree of clustering within, and separation between, classes of points (Lee et al,, 2005). Targeted projection pursuit, on the other hand, proceeds by hypothesising an ideal view of the data, and then finding a projection that best approximates that view. The intuition motivating this technique is that the space of all possible views of a high dimensional data set is extremely large, so search-based methods of finding particular views may not be effective. Hence the alternative technique is pursued of suggesting an ideal view and then finding a nearest match.
Suppose is an matrix that describes the expression of genes in samples and is a matrix that describes a two-dimensional target view of those samples. We require the projection matrix, , that minimises the size of the difference between the view resulting from this projection of the data and our target:
| (1) |
where denotes the Euclidean norm.
Two methods are considered for solving equation (1), depending on whether the projection matrix is required to be orthogonal or not.
3.1 Orthogonal Projections
If we make the restriction that projection P is an orthogonal-column matrix, then equation (1) is an example of a Procrustes problem (Gower et al,, 2004), and a solution may be found using the following version of the Singular Values Decomposition (SVD) method presented by Golub and Loan (Golub et al,, 1996)(see Cox et al, (2001) for a discussion of earlier treatments).
Golub and Loan s method finds the projection matrix, , that best maps an set of data, , onto an target view, , as follows:
| (2) |
Where the superscript in equation (2) denotes the transpose operator, and where and are the square matrices with orthogonal columns derived from the SVD of :
| (3) |
However if the target view, , is then it can be expanded to an matrix, by padding with columns of zeroes. And the required projection, , can be derived from by taking just the first two columns.
Efficient methods for SVD are available in most common mathematical and statistical packages such as MATLAB and R. Moreover the complexity of calculating a SVD is dependent on the rank of the matrix, i.e the number of linearly independent rows or columns, rather than its absolute size. Thus, where the number of samples is much less than the number of genes (), then the complexity of solving a Procrustes equation will end to be dependent on the former rather than the latter. Hence this technique scales extremely efficiently to high gene numbers.
3.2 Non-Orthogonal Projections
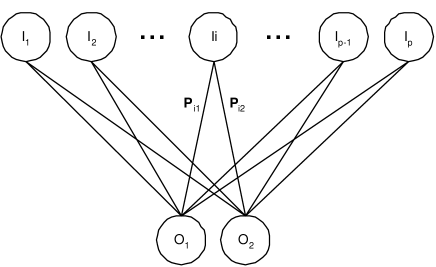
If the projection is not required to be orthogonal then a solution to equation (1) may be found by training a single layer perceptron with input units and 2 linear output units (see Figure 1). Each of the data rows in are presented in turn, and standard back-propagation is used to train the network to produce the corresponding row of in response. Once converged, the network can be used to transform data from the original gene-space to a 2 dimensional view, with the weight of the connection from the input neuron to the output neuron corresponding to the value of the projection matrix .
4 Targeted Projection Pursuit for Classification Visualisation
Given a data set and a target view , then the methods described in Sections 3.1 and 3.2 will find views of that approximate . But what is the appropriate target view when considering the classification of gene expression data? If the samples are partitioned into known classes then the ideal view would be that in which the classes are most clearly separated; that is where all members of the same class are projected onto single points and where those points are evenly spaced. Thus the ideal view is one in which all the members of each class are projected onto a single vertex of a geometric simplex.
The -simplex, or hypertetrahedron, is the generalisation of an equilateral triangle () or tetrahedron () to higher dimensions. That is, the simplest possible polytope in any given space, that in which all vertices are equidistant from each other. The -simplex itself is a polytope in dimensions, but two-dimensional graphs of the three-simplices thru 5-simplices are shown in Figure 2.

For example, given a set of samples taken from three classes over a large number of dimensions then the ideal view of that data would approximate an equilateral triangle, with the samples of each class clustered at the vertices, and hence would show the clustering within, and the separation between, classes. Whether or not an accurate approximation to such a view can be found depends on how well separated the original data is.
The significance of using a -simplex rather than just a regular polyhedron as our projection target can be shown by considering the case of . It may be supposed that the separation of classes could be effectively shown by projecting the members of each class onto the vertices of a square. However the vertices of a square are not equidistant: the two diagonal pairs of vertices are further apart that the pairs of vertices on each edge. Therefore, using a square as a projection target would entail breaking symmetry; effectively assuming that the pairs of classes that are mapped to the diagonally opposed vertices are further separated than the other pairs. And this assumption may not be justified. Mapping to the tetrahedron, on the other, makes no such assumption. Symmetry is not broken since each pair of vertices are equally separated.
The procedure of mapping data onto a target view can also be considered in two other ways, other than the geometric interpretation given above. First, as a set of binary classification problems; second as a spatial classification problem.
First, note that the coordinates of the vertices of the k-simplex can be generated by taking the rows of the -dimensional identity matrix; i.e. the unit diagonal matrix,
Now, if is the set of members of the class (with complement ), then mapping the sample classes onto the -simplex is equivalent to individual binary classification problems, in which the column of our projection matrix, denoted as , maps the members of to 1 and the members of to 0. (A similar technique for reducing a multiclass classification problem to multiple binary classifications is explored by Shen et al, 2006.)
Alternatively, the projection onto a simplex can be thought of as mapping the original data into ‘class space – a dimensional space in which the ordinate of the point represents how closely the sample is correlated with the class.
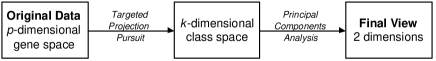
Whether considered as a mapping onto a simplex, as a combination of binary classification tasks, or as a mapping into class space, the view of the data produced by targeted projection pursuit is -dimensional. Therefore where there are two or three classes the result can be visualised directly. However, where then a further dimension reduction step is required to view the data. Here we use principal components analysis (PCA) on the rows of our projection matrix, , each a -dimensional vector, to find a lower dimensional projection that best preserves the information in . Thus we have a two-stage dimension reduction process, each stage of which is based on a linear projection; therefore the combined result is itself a linear projection (see Figure 3).
5 Method
The targeted projection pursuit techniques outlined in Sections 3 and 4 were tested for their ability to produce two-dimensional views of data that clearly separate sample classes. The techniques were tested on three publicly available data sets, and the views were compared with the output from standard dimension reduction techniques. The views of each data set produced by each technique were tested both quantitatively and qualitatively. The views were quantitatively compared in two ways: first, by submitting them to a standard classification algorithm and measuring the resulting generalisation performance; and, second, by using a standard statistical measure of class separability. The views were qualitatively compared by visual inspection.
The following dimension reduction techniques were compared:
-
•
SLP: The result of targeted projection pursuit using a single layer linear perceptron network, followed by PCA.
-
•
PRO: The result of targeted orthogonal projection pursuit using the solution to a Procrustes equation, followed by PCA.
-
•
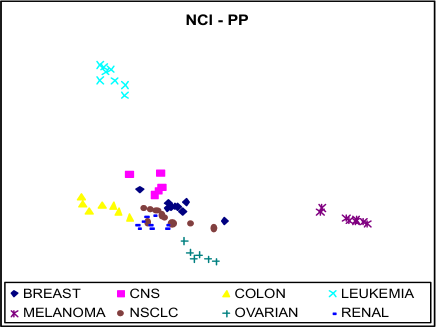
PP: The linear projection produced by search-based projection pursuit (Lee et al,, 2005)
-
•
SAM: The result of a Sammon dimension-reduction non-linear mapping (Ewing et al,, 2001).
-
•
VS: The result of a VizStruct non-linear projection (Zhang et al,, 2004).
All of these techniques, apart from PRO, required feature selection before processing, in which the top 50 most discriminatory genes were chosen on the basis of the ratio of their between-group to within-group sums of squares (Dudoit et al,, 2002).
The following data sets were used:
-
•
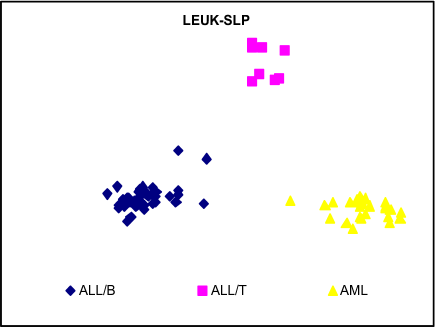
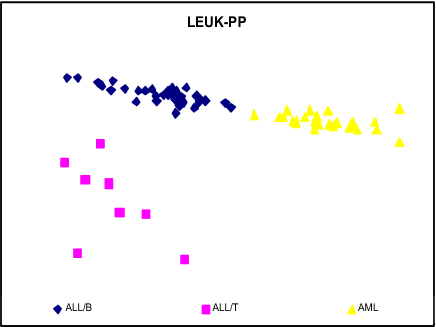
LEUK: This dataset is the result of a study of gene expression in two types of acute leukemia: acute lymphoblastic leukemia (ALL) and acute myeloid leukemia (AML) (Golub et al,, 1999). The samples consist of 38 cases of B-cell ALL, 9 cases of T-cell ALL, and 25 cases of AML with the expression levels of 7219 genes measured. Note that, following Lee et al (2005), the B-cell and T-cell ALL samples are considered as separate classes.
-
•
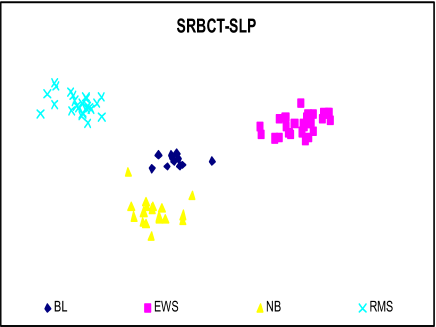
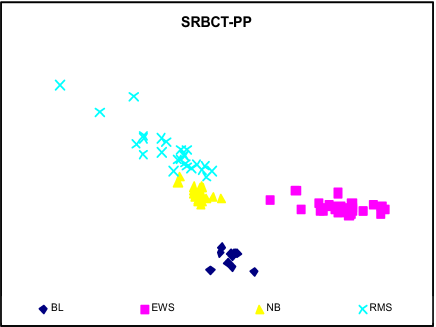
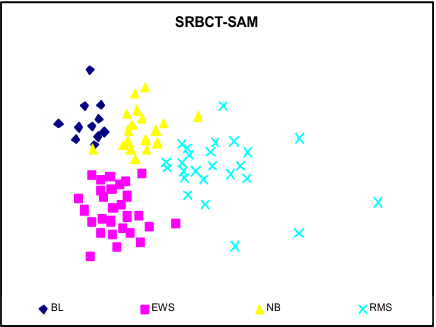
SRBCT: This dataset comprises cDNA microarray analysis of small, round blue cell childhood tumors (SRBCT), including neuroblastoma (NB), rhabdomyosarcoma (RMS), Burkitt Lymphoma (BL; a subset of non-Hodgkin lymphoma) and members of Ewing family of tumors (EWS). Expression levels from 6567 genes for 83 samples were taken (Khan et al,, 2001).
-
•
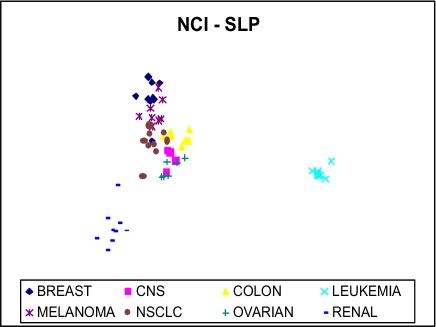
NCI: This dataset records the variation in gene expression among the 60 cell lines from the National Cancer Institute’s anticancer drug screen (Scherf et al,, 2000). It consists of 8 different tissue types where cancer was found: 9 breast, 5 central nervous system (CNS), 7 colon, 6 leukemia, 8 melanoma, 9 non-small-cell lung carcinoma (NSCLC), 6 ovarian, 2 prostate, 8 renal. 9703 cDNA sequences were used.
All data sets were normalised to zero mean and unit variance for each gene.
The classification algorithm used for the quantitative evaluation was K Nearest Neighbours with (i.e. ). This choice of algorithm was motivated by two considerations. The first is that it is known to be effective at discriminating classes of tumour using gene expression data (Dudoit et al,, 2002). The second consideration is KNN is an instance- and distance-based measure in which the classification of an instance is dependent on the classes of its nearest neighbours. It is assumed that this measure would accord better with human judgement than a probabilistic attribute-based measure such as Naïve Bayes – even though the latter may have superior classification performance in some cases. The Weka implementation of this algorithm was used (Witten et al,, 2005), tested using 10-fold cross-validation, and a simple percentage accuracy score found.
Note that the accuracy of classification using KNN for each view tested is not equivalent to a true generalisation performance since the views were produced using the full data sets, rather than a training subset. This is because it is the class separation within each view that is being tested, rather than the performance of the classifier. Given a view, we would like to know how visually separated the classes in the data are – operationalised as classifier generalisation – not which technique produces the best generalisation performance as a classifier.
The statistical measure of class separability used to compare views was the Linear Discriminant Analysis projection pursuit index () introduced by Lee et al (2005), based on the ratio of between-groups to within-groups sums of squares. If is the view of the member of the class then let
Thus is a measure of the variance of the centroids of the classes, and is a measure of the variance of the instances within each class. In order to get a projection pursuit index in the range [0,1], with increasing values corresponding to increasing class separation then, , a version of Wilks Lamda, a standard test statistic used in multivariate analysis of variance, is used:
The R-code implementation of distributed by Lee et al (2005) was used to measure the class seperability of the resulting views.
6 Results
The quantitative comparison of the four projections on the three data sets is shown in Table 1, and a sample of the resulting views are given in figures 4-12.
| Data Set | LEUK | SRBCT | NCI | ||||
|---|---|---|---|---|---|---|---|
| Genes | 7129 | 2308 | 9712 | ||||
| Samples | 72 | 83 | 61 | ||||
| Classes | 3 | 4 | 8 | ||||
| Class Separation Measure | |||||||
| .997 | 100 | .998 | 98.8 | .999 | 74.5 | ||
| .945 | 94.4 | .971 | 96.4 | .967 | 54.1 | ||
| Dimension Reduction Technique: | .975 | 98.6 | .990 | 97.6 | .872 | 91.8 | |
| .959 | 97.2 | .911 | 95.2 | .958 | 67.2 | ||
| .951 | 95.8 | .637 | 56.6 | .818 | 42.6 | ||
| .999 | 88.5 | ||||||
The first aspect of the results to note is that the choice of dimension-reduction technique can alter radically the resulting view of the data, judged both quantitatively and qualitatively. The structure and relationship between clusters appears very differently in each view, resulting in very different performances of classification algorithms. The choice of dimension reduction technique clearly matters in visualising high dimensional data such as gene expression data.
The second aspect to note is that quantitative measures such as or classification performance are not a reliable indicator of visual class separation. For example, the view of the NCI data set generation using SLP has an extremely high index of .999, but there is clear visual confusion between most of the classes (Figure 10). The discrepancy is probably due to the large distance between two of the classes (Leukemia and Renal) and the others; which will increase the measured variance between classes, but with little corresponding improvement in visual separation. As another example, SLP produced a view of the SRBCT data set with tightly clustered and clearly separated classes compared with PRO, SAM, and PP, and yet there is little difference in the generalisation performance of the classifier on these views (Figure 7-Figure 9).
Overall, VizStruct performed least well in separating classes. Although the difference between VizStruct and the other techniques was least for the low- case (LEUK), the difference became more marked as the number of classes increased. This poor performance is unsurprising, since this technique is not explicitly designed to accentuate classifications (though see Zhang et al (2004)).
The Sammon mapping performed well in separating classes, but its output was marked by the curse of dimensionality : in high dimensional spaces, the variance in distances between randomly distributed points decreases. Sammon mapping attempts to preserve the distance between data points, and hence the resulting views tend to be evenly distributed, with little bunching of points belonging to a single class (Figure 9). Classification algorithms may succeed in ascribing points to classes – and hence the classification scores for SAM are similar to those for the linear mappings – but this may not be an accurate reflection of the perceived class seperation.
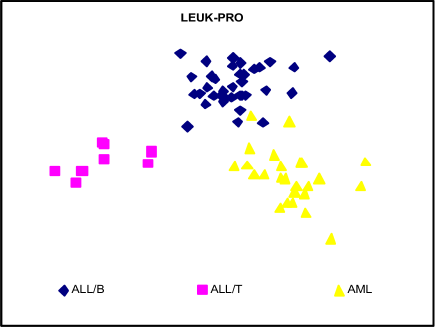
For the low- data sets (LEUK and SRBCT), SLP-based targeted projection pursuit was the most effective method at separating classes, both quantitatively and visually, and the Procrustes method performs as well as conventional search-based projection pursuit. There are also qualitative similarities between the views produced by PRO and PP: for LEUK, the members of the ALL class are more similar to AML/B than either class is to AML/T; for SRBCT, NB are more closely related to RMS than either are to BL or EWS.
For the high-, the conventional projection pursuit on a selected feature set outperformed either of the targeted methods; visually separating 4 classes compared to 2-3. In these cases there were also qualitative differences: PP most clearly distinguished leukemia, melanoma, and ovarian samples; Procrustes distinguished leukemia, breast, and colon samples; SLP distinguished leukemia and renal (Figure 10, Figure 11).
6.1 Hybrid Projection Pursuit
The targeted methods (SLP and PRO) performed relatively poorly in the higher- case (NCI), compared with their success on the lower-k cases (LEUK,SRBCT). This suggests that the drop in performance is due to the second stage of the two-stage reduction process, where PCA is used to reduce the dimensionality from -dimensional class space to the two-dimensional visualisation, rather than the reduction from the original gene-space to -dimensional class-space (see Figure 3).
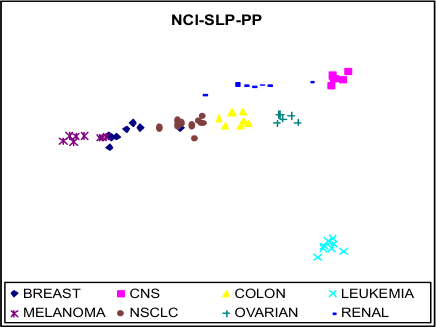
This hypothesis was tested by testing a hybrid dimension reduction technique, in which SLP was used to reduce the dimensionality to k and then search-based projection pursuit was used to find a two-dimensional view of the result (Figure 13). Note that the combined effect of this hybrid technique is still a linear projection of the original data. This technique (SLP-PP) was applied to the NCI data set and found to be highly effective with a clear visual separation between five of the classes and partial separation between remaining classes (Figure 12). Quantitatively, this hybrid had a better ILDA measure than either technique used alone. It thus seems that a limiting factor on search-based projection pursuit is the problem of searching a very large space using a stochastic technique, such as simulated annealing. Combining search-based projection pursuit with SLP reduces the size of the space for the former task from dimensions to in this case, and the increase in performance is marked.

7 Discussion
The high dimensionality of microarray data introduces the need for visualisation techniques that can ‘translate this data into lower dimensions without losing significant information, and hence assist with data interpretation. Many dimension reduction techniques are available, but in this paper we introduce the novel concept of targeted projection pursuit – that is, finding views of data that most closely approximate a given target view – and demonstrate the use of solutions of Procrustes equations and trained perceptron networks to achieve this end. In this particular case we explore the possibility of using targeted projection pursuit to find views that most clearly separate classified data sets.
Targeted projection pursuit was evaluated in comparison with three very different established dimension reduction techniques, on three publicly available data sets. The results are extremely encouraging. When discriminating a small number of cancer classes the performance of the technique matched or bettered that of established methods. When presented with a large number of classes (eight) the technique combined effectively with other existing techniques to produce near-optimal views of the data that could not be produced using any other means.
The technique is both simple to implement and powerful, scaling well to large numbers of genes. The version of the technique involving the targeted pursuit of orthogonal projections (PRO) is able to handle an input dimensionality of tens of thousands of genes without feature selection – a capability unique amongst those dimension reduction techniques tested. And informal trials suggest that the neural network-based version is able to handle an input dimensionality of many hundreds of genes without significant loss in performance and using commodity hardware.
Note that the use of a target view does not constitute a limitation of the technique. The target plays the role of a hypothesis – in this case that the samples can be classified based on gene expression levels – and the resulting views illustrates how well the data meets that hypothesis. (And by using a fully-symmetrical simplex as the target view, no assumptions about the relationships between classes are made.) Other hypothesis-targets could be used in other cases, such as using a circular target to explore cyclical process in samples from a time-series, or a rectilinear target to explore the existence of simple linear relations. The same classification visualisation technique employed here to classify samples in gene-space could also be applied to the transpose problem; that of visualising the classification of genes on the basis of their expression profiles in varying conditions, and so explore relationships between gene function rather than between samples.
Targeted projection pursuit is a general purpose technique for finding views of data that approximate optimal targets. This paper discussed just one specific application to the problem of visualising classified microarray data. The authors are currently exploring other applications in visualising high dimensional biological data, including constructing a tool that would allow a user to explore the space of possible views of high dimensional data sets in intuitive and effective ways.
8 Acknowledgement
Thanks to Paul Vickers for comments on a previous version of this paper.
References
- Cox et al, (2001) Cox, M.F., Cox, M.A.A. (2001) Multidimensional Scaling, Chapman and Hall.
- Dudoit et al, (2002) Dudoit, S., Fridlyand, J., and Speed, T. P. (2002) Comparison of discrimination methods for the classification of tumors using gene expression data. Journal of the American Statistical Association, Vol. 97, No. 457, p. 77-87.
- Eisen et al, (1998) Eisen,M.B., Spellman,P.T., Brown,P.O., and Botstein,D. (1998) Cluster analysis and display of genome-wide expression patterns, PNAS 95:25, 14863-14868
- Ewing et al, (2001) Ewing,R.M. and Cherry,J.M. (2001) Visualisation of expression clusters using Sammon’s non-linear mapping. Bioinformatics, 17,658-659.
- Golub et al, (1996) Golub,J. and Loan,C.F. (1996) Matrix Computations, Johns Hopkins Studies in the Mathematical Sciences, Johns Hopkins University Press.
- Golub et al, (1999) Golub,T.R., Slonim,D.K., Tamayo,P., Huard,C., Gaasenbeek,M., Mesirov,J.P., Coller,H., Loh,M.L., Downing,.J.R., Caligiuri,M.A., Bloomfield,C.D., Lander,E.S. (1999) Molecular classification of cancer: class discovery and class prediction by gene expression monitoring. Science,286(5439):531-7.
- Gower et al, (2004) Gower,J.C. and Dijksterhuis, G.B. (2004) Procrustes Problems, Oxford University Press
- Khan et al, (2001) Khan,J., Wei,J.S., Ringn r,M., Saal,L.H., Ladanyi,M., Westermann,F., Berthold,F., Schwab,M., Antonescu,C.R., Peterson,C., and Meltzer,P.S. (2001) Classification and diagnostic prediction of cancers using gene expression profiling and artificial neural networks. Nature Medicine, 7(6): 673–679.
- Lee et al, (2005) Lee,E.K, Cook,D., Klinke,S. and Lumley,T. (2005), Projection Pursuit for Exploratory Supervised Classification, Journal of Computational and Graphical Statistics, 14(4), 831-846
- Scherf et al, (2000) Scherf,U., Ross,D.T., Waltham,M., Smith,L.H., Lee,J.K., Tanabe,L., Kohn,K.W., Reinhold,W.C., Myers,T.G., Andrews,D.T., Scudiero,D.A., Eisen,M.B., Sausville,E.A., Pommier,Y., Botstein,D., Brown,P.O., and Weinstein,J.N. (2000) A Gene Expression Database for the Molecular Pharmacology of Cancer, Nature Genetics, 24(3), 236-244.
- Shen et al, (2006) Shen, L. and Tan, E. C. (2006) Reducing multiclass cancer classification to binary by output-coding and SVM, Computaional Biology and Chemistry, 30, 63-71.
- Witten et al, (2005) Witten,I.H. and Frank,E. (2005) Data Mining: Practical machine learning tools and techniques, 2nd Edition, Morgan Kaufmann, San Francisco, 2005.
- Zhang et al, (2004) Zhang,L., Zhang, A. and Ramanathan,M. (2004) VizStruct: exploratory visualisation for gene expression profiling, Bioinformatics, 20, 85-92.