Spectral density matrix of a single photon measured
Abstract
We propose and demonstrate a method for measuring the spectral density matrix of a single photon pulse. The method is based on registering Hong-Ou-Mandel interference between photon to be measured and a pair of attenuated and suitably delayed laser pulses described by a known spectral amplitude. The density matrix is retrieved from a two-dimensional interferogram of coincidence counts. The method has been implemented for a type-I downconversion source, pumped by ultrashort laser pulses. The experimental results agree well with a theoretical model which takes into account the temporal as well as spatial effects in the source.
I Introduction
Development of single photon sources brings the promise of implementing novel quantum-enhanced technologies. In many applications, including quantum computing based on linear optics QAppli photon sources are required not only to deliver single light quanta, but also to supply them in a well defined mode. This is a necessary condition for quantum interference between independent sources RiedmattenPRA03 which is required in the above schemes. Also observation of three and more photon interference effects puts stringent requirements on the sources XiangPRL06 . Besides, characterizing single photons is also interesting from the fundamental point of view. Historically photons were first described within the framework of quantum field theory (see BirulaPhWF for a review) but more recently it was pointed out that a photon wave function can be introduced BirulaPhWF ; SipePRA95 . This kind of description, generalized by the introduction of the density matrix constructed out of projectors on the states with specific wavefunctions, seems to be the most elegant and effective theoretical tool for developing quantum-enhanced technologies RhodeQPH06 .
Up till now measurements of polarization WhitePRL99 and spatial density matrix SmithOL05 of a single photon were reported. The temporal characteristics of single photons were assessed only by verifying whether they interfere with other sources RarirtyPTRSA97 ; PittmanQPH04 or between themselves HOM . In this Letter we propose and demonstrate a method for complete characterization of the temporal degree of freedom: a measurement of the spectral density matrix of a single photon. We show that the two-dimensional map of coincidence counts recorded as a function of delays between an unknown photon and a pair of weak reference pulses can be used to reconstruct the magnitude and the phase of the density matrix. We present a measurement for a type-I spontaneous down-conversion process in a bulk -barium borate (BBO) crystal, and compare the results of the reconstruction with theoretical predictions.
II Method
When a single photon is launched into a singlemode fiber, the situation is significantly simplified since the spatial mode is well defined. If moreover polarization of the photons is fixed, the only remaining degree of freedom is the spectral one. In this case a single photon component of the field can be described by the following density operator:
| (1) |
where is an operator annihilating photon of frequency in the fiber, while is a density matrix of a single photon given in the spectral domain.
Our method for measuring is based on the Hong-Ou-Mandel interference effect between the single photon to be characterized and a local oscillator (LO) pulse of known shape attenuated to a single photon level. The visibility of the two-photon interference dip is proportional to the overlap between the modes of interfering photons. Figuratively speaking, by modulating the local oscillator spectral amplitude and measuring the dip we can examine the single photon wavefunction from many directions. For a suitable class of LO pulses this suffices to retrieve the spectral density matrix of a single photon. In a broad sense, our experiment is a single photon analog of the homodyne method for measuring quantum correlations within a light pulse DoubleHomo . Indeed the density matrix describes correlations within a single photon pulse.
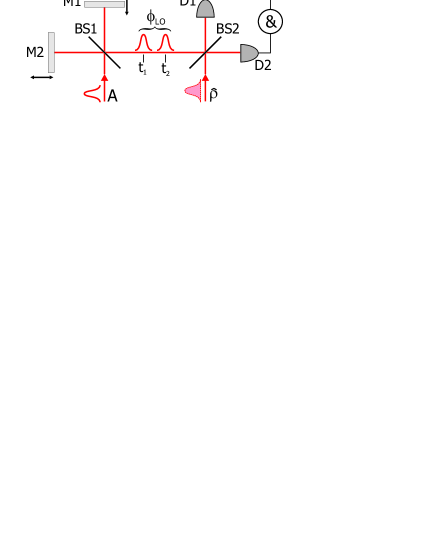
The method is presented in Fig. 1. The first part is a Michelson interferometer which serves as a LO pulse modulator. The second part is the beamsplitter on which the Hong-Ou-Mandel interference occurs. When a master laser pulse described by a spectral amplitude function enters the interferometer, it is split into two pulselets centered around delays and determined by the length of the arms in the interferometer. If both pulselets overlap, they interfere on the beamsplitter and depending on the precise value of their relative delay the input pulse energy is directed alternatively towards the output of the interferometer or back to the laser. The normalized spectral amplitude of local oscillator pulses prepared this way reads:
| (2) |
where is a normalizing function equal to the probability that a single photon will pass through the Michelson interferometer. The modulated LO pulses interfere with unknown single photons on a 50/50 beamsplitter BS2. If the master laser pulse contains a photon with probability , while the source produces photon described by spectral density matrix with probability per pulse, we can calculate the probability of registering coincidence with detectors of quantum efficiency to be RhodeQPH06 :
| (3) |
where we have assumed that each of the input states contains at most one photon and is an overlap between the local oscillator and the density matrix . We can partially evaluate using Eq. (2):
| (4) |
where stands for real part, while
| (5) |
is the inverse Fourier transform of a density matrix restriced to the spectral domain of the master laser pulses and is the function describing the standard Hong-Ou-Mandel interference dip. Inserting Eq. (4) into Eq. (3) yields:
| (6) |
where is a normalization factor combining the probabilities of detecting photon from the master laser and the source , as well as detector efficiency . At this point let us note that the density matrix is nonzero only near some point in the frequency space in case of narrowband photons, where is the central frequency of the single photons which we will assume to be equal to the central frequency of the master laser. Therefore oscillates like . Also contains such oscillations. On the other hand is a slowly varying function of its argument. Therefore individual components of the right hand side of Eq. (6) can be separated in the frequency domain. Let us apply the Fourier transform to both sides of Eq. (6) and rearrange terms:
| (7) |
where by dots we have denoted Fourier transform of and , while is the Fourier transform of coincidence counts. Additionally we used the fact that is the Fourier transform of .
In the experiment we can directly measure as a function of and . In the case of narrowband single photons retrieving of the spectral density matrix runs the following way: first Fourier transform of is computed. A region in the frequency space where contribution from and lies is separated. Next, a large contribution from is calculated and subsequently subtracted by measuring for large and where is zero. This way we obtain the Fourier transform of , which equals . It is divided by spectral amplitude of master laser pulses , which is measured separately and finally is found. Note that the last step is well defined only for single photons of bandwidth narrower than that of the master laser.
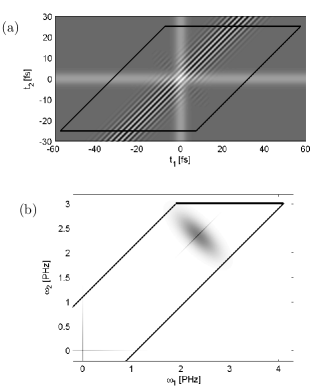
To illustrate the above dry formulas a typical coincidence pattern and its Fourier transform are depicted in Fig. 2. The diagonal fringes in Fig. 2(a) come from , the vertical and horizontal stripes from and while the most interesting term contributes only in the very center of the picture. It is easier identified in Fourier transform plot in Fig. 2(b) where a diagonal cloud corresponds to , and contribute a cross arround zero frequency while Fourier transform of is seen as a ridge along .
In the above derivations we have assumed interference between single photons. In our experiment, in fact we interfere a weak coherent state with a multimode thermal state. Whereas the visibility of such interference can be exactly calculated using the semiclassical theory RarirtyPTRSA97 , two photon terms of the coherent state and the thermal state contribute only towards a constant background of coincidence counts. However, the shape of the interference pattern does characterize the single photon component of the signal field. Its density matrix can still be retrieved in the way described above.
III Experiment and Results
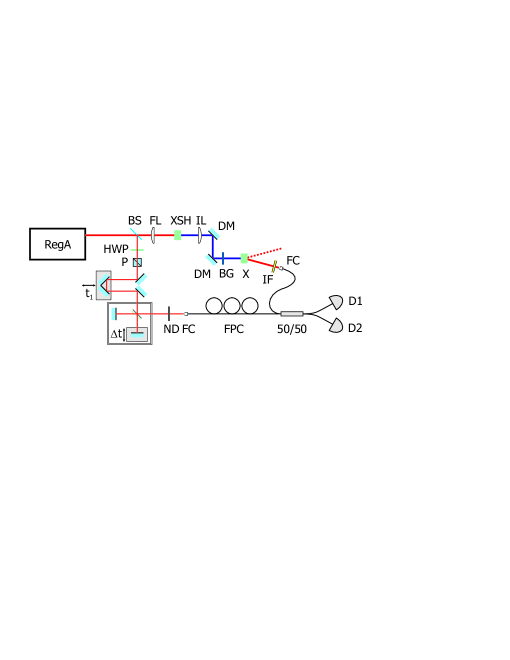
Our experimental setup is depicted in the Fig. 3. The master laser (RegA 9000 from Coherent) produces a train of 165 fs FWHM long pulses at a 300kHz repetition rate centered at 774 nm, of which we use 300 mW average power. Most of the energy goes to the second harmonic generator, based on a 1 mm thick BBO crystal cut for type-I process. Ultraviolet pulses produced this way have 1.3nm bandwidth and 30 mW average power. They are filtered out of fundamental using a pair of dichroic mirrors DM and a color glass filter BG (Shott BG39), and imaged using 20cm focal length lens IL on a downcoversion crystal X, where they form a spot measured to be 155 m in diameter. The crystal X is a 1 mm thick BBO crystal cut a to the optic axis, and oriented for maximum source intensity. A portion of down-converted light propagating at an angle of to the pump beam passes through a 10nm interference filter centered at 774.5nm and is coupled into a single mode fiber. This defines the spatial mode in which the down-conversion is observed Dragan (2004). About 4% of energy of master laser pulses is reflected towards an LO preparation arm. The pulses first go through a half wave plate HWP and a polarizer P allowing for fine control of the energy. Then they are delayed in a computer-controlled delay line. Next the pulses enter a Michelson interferometer in which one mirror moves on a precision computer controlled stage allowing for generation of double pulses with a well-defined temporal separation . Finally the double pulses are attenuated to contain less than 0.1 photon on average and coupled to a single mode fiber, where their polarization is adjusted using a fiber polarization controller FPC to match the polarization of the photon coming from the downconversion source. Both the downconversion and local oscillator photons interfere in a 50/50 singlemode fiber coupler and are detected using single photon counting modules SPCM (PerkinElmer SPCM-AQR-14-FC) connected to fast coincidence counting electronics (suitably programmed Virtex4 protype board ML403 from Xilinx) detecting events in coincidence with master laser pulses.
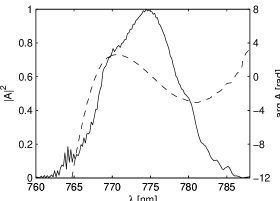
For calculating the actual density matrix of unknown single photons, a characterization of master laser pulses was necessary. This was accomplished using Frequency-Resolved Optical Gating (FROG) technique Trebino (1999). Retrieved spectral intensity and phase are plotted in Fig. 4. Precise knowledge of the master laser pulses allowed us also to calculate the second harmonic pulse using perturbative approach.
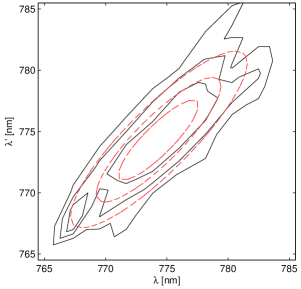
The complete measurement consisted in a series of 6 scans of a rectangular grid depicted in Fig. 2(a) spanned by 400025 points, where the latter number refers to the direction along the fringes. The corresponding mesh was 0.233 fs 66 fs, and coincidences were counted for 80 ms at each point. The reconstructed spectral density matrix of a single photon is depicted in Fig. 5. We compare it with theoretical calculations plotted with dashed lines in the same figure. The theoretical model used in these calculations assumed the exact phase matching function of the nonlinear crystal and the ultraviolet pump pulse shape computed from the measured . The transverse components of the wave vectors for the pump and down-converted beams were treated in the paraxial approximation. The spectral density matrix was calculated for coherent superpositions of plane-wave components of the down-conversion light that add up to localized spatial modes defined by the collecting optics and single-mode fiber. The other photon from the source, which remains undetected, was traced out assuming that it can propagate at any direction and have any frequency that is consistent with the conservation of energy and perpendicular momentum in the downconversion crystal. As seen in Fig. 5 the theoretical calculations predict more pronounced correlations i.e. smaller width along the antidiagonal than was actually measured. We attribute this discrepancy to a difference between the actual ultraviolet pump pulse shape and the one calculated from . Also the tips of the density matrix are measured with reduced accuracy, since in that regions the raw experimental result is divided by a relatively small master laser spectral intensity which amplifies errors. The theoretical model predicts the phase of the density matrix to be smaller than in the region bounded by the contour at 0.25 maximum. The measured phase in this region is smaller than and varies randomly from point to point.
IV Conclusions
In summary, we proposed and demonstrated a method for measuring the spectral density matrix of a single photon component of the electromagnetic field in a singlemode fiber. The method is based on two photon interference and is thus limited to the spectral range where known reference pulses are available, however it allows for retrieving both amplitude as well as phase of the density matrix. We have applied this method to a downconversion-based source of single photons and found that measured density matrix agrees with theoretical predictions.
We acknowledge insightful discussions with K. Banaszek. R. F. acknowledges discussions with M. Zieliński, M. Kowalski, S. Grzelak and D. Chaberski. This work has been supported by the Polish budget funds for scientific research projects in years 2006-2008, the European Commission under the Integrated Project Qubit Applications (QAP) funded by the IST directorate as Contract Number 015848 and AFOSR under grant number FA8655-06-1-3062. W.W. gratefully acknowledges the support of the Foundation for Polish Science (FNP) during this work. It has been carried out in the National Laboratory for Atomic, Molecular, and Optical Physics in Toruń, Poland.
References
- (1) E. Knill, R. Laflamme, G. J. Milburn, Nature 409, (2001); O’Brien et al., ibid., 426, 264 (2003); R. Prevadel et al., ibid., 445, 65 (2007); P. Kok et al., Rev. Mod. Phys. 79, 135 (2007).
- (2) H. de Riedmatten et al., Phys. Rev. A67, 022301 (2003).
- (3) G. Y. Xiang et al., Phys. Rev. Lett. 97, 023604 (2004).
- (4) I. Bialynicki-Birula, in Progress in Optics, edited by E. Wolf (Elsevier, Amsterdam, 1996), Vol. XXXVI;
- (5) J. E. Sipe, Phys. Rev. A 52, 1875 (1995).
- (6) P. P. Rohde, W. Mauerer, and C. Silberhorn, quant-ph/0609004.
- (7) A. G. White et al., Phys. Rev. Lett. 83, 3103 (1999).
- (8) B. Smith et al., Opt. Lett. 24, 3365 (2005).
- (9) T. Pittman, B. Jacobs, and J. Franson, quant-ph/0408093.
- (10) J. G. Rarity and P. R. Tapster, Phil. Trans. R. Soc. A 355, 2267 (1997).
- (11) C. Santori et al., Nature 419, 594 (2002); C. K. Hong, Z. Y. Ou, and L. Mandel, Phys. Rev. Lett. 59, 2044 (1987).
- (12) D. F. McAlister and M. G. Raymer, Phys. Rev. A 55, R1609 (1997); T. Opatrný, D.-G. Welsch, and W. Vogel, ibid., 55, 1416 (1997).
- Dragan (2004) A. Dragan, Phys. Rev. A 70, 053814 (2004); P. Kolenderski, W. Wasilewski, K. Banaszek, (in preparation).
- Trebino (1999) R. Trebino, Frequency-Resolved Optical Gating: The Measurement of Ultrashort Laser Pulses (Kluwer, 1999).