Present address:] CNISM and Dipartimento di Fisica, Università Roma Tre, Via della Vasca Navale 84, I-00146 Roma, Italy.
Present address:] Universität Duisburg–Essen, Institut für Experimentelle Physik, Lotharstraße 1, D-47057 Duisburg, Germany.
Present address:] Department of Physics and HKU-CAS Joint Lab on New Materials, The University of Hong Kong, Hong Kong, China.
Present address:] SPring-8, 1–1–1 Kouto, Sayo-cho, Sayo-gun, Hyogo 679-5198, Japan.
Present address:] Hiroshima Synchrotron Radiation Center, 2–313 Kagamiyama, Higashi-Hiroshima, 739-8526 Hiroshima, Japan.
Huge magneto-crystalline anisotropy of x-ray linear dichroism observed on Co/FeMn bilayers
Abstract
We present an x-ray spectromicroscopic investigation of single-crystalline magnetic FeMn/Co bilayers on Cu(001), using X-ray magnetic circular (XMCD) and linear (XMLD) dichroism at the Co and Fe absorption edges in combination with photoelectron emission microscopy (PEEM). Using the magnetic coupling between the ferromagnetic Co layer and the antiferromagnetic FeMn layer we are able to produce magnetic domains with two different crystallographic orientations of the magnetic easy axis within the same sample at the same time. We find a huge difference in the XMLD contrast between the two types of magnetic domains, which we discuss in terms of intrinsic magneto-crystalline anisotropy of XMLD of the Co layer. We also demonstrate that due to the high sensitivity of the method, the small number of induced ferromagnetic Fe moments at the FeMn–Co interface is sufficient to obtain magnetic contrast from XMLD in a metallic system.
pacs:
75.70.Ak, 68.37.-d, 75.50.EeI Introduction
The recent interest in the magnetic coupling between antiferromagnetic (AF) and ferromagnetic (FM) materials is motivated by the quest for fundamental insight into the phenomenon of exchange bias.Nogués and Schuller (1999) This effect, the discovery of which dates back to the 1950’s,Meiklejohn and Bean (1956) manifests itself in a shift of the magnetization curve along the field axis. Nowadays the exchange bias effect is employed in a variety of devices, such as sensors or hard disk read heads, based on magnetic thin films.Dieny et al. (1991); Kools (1996)
Only few methods can be used to study the spin structure of ultrathin antiferromagnetic films. While neutron diffraction and Mössbauer spectroscopy have been successfully employed to explore the spin structures of many bulk antiferromagnets already decades ago, both methods suffer from a lack of signal if films of a few atomic layers are to be investigated. X-ray magnetic linear dichroism (XMLD) in the soft x-ray absorption, on the other hand, is a method with sub-monolayer sensitivity. XMLD refers to the difference between x-ray absorption spectra for the plane of x-ray polarization aligned parallel and perpendicular to the atomic moments.van der Laan et al. (1986) By symmetry the XMLD signal does not depend on the orientation of magnetic moments but only on their axial alignment, and is thus suitable for the investigation of ferromagnetic as well as collinear antiferromagnetic spin structures, antiferromagnetic thin films in particular. Linear dichroic signal is also encountered in case of structural, not magnetic, reduction of the symmetry, as is commonly the case in the direction along the film normal due to the presence of interfaces.Haverkort et al. (2004); Arenholz et al. (2006) This can be eliminated if measurements are compared in which only the direction of the spin axis is varied, while the lattice geometry is fixed. In the following we will use the acronym “XMLD” for this situation only.
Unlike x-ray magnetic circular dichroism (XMCD), which in metallic systems essentially measures integral quantities, namely the spin and orbital magnetic moments, the size and shape of XMLD depend also on the details of the electronic structure. Although integral sum rules have been put forward for XMLD,van der Laan (1999) which relate the integral over the XMLD signal to the magneto-crystalline-anisotropy energy, this integral is usually much smaller than the amplitude of the plus–minus feature in the XMLD spectrum. Theoretical calculations predict that the latter may vary significantly with the crystallographic orientation of the magnetic moments.Kuneš and Oppeneer (2003) This is what we call the magneto-crystalline anisotropy of XMLD.
In this paper we study the magneto-crystalline anisotropy of XMLD of a thin Co layer. We use the AF–FM coupling between the FeMn and Co layers to manipulate the orientation of the Co moments, namely the observation that Co moments in a Co/FeMn bilayer align along directions when in contact with a magnetically disordered (paramagnetic) FeMn layer (above its Néel temperature), while they prefer directions when the FeMn layer magnetically orders (antiferromagnetic).Kuch et al. (2002a); Won et al. (2005) We take advantage of the fact that the Néel temperature depends on the thickness of the FeMn layer.Offi et al. (2002) Growing wedge-shaped samples we are thus able to study both - and -oriented domains at the same time.
We use a photoelectron emission microscope (PEEM), as described in Refs. Kuch et al., 1998, 2002b; Kotsugi et al., 2003 for the microscopic laterally resolved detection of the x-ray absorption cross section of the FeMn/Co bilayers. In combination with x-ray magnetic circular dichroism (XMCD) in the soft x-ray absorption as a magnetic contrast mechanism, PEEM is routinely used for the element-resolved observation of magnetic domain patterns in multilayered structures.Stöhr et al. (1993); Kuch et al. (1998); Kuch (2003) XMLD can equally serve as the magnetic contrast mechanism for PEEM if linearly polarized x-rays are used. Here, a combined XMCD and XMLD spectromicroscopic investigation of single-crystalline FeMn/Co bilayers on Cu(001) is presented. We find that the XMLD signal of the FM Co layer exhibits a strikingly different behavior when in contact with a paramagnetic and an antiferromagnetically ordered FeMn layer, while the XMCD contrast does not differ appreciably. We compare our observations to ab initio calculations of the XMLD in bulk fcc Co for different crystallographic orientations of the magnetic moments.
Investigation of the influence of spin and electronic structure on the XMLD requires single-crystalline samples with well characterized AF–FM interfaces. Because of the small lattice mismatch (0.4%),Endoh and Ishikawa (1971) Fe50Mn50 films (FeMn in the following) on a Cu(001) single crystal are ideal candidates for such investigations. Epitaxial, virtually unstrained FeMn films can be grown in a layer-by-layer mode by thermal deposition on Cu(001) at room temperature.Offi et al. (2002) This provides an opportunity to study the magnetic properties of an AF/FM system in single crystalline FeMn/Co and Co/FeMn bilayers on Cu(001).Offi et al. (2002); Kuch et al. (2002a); Offi et al. (2003) Scanning tunneling microscopy revealed atomically smooth interfaces with islands or vacancies of single atomic height.Kuch et al. (2004a) Based on XMCD-PEEM investigations of FM/FeMn/FM trilayers and on XMLD spectroscopy experiments of Co/FeMn bilayers, we concluded previously that a non-collinear three-dimensional spin structure is present in the ultrathin FeMn layers, possibly similar to the so-called spin structure present in bulk FeMn.Kuch et al. (2004b) Combination of the Kerr magnetometry and XMCD-PEEM imaging showed that the magnetic coupling across the interface is mediated by step edges of single atom height, while atomically flat areas do not contribute.Kuch et al. (2006)
II Experiment
All experiments were performed in-situ in an ultrahigh vacuum system with a base pressure below Pa. The disk-shaped Cu(001) single crystal was cleaned by cycles of 1 keV argon ion bombardment at 300 K and subsequent annealing at 873 K for 15 minutes. The surface exhibited a sharp low energy electron diffraction pattern. No contaminations were detectable by Auger electron spectroscopy (AES).
The films were grown by thermal evaporation on the clean substrate at room temperature in zero external magnetic field. Fe and Co were evaporated by electron bombardment of high purity wires (99.99% purity) of 2 mm diameter, while a rod (99.5% purity) of 4 mm diameter was used for Mn. FexMn1-x films of equiatomic composition () were obtained by simultaneous evaporation of Fe and Mn from two different sources. During the deposition the pressure in the chamber was kept below Pa. A typical evaporation rate was 1 ML per minute. The composition of the FeMn films was estimated from the evaporation rates of the two sources, determined by medium energy electron diffraction (MEED), and cross-checked by Auger electron spectroscopy peak ratios. No indication of segregation of Cu into or on top of the FeMn layers was found. The thickness of the films was determined by MEED, which shows pronounced layer-by-layer oscillations.Offi et al. (2002) The FeMn layer was grown in the form of small wedges of 200 m width, using the method described in Ref. Kuch et al., 2000.
The experiments were performed at the UE56/2-PGM1 helical undulator beamline of the Berlin synchrotron radiation facility BESSY, which can be set to deliver circularly polarized radiation of either helicity with a degree of circular polarization of about 80%, or linear vertical or horizontal polarization of .Weiss et al. (2001) The set-up of the electrostatic PEEM was identical to that described in Refs. Kuch et al., 1998, 2002b; Kotsugi et al., 2003. The light was incident at an angle of with respect to the sample surface. Rotation of the sample about the surface normal allowed to take images for different x-ray azimuthal angles of incidence. Parameters were set to a lateral resolution of 350 nm, and a field of view of 60 m.
The XMCD images represent a grayscale-coded absorption asymmetry for opposite helicities of the circularly polarized x-rays at the absorption maximum (777.5 eV),
| (1) |
i.e., the difference of absorption images acquired with opposite helicities divided by their sum. For the quantitative analysis, background images acquired at lower photon energy (5 eV below the maximum) were subtracted.
For XMLD, the maximum contrast was determined from a series of images acquired with 0.2 eV photon energy step around the maximum of the Co absorption peak of a 6 ML Co/Cu(001) film, using -polarized light. Maximum contrast was found between images taken at photon energies eV and eV. Since the acquisition time necessary to observe XMLD contrast at the Fe edge in FeMn/Co/Cu(001) bilayers was of the order of hours, no such photon energy sweeps were undertaken for the Fe edge (maximum at 707.5 eV); instead, the same relative photon energies as determined for the Co edge were tentatively used ( eV and eV). Images at the two photon energies were taken using and polarized x-rays. Because of the incidence, XMLD from in-plane magnetization is larger by a factor of for polarized excitation. Taking into account the opposite sign of the effect for the two polarizations we used the following formula for the XMLD contrast
| (2) |
The images thus reproduce quantitatively the difference between images taken at the higher photon energy minus images taken at the lower photon energy for polarized x-rays, divided by the sum of these images.
III Results and discussion
This section is divided into three parts. First, we demonstrate the performance of the spectromicroscopic domain imaging and present the contrast obtained on the edges of Co, Fe and Mn. Next, we study the dependence of the XMCD and XMLD contrast at the Co edge on the azimuthal angle of incidence. Finally, we discuss the quantitative difference between the XMLD signal obtained from and domains.
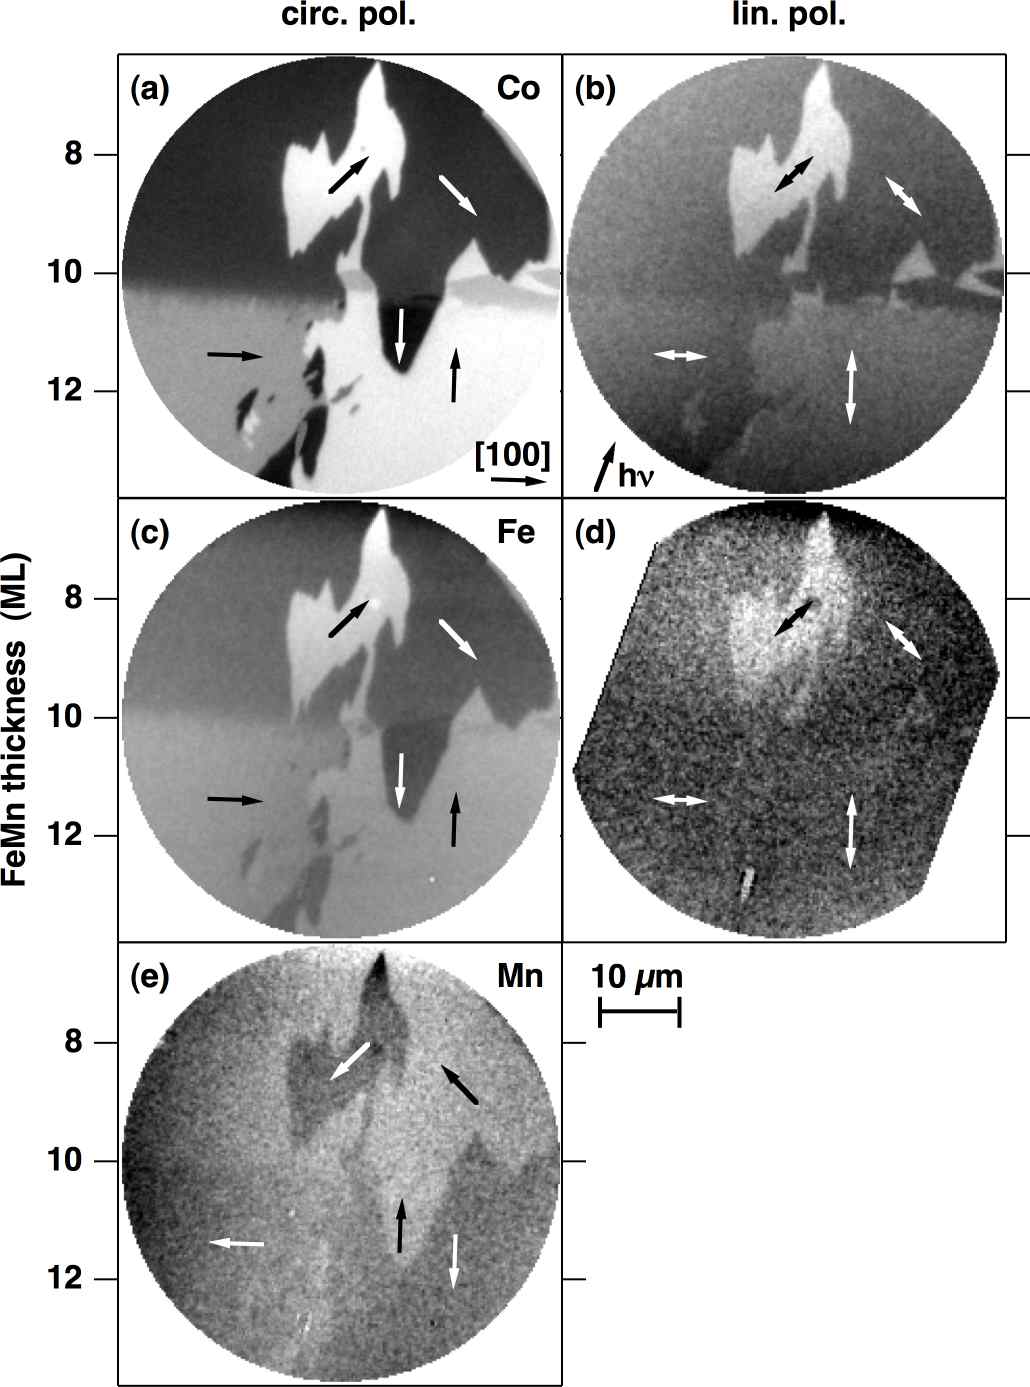
In Fig. 1 typical XMCD and XMLD images obtained at the edge of Co are shown together with those obtained at the edges of Fe and Mn. A wedge-shaped FeMn/12 ML Co bilayer was used. The Co XMCD image (a) shows micron-sized magnetic domains. While the domain magnetization lies along directions in the upper half of the image, only domains with magnetization along can be seen the lower half. This behavior was observed previously,Kuch et al. (2002a); Won et al. (2005) and is related to the fact that for less than about 10 ML FeMn thickness is paramagnetic at room temperature, while thicker FeMn layers develop AF order.Offi et al. (2002)
Identical domain patterns with strongly reduced XMCD contrast are observed at the Fe (c) and Mn (e) edges. The contrast arises due to the induced moments in the FeMn layer.Offi et al. (2003) The Mn image is a negative of the Fe and Co images, indicative of an antiparallel orientation of the Mn moments with respect to the magnetization direction of the FM Co layer.
Images of the same spot obtained with XMLD as magnetic contrast mechanism are shown in the right column of Fig. 1. The magnetic domain pattern is clearly visible at the Co edge (b). Note that domains with opposite magnetization direction cannot be distinguished by XMLD (compare the right lower parts of images (a) and (b)). The XMLD contrast at the Fe edge is much weaker than at the Co edge. Only after averaging over images with about 170 minutes total acquisition time we were able to recognize at least the magnetic domains in the top part of the image.
The images of Fig. 1 are presented on quite different grayscale ranges: While the full contrast from saturated white to saturated black in the Co XMCD image (a) is 20%, it is amplified to 8% for the Fe (c) and 1.5% for Mn (e) XMCD images, and amounts to 3% in the Co XMLD image (b), and only 0.7% in the Fe XMLD image (d).
Our previously published XMLD spectra,Kuch et al. (2004b) in which the XMLD signal at the Fe edge is below the noise level, supported a non-collinear antiferromagnetic arrangement of Fe spins in the AF FeMn layer. In this case only the small induced ferromagnetic moment in the FeMn layer, the XMCD signal of which corresponds to about 30% of the Fe atoms in the interface atomic layer,Offi et al. (2003) leads to an XMLD signal. Although XMLD has been successfully applied in the past to image antiferromagnetic domains in PEEM,Stöhr et al. (1999); Scholl et al. (2000); Nolting et al. (2000); Ohldag et al. (2001) no attempt was made on metallic antiferromagnets, and it is commonly believed that the reduced crystal field splitting of the electronic states in metalsSchwickert et al. (1998); Dhesi et al. (2002); Kuneš and Oppeneer (2003) is prohibiting the use of XMLD for magnetic imaging. Fig. 1 (d), however, shows that it is possible to image the XMLD signal, even of the comparably low number of the induced moments, by PEEM.
Quantitative estimates support the interpretation of the contrast observed in Fig. 1 (d): In the top part of the image, the Fe XMLD is about a factor of 6 weaker than the Co XMLD at the same position. This is about the same ratio as between the respective XMCD contrasts in panels (a) and (c) at about 6 ML FeMn thickness. This size of induced ferromagnetic alignment is consistent with our earlier investigation of FeMn/Co bilayers.Offi et al. (2003) Furthermore, the Fe XMLD originating from induced moments at the interface decreases with increasing total FeMn thickness, so that the expected Fe XMLD signal would be within the noise of the measurement of the spectra of Ref. Kuch et al., 2004b, which were taken for a 15 ML FeMn film.
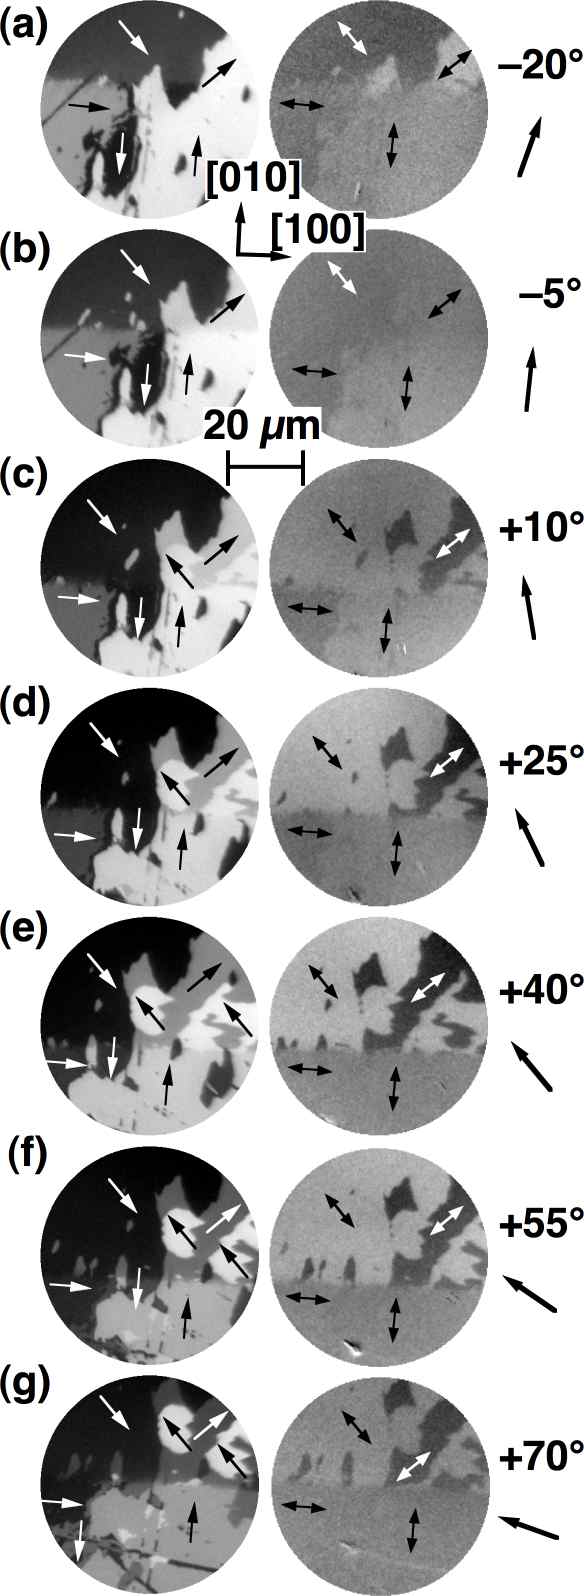
Fig. 2 shows a series of magnetic domain images of the Co layer from a sample in which a 0–25 ML wedge of FeMn was deposited on top of a continuous film of 6 ML Co/Cu(001). The left column shows the XMCD contrast at the Co absorption maximum. The right column shows images of the same spot of the sample, acquired with linear polarization of the x-rays. As in Fig. 1, the FeMn thickness increases from the top to the bottom of the images. Panels (a) through (g) show images obtained for different azimuthal angles of incidence, indicated by an arrow at the right hand side of each panel. Note that the field of view slightly shifted due to readjustment of the sample. The azimuth angle was read from a dial at the sample holder with an accuracy of . corresponds to the nominal [010] direction of the Cu substrate; however, as will be outlined below, the angular dependence of the magnetic contrast indicates that the real [010] direction was at azimuth angle. This deviation from the nominal direction is within the accuracy with which the substrate could be oriented upon mounting to the sample holder.
The data have been taken in the sequence from (a) to (g). Typical acquisition times were 4 minutes per helicity for the circular polarization, and 20 minutes per polarization direction and photon energy for the linear polarization. Including the necessary sample manipulations, the time to obtain the data of Fig. 2 totalled 28 hours. The time evolution of the domain pattern is clearly visible in the (a)–(g) series from the shift of the transition line between paramagnetic and antiferromagnetic FeMn towards higher thicknesses. We attribute this to progressing contamination and possibly oxidation by residual gas of the surface of the FeMn layer. The Co layer, however, which is investigated here, is protected against contamination by the FeMn overlayer.
The right column of Fig. 2 shows images taken with linear x-ray polarization. The upper parts of the images clearly reveal identical domain pattern as seen with XMCD. The behavior of the XMLD contrast follows the geometric expectations including the reversal of contrast between panels (a) and (c), and near vanishing of the contrast in panel (b) for the azimuthal angle of incidence close to with respect to the magnetization. The most prominent observation, and the main result of this work, is the strong suppression of the XMLD contrast visible in the bottom parts of the images which correspond to domains with direction of magnetization.

In the following we discuss the angular dependence of XMCD and XMLD contrast in detail. In Fig. 3 we show the Co XMCD contrast as a function of the azimuthal angle of incidence obtained from the data of Fig. 2. Fig. 3 (a) shows the contrast of the domains in the upper part of the images, where the FeMn is paramagnetic and Co domains are magnetized along directions. Panel (b) presents the contrast from the lower part of the images, where the FeMn is antiferromagnetic and Co domains align along directions. The lines correspond to a sine fit. The fit reveals a phase shift, which can be attributed to the inaccuracy of the sample mounting. The angular dependence of the XMCD contrast of the individual domains confirms very nicely the assignment of magnetization directions in Fig. 2. A small vertical offset may be attributed to instrumental asymmetries, as for example different intensities of the two helicities. Importantly, the amplitude of the XMCD contrast is only about 5% lower in panel (b) than in panel (a). The latter is equal to the contrast of Co domains in a Co/Cu(001) reference sample without FeMn layer, which is indicated in Fig. 3 (a) by crosses at incidence azimuth.

Fig. 4 shows the angular dependence of the Co XMLD contrast from data of Fig. 2. Solid and open symbols represent the contrast between domains with mutually perpendicular magnetization direction in the regions where the FeMn layer is paramagnetic and antiferromagnetic, respectively. The solid lines are the result of sine fits for which the phases were fixed at and , respectively, using the result of the fits of Fig. 3. Again, the data confirm the assignment of the magnetization axes in Fig. 2. Based on the fits we are able to quantify the suppression of the XMLD contrast in domains as compared to the domains to be a factor of 0.28. Such a large effect of magnetization direction on any physical quantity is rather unusual in metals, which exhibit only a weak spin–orbit coupling. In order to prove that we see a genuine magneto-crystalline anisotropy we next discuss the role of spin non-collinearity and make comparison to other experimental data and theoretical calculations.

Besides changing the easy axis direction in the Co layer, magnetic ordering of the FeMn may also induce a small non-collinearity of the Co moments. Such a non-collinear fanning out of the FM moments in Fe/MnF2 bilayers as a consequence of the AF–FM coupling was recently suggested on the basis of Mössbauer spectroscopy.Macedo et al. (2004) We consider now if a similar scenario can explain our XMLD data. A distribution of the Co spins around a mean direction would lead to a reduction of both the XMCD and XMLD signals compared to the fully aligned case. While the reduction of the XMCD signal is proportional to the reduction of the net moment, XMLD, due to its different angular dependence, is more sensitive and depends also on the distribution of the fanning angles. In the extreme case of moments oriented at with respect to the net magnetization, the XMLD would be reduced to zero, while the XMCD would still be at 71% of its maximum value. Using the reduction factor of 0.95 of the net magnetization, obtained from XMCD contrast, and assuming both binary (moments point at a fixed angle on either side of the net magnetization) and normal distributions (Gaussian distribution of angles) of the fanning angle we arrive at a reduction factor of about 0.81 for the XMLD contrast. Therefore fanning of the Co moments due to the interaction with the FeMn layer, if at all present, can explain only a small fraction of the observed effect, which amounts to the reduction factor of 0.28.

Since the stability of the instrument is not sufficient to acquire series of microspectroscopic images for different photon energies, we use published data to compare experimental Co XMLD spectra for magnetization along and directions. The data are taken from Ref. Kuch et al., 2004b, in which a 15 ML FeMn/6 ML Co bilayer on Cu(001) was measured. The spectra for Co magnetized along direction are taken from the work of Dhesi et al., in which 6 ML Co on Cu(001), miscut by , was measured.Dhesi et al. (2002) The two spectra at the Co edge, rescaled to the same absorption maximum and shifted to the common position of the absorption edge, are compared in Fig. 5. Both spectra had been measured under similar conditions.foo (a) Note that the peak-to-peak ratio of the XMLD spectra of Fig. 5 (b) cannot be compared directly to the ratio of the XMLD asymmetry magnitudes of Fig. 4, which corresponds to the contrast between XMLD signal at the energies marked by arrows in Fig. 5.foo (b) Although smaller than the asymmetry anisotropy of 3.6 from Fig. 4, the ratio of peak-to-peak XMLD of 2.3 between the two curves obtained from Fig. 5 still indicates substantial magneto-crystalline anisotropy of the XMLD signal.
As mentioned in the Introduction, such a large anisotropy is unusual in metals since the spin–orbit coupling is rather weak, e.g. the calculated magneto-crystalline anisotropy energy in bulk fcc Co is only 2 eV per atom. Trygg et al. (1995) Also the XMCD spectrum, which depends essentially only on integral quantities, namely spin and orbital moments, exhibits a very small anisotropy.Kuneš and Oppeneer (2003) As pointed out by one of us and P. M. Oppeneer, the XMLD signal in metallic Co depends only weakly on the small valence band spin-orbit coupling. The major contribution to XMLD comes from the exchange splitting of the levels ( eV).Kuneš and Oppeneer (2003) The magneto-crystalline anisotropy then arises from the fact that different final states are probed for different orientations of the sample magnetization.
To assess the feasibility of our experimental data, we used the calculated XMLD spectrum of Ref. Kuneš and Oppeneer, 2003 for the [100] direction (what is referred to in Ref. Kuneš and Oppeneer, 2003 as “full calculation”) and augmented these with equal calculations for the [110] magnetization on the same system (see Fig. 6). In the calculations performed on bulk fcc Co a sizable anisotropy of XMLD is found, however, the [100] exhibits larger XMLD magnitude contrary to the experiment. Before dismissing these results as a disagreement a few remarks are in order. First, the calculations were done on bulk material while the experiment is performed on a thin layer sandwiched by other materials, therefore a good quantitative agreement is unlikely. Second, we cannot judge the calculated anisotropy based on the present data only. Note that due to a slight mutual shift of the calculated spectra, the [100] contrast at the maximum amplitude of the [110] XMLD would be rather small. Such a shift is not present in Fig. 5, where [100] and [110] spectra obtained on slightly different samples are compared. Third, a possible non-collinearity of Co spins due to the presence of the AF FeMn layer would lead to local moments pointing neither along [110] nor fully along [100]. Taking these uncertainties into account we draw a modest, nevertheless non-trivial, conclusion that the theory does not prohibit a magneto-crystalline anisotropy of XMLD as large as observed in our experiment.
IV Conclusions
We have presented a spectromicroscopic PEEM investigation of the magnetic domain pattern on Co/FeMn bilayers using XMCD and XMLD as the contrast mechanism. The sensitivity of the method allows to visualize even the tiny XMLD signal of the induced ferromagnetic moments in the FeMn layer. We have found a factor of 3.6 difference in the XMLD contrast between the Co signal from and domains in a single sample. We argue that this huge difference is mainly due to an intrinsic magneto-crystalline anisotropy of XMLD of the Co layer. Comparison of experimental XMLD spectra obtained from different samples published previously and ab initio calculations on bulk fcc Co suggest that such an anisotropy is indeed possible.
Acknowledgements.
We thank B. Zada and W. Mahler for technical assistance, and S. S. Dhesi for providing the data from Ref. Dhesi et al., 2002. Financial support by the German Minister for Education and Research (BMBF) under grant No. 05 SL8EF19 is gratefully acknowledged. J. K. acknowledges the support by an Alexander von Humboldt Research Fellowship.References
- Nogués and Schuller (1999) J. Nogués and I. K. Schuller, J. Magn. Magn. Mater. 192, 203 (1999).
- Meiklejohn and Bean (1956) W. H. Meiklejohn and C. P. Bean, Phys. Rev. 102, 1413 (1956).
- Dieny et al. (1991) B. Dieny, V. S. Speriosu, S. S. P. Parkin, B. A. Gurney, D. R. Wilhoit, and D. Mauri, Phys. Rev. B 43, 1297 (1991).
- Kools (1996) J. C. S. Kools, IEEE Trans. Magn. 32, 3165 (1996).
- van der Laan et al. (1986) G. van der Laan, B. T. Thole, G. A. Sawatzky, J. B. Goedkoop, J. C. Fuggle, J.-M. Esteva, R. Karnatak, J. P. Remeika, and H. A. Dabkowska, Phys. Rev. B 34, 6529 (1986).
- Haverkort et al. (2004) M. W. Haverkort, S. I. Csiszar, Z. Hu, S. Altieri, A. Tanaka, H. H. Hsieh, H.-J. Lin, C. T. Chen, T. Hibma, and L. H. Tjeng, Phys. Rev. B 69, 020408(R) (2004).
- Arenholz et al. (2006) E. Arenholz, G. van der Laan, R. V. Chopdekar, and Y. Suzuki, Phys. Rev. B 74, 094407 (2006).
- van der Laan (1999) G. van der Laan, Phys. Rev. Lett. 82, 640 (1999).
- Kuneš and Oppeneer (2003) J. Kuneš and P. M. Oppeneer, Phys. Rev. B 67, 024431 (2003).
- Kuch et al. (2002a) W. Kuch, F. Offi, L. I. Chelaru, M. Kotsugi, K. Fukumoto, and J. Kirschner, Phys. Rev. B 65, 140408(R) (2002a).
- Won et al. (2005) C. Won, Y. Z. Wu, H. W. Zhao, A. Scholl, A. Doran, W. Kim, T. L. Owens, X. F. Jin, and Z. Q. Qiu, Phys. Rev. B 71, 024406 (2005).
- Offi et al. (2002) F. Offi, W. Kuch, and J. Kirschner, Phys. Rev. B 66, 064419 (2002).
- Kuch et al. (1998) W. Kuch, R. Frömter, J. Gilles, D. Hartmann, C. Ziethen, C. M. Schneider, G. Schönhense, W. Swiech, and J. Kirschner, Surf. Rev. Lett. 5, 1241 (1998).
- Kuch et al. (2002b) W. Kuch, L. I. Chelaru, F. Offi, M. Kotsugi, and J. Kirschner, J. Vac. Sci. Technol. B 20, 2543 (2002b).
- Kotsugi et al. (2003) M. Kotsugi, W. Kuch, F. Offi, L. I. Chelaru, and J. Kirschner, Rev. Sci. Instrum. 74, 2754 (2003).
- Stöhr et al. (1993) J. Stöhr, Y. Wu, B. D. Hermsmeier, M. G. Samant, G. R. Harp, S. Koranda, D. Dunham, and B. P. Tonner, Science 259, 658 (1993).
- Kuch (2003) W. Kuch, Appl. Phys. A 76, 665 (2003).
- Endoh and Ishikawa (1971) Y. Endoh and Y. Ishikawa, J. Phys. Soc. Jpn. 30, 1614 (1971).
- Offi et al. (2003) F. Offi, W. Kuch, L. I. Chelaru, K. Fukumoto, M. Kotsugi, and J. Kirschner, Phys. Rev. B 67, 094419 (2003).
- Kuch et al. (2004a) W. Kuch, L. I. Chelaru, and J. Kirschner, Surf. Sci. 566–568, 221 (2004a).
- Kuch et al. (2004b) W. Kuch, L. I. Chelaru, F. Offi, J. Wang, M. Kotsugi, and J. Kirschner, Phys. Rev. Lett. 92, 017201 (2004b).
- Kuch et al. (2006) W. Kuch, L. I. Chelaru, F. Offi, J. Wang, M. Kotsugi, and J. Kirschner, Nature Mater. 5, 128 (2006).
- Kuch et al. (2000) W. Kuch, J. Gilles, F. Offi, S. S. Kang, S. Imada, S. Suga, and J. Kirschner, J. Electron Spectrosc. Relat. Phenom. 109, 249 (2000).
- Weiss et al. (2001) M. R. Weiss, R. Follath, K. J. S. Sawhney, F. Senf, J. Bahrdt, W. Frentrup, A. Gaupp, S. Sasaki, M. Scheer, H.-C. Mertins, et al., Nucl. Instr. and Meth. A 467–468, 449 (2001).
- Stöhr et al. (1999) J. Stöhr, A. Scholl, T. J. Regan, S. Anders, J. Lüning, M. R. Scheinfein, H. A. Padmore, and R. L. White, Phys. Rev. Lett. 83, 1862 (1999).
- Scholl et al. (2000) A. Scholl, J. Stöhr, J. Lüning, J. W. Seo, J. Fompeyrine, H. Siegwart, J.-P. Locquet, F. Nolting, S. Anders, E. E. Fullerton, et al., Science 287, 1014 (2000).
- Nolting et al. (2000) F. Nolting, A. Scholl, J. Stöhr, J. W. Seo, J. Fompeyrine, H. Siegwart, J.-P. Locquet, S. Anders, J. Lüning, E. E. Fullerton, et al., Nature 405, 767 (2000).
- Ohldag et al. (2001) H. Ohldag, A. Scholl, F. Nolting, S. Anders, F. U. Hillebrecht, and J. Stöhr, Phys. Rev. Lett. 86, 2878 (2001).
- Schwickert et al. (1998) M. M. Schwickert, G. Y. Guo, M. A. Tomaz, W. L. O’Brien, and G. R. Harp, Phys. Rev. B 58, R4289 (1998).
- Dhesi et al. (2002) S. S. Dhesi, G. van der Laan, and E. Dudzik, Appl. Phys. Lett. 80, 1613 (2002).
- Macedo et al. (2004) W. A. A. Macedo, B. Sahoo, V. Kuncser, J. Eisenmenger, I. Felner, J. Nogués, K. Liu, W. Keune, and I. K. Schuller, Phys. Rev. B 70, 224414 (2004).
- foo (a) Normal incidence, room temperature, degree of linear polarization 95% (Ref. Dhesi et al., 2002), (Ref. Kuch et al., 2004b), photon energy resolution 400 meV (Ref. Dhesi et al., 2002), 300 meV (Ref. Kuch et al., 2004b), measured under 7 T magnetic field (Ref. Dhesi et al., 2002) and in remanence (Ref. Kuch et al., 2004b).
- foo (b) The left axis of Fig. 4 gives the difference of the raw XMLD asymmetry between the two orthogonal domains. To compare to the spectra of Figs. 6 and 5, one has to keep in mind that the intensity at these two photon energies, in particular the one 1.0 eV below the peak maximum, is less than the intensity in the peak maximum. In the case of Co the average intensity of the denominator of the asymmetry is about 75% of the peak maximum. Because the difference was normalized to the sum, this has to be doubled and gives a factor of 1.5. The pre-edge background, which is included here, has also to be taken into account. From images acquired in the Co pre-edge region it was determined to make up for about 35% of the intensity measured at the maximum. This leads roughly to another factor of 1.7. An asymmetry value of 0.017 in Fig. 4 (the amplitude of the fit curve for magnetization) thus corresponds to a peak-to-peak amplitude of the linear dichroism of about 4.3% of the peak height. The curve of Dhesi et al., for comparison, shows a peak-to-peak dichroism of 5.3% of the peak height.
- Trygg et al. (1995) J. Trygg, B. Johansson, O. Eriksson, and J. M. Wills, Phys. Rev. Lett. 75, 2871 (1995).