SUPER–STAR CLUSTER VELOCITY DISPERSIONS AND VIRIAL MASSES IN THE M82 NUCLEAR STARBURST11affiliation: Based on observations made at the W.M. Keck Observatory, which is operated as a scientific partnership among the California Institute of Technology, the University of California and the National Aeronautics and Space Administration. The Observatory was made possible by the generous financial support of the W.M. Keck Foundation.
Abstract
We use high-resolution near-infrared spectroscopy from Keck Observatory to measure the stellar velocity dispersions of 19 super star clusters (SSCs) in the nuclear starburst of M82. The clusters have ages on the order of 10 Myr, which is many times longer than the crossing times implied by their velocity dispersions and radii. We therefore apply the Virial Theorem to derive the kinematic mass for 15 of the SSCs. The SSCs have masses of to M, with a total population mass of M. Comparison of the loci of the young M82 SSCs and old Milky Way globular clusters in a plot of radius versus velocity dispersion suggests that the SSCs are a population of potential globular clusters. We present the mass function for the SSCs, and find a power law fit with an index of . This result is nearly identical to the mass function of young SSCs in the Antennae galaxies.
Subject headings:
galaxies: individual (M82) — galaxies: starburst — galaxies: star clusters — infrared: galaxies1. Introduction
1.1. Starburst Galaxies and Super Star Clusters
Short-duration episodes of intense star formation known as “starbursts” are responsible for a significant portion of star formation activity in the present-day Universe. Heckman (1998) estimates that the four most luminous circumnuclear starbursts (M82, NGC 253, M83 and NGC 4945) account for 25 percent of the high-mass ( 8 M) star formation within 10 Mpc. The starburst phenomenon is the present-day manifestation of the dominant mode of star formation in the early Universe (Leitherer, 2001). At , high-mass stars form predominantly in dense clusters and OB associations (Miller & Scalo, 1978). Massive stellar clusters in nearby starburst galaxies thus provide a laboratory for studying intense star formation and related feedback processes, as well as physical conditions analogous to high-redshift star formation.
Star formation in starbursts is resolved into young, dense, massive “super–star clusters” (SSCs) that represent a substantial fraction of new stars formed in a burst event (Meurer et al., 1995; Zepf et al., 1999). Hubble Space Telescope (HST) observations with WFPC/WFPC2 in visible light (e.g., O’Connell et al., 1994; Whitmore & Schweizer, 1995) have resolved SSCs in the nearest starburst galaxies, and SSCs appear ubiquitous in mergers and interacting galaxies. Of the roughly 30 gas-rich mergers observed by HST, all have young, massive, compact clusters (Whitmore, 2001, and refs.). A spectacular example is the “Antennae” galaxies, NGC 4038/4039, with more than optically-visible SSCs (Whitmore et al., 1999) and many other clusters deeply embedded in dust (Gilbert et al., 2000).
The derived masses, radii and ages of SSCs suggest that they are young globular clusters, and the brightest and most massive may evolve into a population of globular clusters similar to that of the Milky Way. The question of whether SSCs are in fact the progenitors of globular clusters depends critically on their masses and their content of low-mass stars in particular (Meurer et al., 1995). If the stellar initial mass function (IMF) within the clusters is biased toward high-mass stars (or “top heavy”), for example by suppression of low mass star formation, the clusters may not survive the disruptive nature of mass loss resulting from both stellar evolution and dynamical processes (e.g. Chernoff & Weinberg, 1990; Takahashi & Portegies Zwart, 2000).
Local analogues of SSCs — massive, dense young clusters in the Galaxy and Large Magellanic Cloud — contain substantial populations of low-mass stars. The central ionizing star cluster in NGC 3603, the most massive H II region in the Galaxy, has 2000 Min OB stars alone. Brandl et al. (1999) find that the mass spectrum of the cluster is “well populated” down to 0.1 M. The cluster R136 at the center of the 30 Doradus nebula in the Large Magellanic Cloud is considered the closest example of a starburst region (Brandl et al., 1996). In addition to OB stars, some with masses in excess of 100 M, Sirianni et al. (2000) find a “substantial population” of low-mass stars down to masses of 0.6 Min R136. With a cluster mass of M(Walborn et al., 2002), R136 is at the lower end of the SSC mass range.
1.2. Mass Estimates
Most mass estimates to date for SSCs beyond the Local Group are “photometric masses.” This technique involves measuring the luminosity and broadband color of a cluster, and comparing the results to the predictions of spectral synthesis models. Examples include optical studies of clusters in the Antennae galaxies (Whitmore, 2000, and refs.) and the nuclear cluster in IC 4449 (Böker et al., 2001). The resulting values are highly dependent on the assumed IMF, age estimates and theoretical stellar evolution models. Consequently, the photometric method provides only very weak constraints on the IMF in a cluster. The question of how SSCs evolve or whether they can survive to become globular clusters cannot be directly addressed with confidence by photometry alone.
Recently, however, several studies have obtained kinematic masses for SSCs in starbursts directly from observations of stellar velocity dispersions. Ho & Filippenko (1996b) use high-resolution optical spectra to measure the velocity dispersion of an SSC in the nearby amorphous galaxy NGC 1705. They derive a cluster mass of M. The dwarf starburst galaxy NGC 1569 contains two prominent SSCs. Ho & Filippenko (1996a) used optical spectroscopy to determine the velocity dispersion and derive a mass of Mfor SSC-A. Gilbert (2002) uses near-IR spectroscopy to identify two separate velocity components along the line of sight at the position of SSC-A, and finds masses of Mfor cluster A1 and Mfor cluster A2. Gilbert also finds a velocity dispersion for SSC-B and derives a mass of M. Mengel et al. (2002) use high-resolution optical and near-IR spectroscopy to measure the velocity dispersions of six of the brightest clusters in the merging Antennae galaxies. They derive mass estimates ranging from to M.
In addition to these clusters in starburst galaxies, the kinematic approach has been applied to several young, massive clusters in more quiescent galaxies. Böker et al. (1999) uses near-IR spectra to derive a mass of Mfor the nuclear star cluster in the giant spiral IC 342. Larsen et al. (2004) derives virial masses for two SSCs in the dwarf irregular NGC 4214 and two SSCs in NGC 4449 based on optical spectra, and one young SSC in the nearby spiral NGC 6946 based on near-IR spectra. Clusters in the Larsen study have masses between and M, typical of SSCs.
Mass estimates based on measured velocity dispersions are nearly independent of theoretical models, relying on simple application of the virial theorem. Armed with the virial mass, one can derive the light-to-mass ratio of an SSC, which may be compared to predictions of population synthesis models to constrain the cluster’s IMF. Critical to understanding the IMF is detection of low-mass stars, the light of which is swamped by high luminosity supergiants. Measurement of the kinematic mass provides the only means of detecting and quantifying the low-mass stellar population of a cluster based on its integrated light.
1.3. Messier 82
M82 (NGC 3034) provides a useful laboratory. As one of the nearest starburst galaxies at 3.6 Mpc (Freedman et al., 1994), M82 presents an obvious resolution advantage: star-forming regions can be studied on small spatial scales ( pc) and individual SSCs are resolved by HST. The galaxy’s high inclination of 81∘ (Achtermann & Lacy, 1995) and prevalent dust lead to large, patchy extinction; infrared observations are required to overcome this obstacle in characterizing the SSC population.
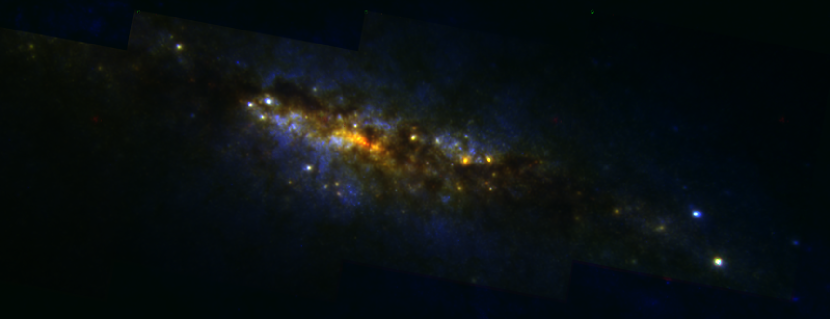
The light of red supergiant stars (RSGs) dominates the near-IR continuum throughout the galaxy’s starburst core. Satyapal et al. (1997) interpret the compact sources along the plane of M82 as young star clusters, the space density of which increase towards the nucleus. The smooth component of the near-IR emission is itself likely the integrated contribution from unresolved clusters of RSGs (Förster Schreiber, 1998). Based on mid-IR observations, Lipscy & Plavchan (2004) find that at least 20 percent of the star formation in M82 is occurring in SSCs. HST/NICMOS images of the region (Figure 1) show many luminous SSCs within pc of the nucleus.
The nuclear starburst is “active” in the sense that the typical age for the starburst clusters is years (Satyapal et al., 1997). Evolutionary synthesis models by Förster Schreiber (1998) suggest the nuclear starburst (i.e., the central 450 pc) consists of two distinct, short duration events with ages of about 5 Myr and 10 Myr. The most intense star formation took place parallel to the plane of the galaxy with a peak near the nucleus. O’Connell et al. (1995) image M82 in the and bands with the high-resolution Planetary Camera aboard HST, identifying over 100 SSCs within a few hundred parsecs of the nucleus. de Grijs et al. (2001) images a region in the disk of M82, 1 kpc from the nuclear starburst, with WFPC2 and NICMOS. They identify 113 SSC candidates which were part of a starburst episode 600 Myr ago (a “fossil starburst”), with little star formation in the past 300 Myr. The clusters in the fossil starburst have masses of M. Smith & Gallagher (2001, SG01) estimate an age of Myr for the SSC ‘M82-F’, intermediate between the ongoing nuclear burst and the fossil burst farther out in the disk. M82-F lies 500 pc west of the nucleus of M82. McCrady et al. (2005) measures a mass of Mfor the cluster based on near-IR observations, and found evidence for mass segregation.
Early ground-based studies of M82 found evidence of an abnormal IMF. Rieke et al. (1993) uses population synthesis models to constrain the IMF based on the near-IR observations of McLeod et al. (1993). They conclude that the large -band luminosity of the M82 starburst relative to its dynamical mass requires an IMF that is significantly deficient in low-mass stars ( M). Doane & Mathews (1993) examine the supernova rate, molecular gas mass and total dynamic mass and conclude that an IMF producing stars of mass Measily matches observations, whereas a power-law IMF (e.g., Salpeter, 1955) would require an unreasonably small mass of stars in the region prior to the onset of the burst. In contrast to these global studies, Satyapal et al. (1997) use -resolution near-IR images to identify pointlike sources and find that at this scale starburst models can match observations without invoking a high-mass-biased IMF. High spatial-resolution studies are necessary to investigate star formation in the cluster-rich M82 starburst. In a pilot study for this article, McCrady et al. (2003) measure the kinematic mass of two clusters using near-IR spectra and imaging. Based on the light-to-mass ratios of the clusters, they find that one (MGG-11) appears to have a top-heavy IMF, whereas the other (MGG-9) appears consistent with a normal IMF. Measurement of the SSC mass independent of assumptions regarding the ratio are required to further constrain the stellar IMF in the clusters.
1.4. Overview
In this article, we measure the virial masses of the super star cluster population of the inner pc of the M82 starburst, extending the work of McCrady et al. (2003). Our aim is to examine star formation in the starburst on the scale of individual super star clusters, regions only a few parsecs in extent, with an eye towards placing constraints on the IMF of individual SSCs.
We use high-spectral-resolution near-IR spectroscopy from the W.M. Keck Observatory to measure the stellar velocity dispersions and dominant stellar spectral type of the SSCs. We then apply the virial theorem to derive their masses. Clusters for which the age may be determined facilitate investigation of the IMF. In § 2 we describe the kinematic mass, the method we use to measure the velocity dispersion of stars in a cluster, and discuss related systematic effects. In §3 we discuss the NIRSPEC observations, data reduction and spectral extraction. In § 4 we measure cluster velocity dispersions and derive the kinematic masses of the clusters, and present the cluster mass function for the nuclear starburst region.
2. Approach
The mass of a gravitationally-bound star cluster may be determined by application of the virial theorem (Spitzer, 1987). Specifically, the virial mass is a function of two observable quantities:
| (1) |
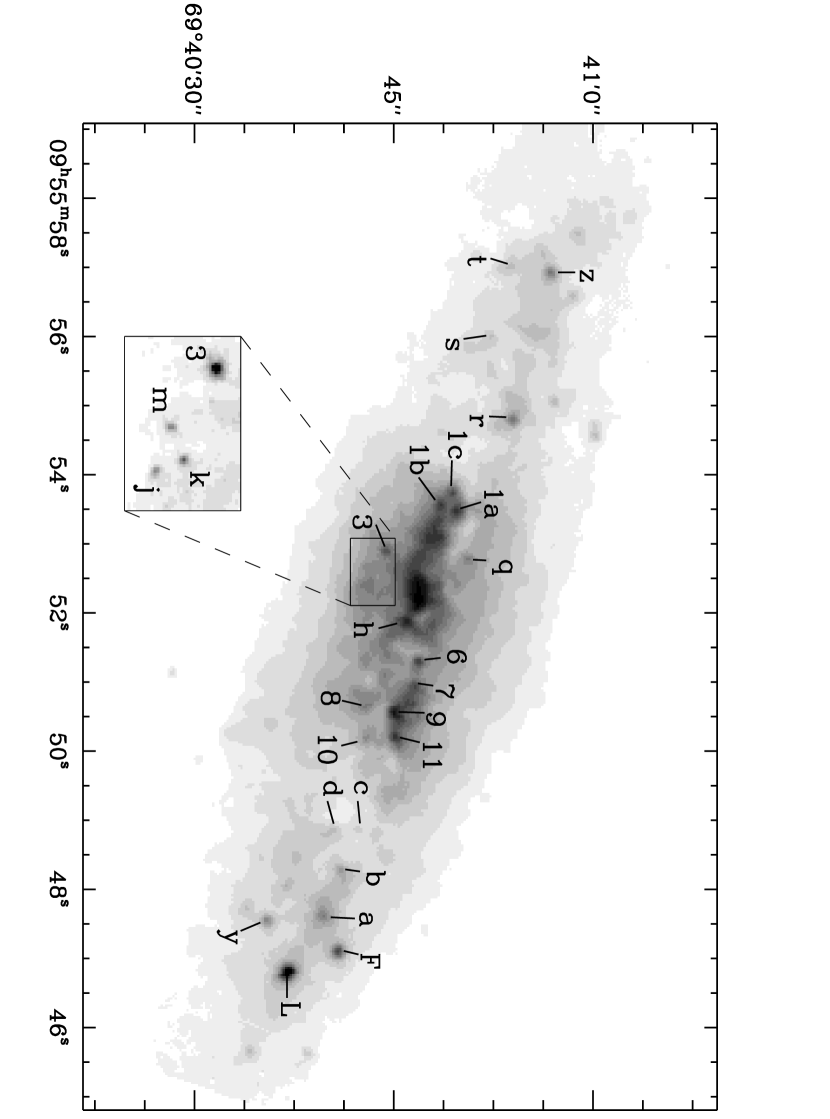
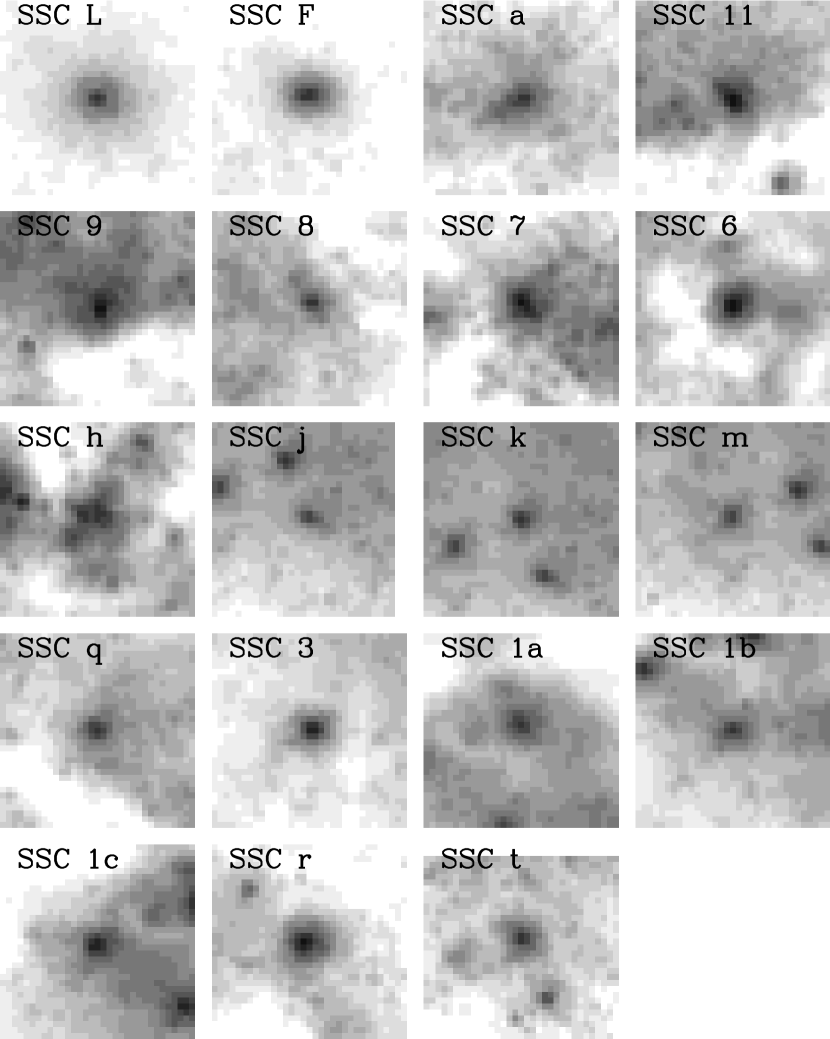
where is the half-light radius in projection, is the one-dimensional line-of-sight velocity dispersion and is Newton’s gravitational constant. Half-light radii for the M82 clusters were measured in McCrady et al. (2003) based on HST/NICMOS images. We assume the light profile of the cluster traces the mass distribution, and thus use the measured half-light radius as a proxy for the half-mass radius. In the case of mass segregation, however, this assumption breaks down for near-IR light, and the resulting mass represents a lower-limit (McCrady et al., 2005). The M82 nuclear SSCs are labelled in a NIRSPEC slit-viewing camera (SCAM) mosaic shown in Figure 2. HST/NICMOS -band (F160W) images of the clusters are shown in Figure 3.
To measure for the clusters, we obtain high-spectral-resolution near-IR integrated light spectra and perform a cross-correlation analysis with template supergiant stars. The near-IR spectrum of a young SSC (i.e., ages Myr) is dominated by the light of cool, evolved supergiant stars. These highly luminous stars have a large number of molecular and atomic features in the band. The integrated-light spectrum of an SSC resembles the spectrum of a red supergiant star, the features of which have been “washed out” by the velocity dispersion of stars in the cluster (Figure 4). Our cross correlation method, described in detail in McCrady et al. (2003), returns both the velocity dispersion of the cluster relative to a particular template supergiant and a measure of the similarity of the cluster and supergiant as quantified by the peak value of the cross correlation function (CCF). We have prepared an atlas of 19 high-resolution () template star spectra in the band, ranging from spectral types G2 through M5 in luminosity class I (Kirian et al., 2006). Results of the cross correlation analysis are presented in §4.
Determination of the velocity dispersion by cross correlation analysis is subject to several potential sources of systematic error. A detailed analysis is presented in McCrady (2005). We present an overview in the following paragraphs.
One potential difficulty is metallicity differences between the Galactic supergiants used as templates and the supergiants producing the cluster light. McLeod et al. (1993, and refs.) cited evidence from emission-line studies of various elements and concluded that the present-day ISM in M82 has solar or slightly higher metallicity. Förster Schreiber et al. (2001) determined that near-IR stellar absorption features observed in the starburst core are consistent with the light from solar-metallicity red supergiants (RSG). Origlia et al. (2004) performed abundance analysis on the nuclear starburst region using spectral synthesis models for near-IR absorption and X-ray emission. They found an iron abundance roughly half of the solar value, but enhancement of -elements to solar or slightly higher levels. This pattern is consistent with enrichment by recursive bursts of Type II supernovae. The template supergiants used in our analysis also have roughly solar metallicity, and thus we expect that metallicity effects are unlikely to significantly bias the measured cluster velocity dispersions.
Cross-correlation with a mismatched template spectrum can introduce systematic bias to the velocity dispersion determination. Tests with supergiant spectra broadened with a Gaussian to simulate the effect of a cluster velocity distribution indicate that the cross correlation analysis correctly identifies the “best fit” based upon the peak value of the CCF. Increasing the level of added noise decreases the CCF peak, but does not lead to misidentification of the best template. We have elected to cross-correlate the cluster spectra with spectra of single RSG stars because the light of a young coeval cluster should be dominated by the light of the most massive stars. At an age of years, this would be the light of evolved massive stars, i.e., the RSG stars. Mixing a composite spectrum (with the inclusion of intermediate mass stars) would generate a better match to the overall spectrum (particularly the depth of absorption features — see below). But for our purposes, it is more important to be able to isolate the width of the lines resulting from the velocity dispersion of cluster stars.
In addition to the dominant light of the RSG stars, we expect the cluster spectra to contain a substantial contribution from intermediate mass stars still on the main sequence. In the band, the spectra of A and late-B stars (with masses 2–6 M) are essentially featureless, with the exception of the prominent (and wide) hydrogen Brackett series absorption lines. The prevalent nebular emission in the disk of M82 requires us to avoid the wavelength ranges of these hydrogen lines in our analysis. Over the rest of the spectral range in our analysis, an admixture of intermediate mass star spectra would only change the slope of the spectrum (as the near-IR spectra of these stars are essentially thermal). One step in our analysis is the removal of any continuum slope, as the cross-correlation technique is used to measure the velocity dispersion, information which is contained in the width of the absorption lines, not in the depth of the lines or in the continuum. As such, addition of intermediate mass star spectra would not affect the measured velocity dispersions or virial masses.
Filtering of the spectra in Fourier space is a source of systematic error. Extracted spectra (§3) are cross-correlated with the spectra of template supergiant stars. The spectra are baseline-subtracted, apodized and both high- and low-pass filtered in Fourier space. At the high-frequency end, the cross correlation result is affected by random noise; high amplitude noise residuals from sky emission line subtraction are particularly noxious, as the effects are unpredictable and merely serve to increase uncertainty. Low frequencies contain information about spectrum-wide residual variations after baseline subtraction. One likely source of such a variation is the presence of light from intermediate-mass main sequence stars in the integrated cluster light. Very broad hydrogen absorption features typical of the otherwise largely featureless -band spectra of A0V stars (Meyer et al., 1998), for example, would not be removed by the low-order baseline subtraction. Information pertaining to the velocity dispersion of the cluster resides in the frequencies between the extremes.
The frequency filtering applied to the NIRSPEC data leads to a systematic error of km s, which varies between echelle orders. The offsetting correction applied to the results respresents a correction of no more than 20 percent, generally less. Noise in the input spectrum leads to uncertainty in the correction factor in the range of km s, setting the lower bound on the precision of the velocity dispersion measurements.
3. Observations
3.1. NIRSPEC Spectra
The spectra used to determine the internal velocity dispersions of the SSCs and template stars were taken with the facility near-infrared echelle spectrometer NIRSPEC (McLean et al., 1998) on the 10-m Keck II telescope on Mauna Kea, Hawaii. We used NIRSPEC in the echelle mode, which yields spectral resolution of .
The integrated light of super star clusters aged 5 to 80 Myr is dominated by evolved supergiant and bright giant stars (Gilbert, 2002). The near-IR spectrum of cool evolved stars is replete with atomic and molecular absorption features — no “continuum” in the traditional sense (i.e., a Planck thermal spectrum) is evident. Both the and bands offer a large number of features that the cross correlation analysis effectively averages over in determination of the mean feature width. There is perhaps an advantage to the band, in that warm circumstellar dust may veil features in the band. The NIRSPEC detector experiences significant “persistence” from exposure to large flux, for example bright sky OH emission lines or arc lamp lines. Operationally, this discourages changing of filters during an observing night as the persistent after-images of sky emission lines from a different filter add significantly to the noise in an echellegram. In this analysis, we have opted to observe the clusters at the shorter wavelength only.
The NIRSPEC-5 (N5) order-sorting filter covers the wavelength range 1.51–1.75 m, corresponding approximately to Johnson . The N5 echelle data fall in seven echelle orders, ranging from 44 through 50. All observations were taken with the echelle and cross-dispersion gratings set at their blaze angles. This position maximizes signal-to-noise for a given exposure time. This advantage is mitigated by the fact that more than a single position is required to cover the free spectral range at 1.6 m, and portions of the band are not observed.
Spectra used in this work were obtained over four observing seasons, from February 2002 through January 2005. Table 1 presents a summary list of spectroscopic observations. NIRSPEC observations of evolved stars used as template spectra are discussed in Kirian et al. (2006) and McCrady et al. (2003). The minimum airmass of M82 (declination ) from Mauna Kea is 1.56, and efforts were made to observe at an airmass of no larger than 2.0 when possible. The slit used has a width of (3 pixels) and length of . Use of the long slit improves background subtraction, and often allows multiple clusters to be observed simultaneously. Slit positions were chosen to include multiple objects where possible to increase observing efficiency. Certain pairs of targets are closely-separated and only resolvable in good seeing.
Each individual cluster spectrum has an integration time of 600 seconds. Bright OH sky emission lines begin to saturate in longer exposures, increasing the difficulty of sky subtraction. Total integration time on a cluster is increased by repeating the observations.
3.2. Reduction and Extraction
The spectra were dark-subtracted, flat-fielded and corrected for cosmic rays and bad pixels. The curved echelle orders were then rectified onto an orthogonal slit-position versus wavelength grid based on a wavelength solution from sky (OH) emission lines. Each pixel in the grid has a width of nm. We sky-subtracted by fitting third-order polynomials to the 2D spectra column-by-column.
The NIRSPEC echelle turret is jostled when the cryogenic image rotator undergoes large slews, leading to stochastic shifts of the wavelength scale of up to several pixels. Doppler shift information is lost due to such shifts. Typically, the absolute wavelength scale is established using telluric OH emission. Throughout each data acquisition cycle the image rotator was either turned off, or only slow, small amplitude tracking motions were executed. In either case the wavelength solution is stable to better than a few hundredths of a pixel. Thus the velocity broadening reported here is intrinsic to the source and is not an instrumental effect.
The cluster spectra were extracted using Gaussian weighting functions matched to the wavelength-integrated profile of each cluster. To correct for atmospheric absorption in the cluster spectra, we observed a hot main sequence star at a similar airmass. This calibration star spectrum is divided by a spline function fit to remove photospheric absorption features (particularly Brackett series and helium lines) and continuum slope. The resulting atmospheric absorption spectrum is then divided into the cluster spectra.
The adopted sky-subtraction method generally completely removes sky emission lines. However, a high level of noise is left behind at the position of bright OH lines, particularly un- or barely-resolved doublets. These “noise spikes” must be removed to avoid introduction of systematic bias in the cross-correlation results. We smooth the spectrum with a broad ( km s) step function, and subtract the original spectrum to obtain a residuals array. Data points greater than the rms are replaced by the smoothed pixel. The step-function width and clipping level were chosen to limit replaced pixels to only those affected by strong sky emission lines. Certain atmospheric OH emission lines were incompletely removed in the sky subtraction process. In these cases, we replaced the pixels affected by residual sky emission with the median value of the pixels on either side of the contaminated range. The fraction of pixels replaced in a given echelle order typically amounts to a few percent. Tests on an OH emission-free echelle order indicate that the cross-correlation result is unaffected within the stated uncertainties.
An atlas of the spectra for 19 SSCs is presented in Figures 5 and 6. We have included here only the spectra for echelle orders 46 and 47; plots of all echelle orders for each cluster are available in McCrady (2005). Each cluster spectrum represents the summation of multiple observations (Table 1). The total is normalized by dividing by the median value for that echelle order, such that the spectrum is centered about unity. The resulting scale is relative flux, which allows direct comparison of spectra of different clusters. The spectra are offset by an arbitrary integer amount for presentation of multiple clusters on a single set of axes, and labeled towards the right (long-wavelength) side. The clusters within a given echelle order are arranged in the atlas in order of increasing velocity dispersion.
The signal-to-noise ratio () of the extracted spectra varies between clusters. The clusters vary in luminosity over a range of four apparent magnitudes in band (McCrady et al., 2003), which is a factor of . The luminosity differences carry through to the single-integration as all clusters were observed for 600 seconds per integration. Light losses due to variable seeing and inefficiencies in fine guiding add additional variation to the for each cluster. Although faint clusters were observed more often, not all clusters were observed to the same as a result of observing constraints. Differences in the total are evident in the atlas of cluster spectra. For example, faint SSC-k was observed only twice and has total per pixel based on the CCD equation (Howell, 2000, p. 54), which accounts for Poisson statistics, background, dark current and read noise. Bright SSC-1c was also observed just twice, but has total per pixel. Repeated observations (13 times) of SSC-r brought the total up to per pixel; a single observation of faint SSC-r results in comparable to a single observation of SSC k. These examples provide a sense of the S/N range of the observations.
The spectra presented in the atlas have been shifted to rest wavelength. Across the top of each plot, we have identified the positions of certain prominent spectral features. The -band spectra of the clusters resemble the spectra of supergiant stars, and have a large number of iron and OH absorption lines. Rovibrational bandheads of carbon monoxide are recognizable in orders 45 through 49. As seen in the spectra of supergiant stars (Kirian et al., 2006; Meyer et al., 1998), the strength of the CO bandheads and OH lines increase at cooler effective temperatures. Lines from other miscellaneous metals (Mn, Ti, Si, Ca, C, Ni) and molecules (CN) are also indicated. At the bottom of each atlas plot is a representative sky emission spectrum for that echelle order, arbitrarily scaled. The brightest OH emission lines leave a footprint of increased noise in the extracted cluster spectrum.
The disk of M82 has substantial diffuse emission. The nuclear starburst displays mottled near-IR continuum emission (Figure 1). The cross-correlation analysis based upon the spectra of the clusters is more sensitive to line emission. Lynds & Sandage (1963) first noted the bipolar, filamentary network of H emission extending more than 1 kpc from the galactic center. Paschen images show patchy recombination emission throughout the nuclear starburst (Alonso-Herrero et al., 2003). -band spectra show emission lines of hydrogen (Br ), He I and H2. Prominent -band emission lines are [Fe II] at 1.644 m and the Br 6 line of hydrogen at 1.7367 m. In several of the slit positions used, nebular emission varies along the slit and removal is difficult. Remnants of the lines are apparent in the spectra of certain clusters (e.g., SSC-1c in Figure 6).
3.3. Objects Observed
The 20 objects of Table 3 of McCrady et al. (2003) and the 19 objects of Table 2 do not constitute equal sets. The intersection of the two tables contains the 15 SSCs for which we have herein derived a mass (see Table 2). The union of the two tables contains 24 objects. Moreover, Figure 2 identifies 26 objects. An accounting of the objects observed in this project is as follows.
Five clusters for which we measured photometry and half-light radius had significant problems with their echelle spectroscopy. The practical single-exposure time limit of 600 seconds is set by the saturation point of atmospheric OH emission lines. Clusters fainter than [F160W] mag have in 600 seconds of typical seeing. In poor seeing, these faint clusters are often too difficult to identify for positioning the spectrograph slit. SSC-1b is a frustrating case, as it is a bright cluster with good in a 600-s exposure. In poor seeing, however, the light from SSC-1b is blended with the light of the nearby clusters SSC-1a and SSC-1c. Observations on 2003 Feb 6 were not used for SSC-1b or SSC-1c because of inadequate seeing. On the night of 2005 Jan 24, the seeing was sufficient to resolve SSC-1c, however the NIRSPEC detector was contaminated by persistence due to sky emission from use in low-resolution mode by an unaffiliated observing team earlier in the night. While we were able to extract SSC-1c, SSC-1b was significantly contaminated and had to be rejected.
Six other objects identified in Figure 2 have no derived virial mass. SSC-z is clearly a super star cluster, but lies just north of the edge of the HST/NICMOS field (McCrady et al., 2003). In the absence of a resolved image, we have no measurement of the half-light radius. Object “y” also lies off the edge of the NICMOS field, just south of SSC-L. Spectra of object “y” are inconclusive due to low in any case. Object “10” is unresolved by the NICMOS image, and we therefore have no measured half-light radius. Interestingly, object “10” is coincident with a point source in Paschen images, suggesting it may be a compact H II emission region surrounding one or several massive stars. SSC-j and SSC-a are not well fit by empirical King functions, and the half-light radii of these clusters are undetermined. SSC-h is likewise not well fit by the empirical King model, as it is clearly a collection of sources in NIC2 images (Figure 3).
4. Analysis
4.1. Cross Correlation Results
Each cluster was observed multiple times, with seven echelle orders in the N5 filter per observation. A single observation of the spectrum in a particular echelle order is treated as one “experiment” for the cluster. Each of the experiments for a cluster is cross correlated with the spectrum from the corresponding spectral order of each of the template evolved stars. The result of this analysis is an ensemble of cross correlation functions (CCFs) for each cluster/template star pair. The peak amplitude of the CCF measures the similarity of the cluster to the template spectral type (Table 2). For each cluster, we have identified the template supergiant spectrum which provides the best match. In most cases, several template stars match the cluster approximately equally well. The spectra of template stars with higher surface temperatures (e.g., G-type stars) proved to be poor matches for the cluster spectra. The CCFs for each cluster and its best-match template are presented in McCrady (2005).
The velocity dispersions based upon cross correlation results for the best-match template star are listed in Table 2. The quoted uncertainties reflect the formal error based upon the standard deviation of the mean for the ensemble of experiments. Systematic errors are treated in McCrady (2005, see also §2); the stated uncertainties do not include any allowance for the applied correction of systematic offsets. In the course of the analysis, each cluster spectrum is cross correlated with each of the template spectra. We find that the velocity dispersions indicated by the best match template are consistent with velocity dispersions indicated by other templates of similar effective temperature to within the uncertainties.
4.2. Derived Virial Masses
Armed with measurements of the cluster half-light radii and velocity dispersions, we are ready to derive the virial masses. Table 2 lists the derived mass for 15 SSCs in M82. Most of the SSCs have masses between and M; clusters SSC-L, SSC-7 and SSC-9 have M. The median uncertainty on the virial mass measurements is 16 percent. A significant portion of the error budget is the 8 percent uncertainty in the adopted distance to M82.
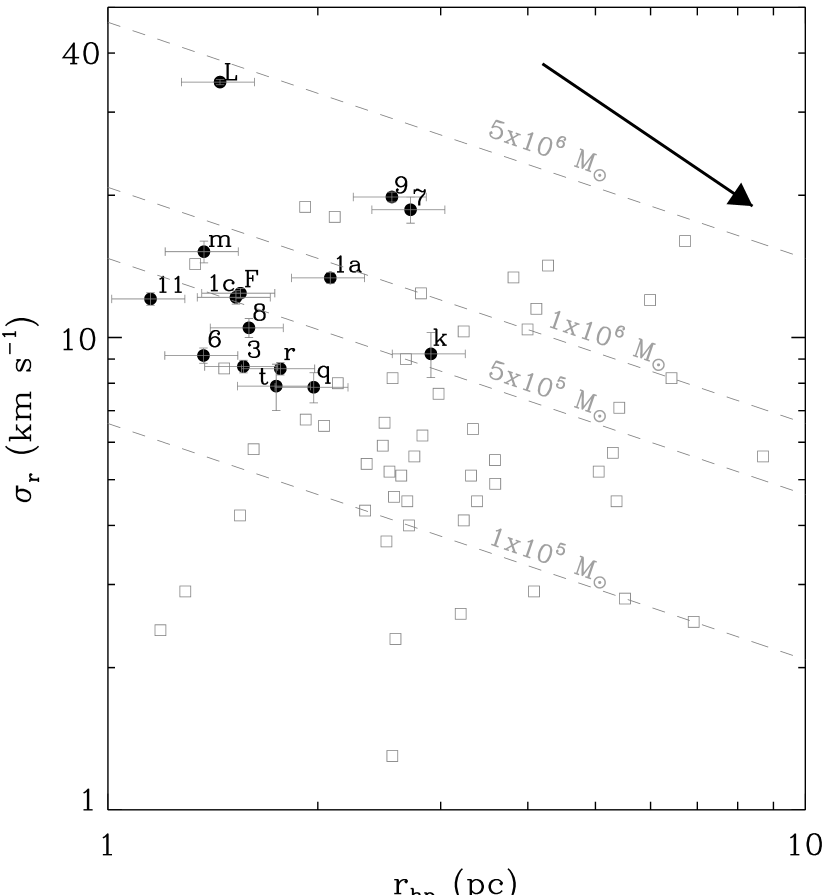
Figure 7 plots the half-light radii versus the velocity dispersions for the SSCs. We have plotted the locus of points for certain masses as dashed lines. These lines illustrate that the uncertainty in the velocity dispersion, , has a greater impact on the uncertainty in mass than does the uncertainty in the half-light radius, . This is to be expected, as the virial mass (Eq. 1) is proportional to the square of . We have mitigated this effect by measuring to a precision sufficient to balance the error budget roughly evenly between uncertainties on the velocity dispersions and the halflight radii.
Application of the virial theorem to determine the mass of the clusters is based on the assumption that the clusters are at present bound (self-gravitating) entities. This assumption is supported by a comparison of the relevant timescales: the crossing time and the age of the clusters. The crossing time is the typical time required for a star to cross the cluster, where (Binney & Tremaine, 1987, p. 190). The SSCs in Table 2 have crossing times in the range of to years, while their ages are on the order of years (Satyapal et al., 1997). Thus, member stars have made tens of crossings of the clusters. After just a few crossing times, the stars of a cluster are well mixed (King, 1981) and the virial theorem is well satisfied (Aarseth, 1974). The assumption that the M82 clusters are currently gravitationally bound is therefore valid.
To provide context and a sense of scale for the derived cluster masses, we turn to virial mass measurements of SSCs and globular clusters in our own and other galaxies from the literature. Pryor & Meylan (1993) use velocity dispersions and King-Michie model fits to derive virial masses of 56 Galactic globular clusters. Their velocity dispersions range from km s( km s) and masses of to M( M). The Milky Way globular clusters are plotted in Figure 7 for comparison with the M82 clusters. (Pryor & Meylan (1993) provide and , from which we estimated using Eq. 1.) In total, the Milky Way has about 180 globular clusters (Ashman & Zepf, 1998, p. 31). If we assume an average cluster mass of M(Mandushev et al., 1991), the total mass of the Galactic population is M. The M82 SSCs in Table 2 have a total mass of M, comparable to the aggregate mass of the much older Galactic globular clusters. (However, we do not mean to imply that all of the M82 SSCs will remain bound for 12 Gyr; see §5.)
The old globular clusters of the Milky Way are spread widely in the space of Figure 7, but in general the locus of points is below (lower velocity dispersion and to the right (larger radius) of the locus of points for the young M82 SSCs. What can we infer about the two populations from this plot? It is interesting to consider the time evolution of a cluster in this parameter space. Over time, mass loss from individual stars in the course of their evolution will cause a cluster to lose mass. As detailed in the Appendix, adiabatic mass loss by a virialized cluster progresses such that the product is conserved. An isolated cluster, evolving through adiabatic mass loss, would gradually move down and to the right in Figure 7 as indicated by the plotted vector, crossing the “isobaric” lines. Over the span of 15 Gyr, a cluster with a Kroupa IMF would lose around half of its initial mass (i.e., its mass at 10 Myr) as a result of stellar evolution (McCrady et al., 2003). Such adiabatic evolution of the young M82 SSCs over a Hubble Time would place the clusters in the same region as the bulk of the old globular clusters in Figure 7. We discuss the implications of this plot further in §5.
Additional context for our results comes from observed cluster systems in other galaxies. Dubath & Grillmair (1997) measured the masses of nine globular clusters in M31. They find velocity dispersions of km s( km s), pc ( pc) and masses of M( M). Larsen et al. (2002) measure virial masses for four globular clusters in M33. They find velocity dispersions of km s, pc and masses of M. In general, the old globular clusters in these neighboring galaxies are larger with lower velocity dispersions. This pattern is consistent with the notion that the M82 SSCs are a population of young globular clusters, as adiabatic mass loss due to stellar evolution would cause the clusters to expand over time (see Appendix). A more direct comparison is provided by young SSCs in other galaxies. Mengel et al. (2002) examines five young (age Myr) clusters in the merging Antennae galaxies. They find velocity dispersions of km s, of pc, and masses of M.
As discussed in McCrady et al. (2005), SSC-F shows evidence of mass segregation. While cluster-wide dynamical mass segregation in these young clusters is unlikely, it is possible that the most massive stars in a cluster have either rapidly sunk toward the core or simply formed nearer the core. In either case, the red supergiant velocity dispersions we measure in the near-IR would be smaller than the cluster mean and the masses we derive would represent lower limits. Gasdynamical modeling by Boily et al. (2005) indicates that inward migration of massive stars may cause the dimensionless geometric parameter in the virial mass formula (Equation 1) to increase by a factor of around two over a few yr. In our analysis, we have explicitly assumed that as derived in (McCrady et al., 2003). If mass segregation has in fact led to in these M82 clusters, the masses we derive here would be underestimated by the corresponding factor.
4.3. Cluster Mass Function
Armed with the virial masses of the SSCs, we can investigate the cluster mass function for the M82 nuclear starburst. The standard manner for making a cluster mass function is to prepare a histogram of the masses over logarithmically spaced bins and fit a power law or lognormal distribution to the slope. Rosolowsky (2005) demonstrates the shortcomings of this method, citing specifically the dependence of the power law index to the choice of bin size and spacing in cases involving a small number of data points. We choose instead to evaluate the cumulative mass function for the 15 M82 SSCs. Figure 8 plots the cumulative mass function as , which is the total number of clusters with mass greater than the reference mass . In the common case of a power law, the slope of a standard mass function is . For the cumulative mass function, the integration adds one to the exponent, such that (Rosolowsky, 2005).
The mass function for the M82 SSCs is well fit by a power law of index . The uncertainty on the power law index is based on a Monte Carlo simulation of our mass data. We resampled the cluster masses by adding normal noise according to the uncertainties on the mass measurements, then fit for the index of the resulting cumulative mass function. The distribution of power law indices was Gaussian with a standard deviation of our quoted uncertainty. The power law index of indicates that the stellar mass of the cluster population is divided rather equally between the high-mass clusters and low-mass clusters. Of the aggregate mass in our sample of 15 SSCs, roughly 60 percent of the mass is contained in the three most massive clusters (SSCs L, 9 and 7).
Estimation of the completeness limit for our SSC mass function is somewhat difficult. Our mass measurements are based on measured cluster velocity dispersions. For us to measure a velocity dispersion, the cluster must be observable in the near-IR and be sufficiently bright and spatially resolved for us to obtain a usable spectrum. Limiting factors include the intrinsic mass of the cluster, the light-to-mass ratio for the cluster, confusion with adjacent clusters or background emission, and line-of-sight extinction. With the exception of SSC 1b, which suffers from source confusion, we are confident we have obtained the spectra of all clusters brighter than apparent magnitude . At the distance of M82, this corresponds to a cluster luminosity of L. To convert to a mass estimate, we can estimate the light-to-mass ratio for the clusters. For clusters in the age range of 7–13 Myr, suitable for the M82 nuclear clusters (McCrady et al., 2003), and a Kroupa (2001) field star mass function, Starburst99 models predict in units of L/M. The highly variable extinction in the dusty, inclined disk of the galaxy could be hiding additional bright clusters, on the far side of the disk for example. Assuming a typical extinction correction for the clusters of mag in band, we estimate that our mass function is largely complete for clusters more massive than M. To characterize the potential effects of incompleteness, we added fake clusters of mass Mto the Monte Carlo simulation. Each additional undetected cluster with mass near this completeness limit would decrease the power law index by (i.e., the power law would become more steeply negative).
5. Discussion
In §4.2, we note that the evolution of an individual M82 SSC via adiabatic mass loss due to stellar evolution over a Hubble time would reposition the SSC in parameter space. Such a repositioning would leave any of the SSCs in our sample in a region consistent with the position of the old globular clusters in the Milky Way (Figure 7). In a sense, this represents a necessary but not sufficient condition for the hypothesis that these young SSCs represent the progenitors of globular clusters. If, instead, our analysis showed that stellar evolution would move the clusters to a point in parameter space that would be inconsistent with the position of old globular clusters, it would represent strong evidence that these SSCs could not be progenitors of globular clusters. In fact, adiabatically evolving any individual M82 SSC from our sample for 15 Gyr would leave it solidly within the region of parameter space occupied by old globular clusters.
But we hasten to note that this result is insufficient evidence that these SSCs are destined to become a population of old globular clusters. The M82 nuclear clusters are young, with ages on the order of 10 Myr (Förster Schreiber, 1998; McCrady, 2005). There is growing evidence in the literature that a significant portion of young clusters are disrupted on a timescale of approximately 10 Myr from birth. Observations of massive clusters in the Antennae galaxies (Fall et al., 2005) and M51 (Bastian et al., 2005) and lower mass open clusters in the solar neighborhood (Lada & Lada, 2003) find an excess of clusters with ages Myr relative to what would be expected based on an assumption of constant cluster formation rate (Bastian & Gieles, 2006). The naive interpretation of these findings is that there was a burst of star cluster formation in the past 10 Myr in each of these galaxies. But as noted by Fall et al. (2005), the age distribution of star clusters represents the combined histories of star cluster formation and disruption within a galaxy. The relative wealth of clusters aged 10 Myr in these various nearby galaxies suggests that we are fortunate to be observing them at a special time in their star formation histories, whereby we fall afoul of the cosmological principle.
An attractive alternative is that a high percentage of clusters are disrupted within approximately 10 Myr of formation, i.e., the e-folding survival time for a population of clusters is about 10 Myr (Mengel et al., 2005). This hypothesis goes by the morbid name of “infant mortality.” The energy and momentum output of massive stars via stellar winds and supernovae could remove residual natal gas from a young massive cluster. If the gas removal were impulsive (i.e., occured over less than a crossing time), the cluster could become gravitationally unbound and begin expanding freely. Whether or not a cluster survives this phase depends largely on the star formation efficiency in the formation of the cluster from natal gas (see references in Bastian & Gieles, 2006). Fall et al. (2005) posit that because a cluster with more mass has both more gas to remove and more massive stars to provide the energy, the fraction of clusters disrupted may be roughly independent of mass. They find this conjecture to be consistent with their observation that the shape of the cluster mass function in the Antennae galaxies is nearly independent of age.
Zhang & Fall (1999) investigated the mass function of young star clusters in the Antennae galaxies (NGC 4038/9) based on photometric mass estimates, and found a power law mass function of over the range , a result confirmed by Fall et al. (2005). Mengel et al. (2005) found potential evidence for a turnover or change in slope of the mass function for the Antennae clusters, but cautions that the random and systematic uncertainties discourage overinterpretation of this result. They note that determination of the cluster mass function from photometric masses requires age determinations for individual clusters, which is particularly delicate work around ages of yr when the cluster luminosity varies greatly with age.
Our virial mass measurements obviate determination of the ages of individual clusters and assumptions regarding the form and cutoff masses of the stellar IMF. The M82 nuclear clusters in our sample are also young, and follow a power law mass distribution very similar to the Antennae clusters. A power law mass distribution for young SSCs stands in contrast to the lognormal mass distribution for old globular clusters (Harris, 1991), which imply a preferred mass scale at the peak of for Milky Way globular clusters. Several processes, operating on different timescales, have the ability to disrupt star clusters. As discussed above, infant mortality appears to disrupt clusters independently of mass, thereby preserving the shape of the initial cluster mass function. On longer timescales ( yrs), the strongly mass dependent processes of two-body relaxation and external perturbations (such as gravitational shocks and dynamical friction) can disrupt the clusters (Bastian et al., 2005). Analytical models by Fall & Zhang (2001) find that the initial form of the high-mass end of the cluster mass function is preserved over time. Two-body relaxation decreases the masses of clusters linearly over time, flattening the mass function at low masses but little affecting the shape at high masses. By 12 Gyr, the mass function develops a peak at a mass of about . Thus, an initial power law distribution of cluster masses will develop into a distribution resembling the lognormal mass function of old globular clusters over 12 Gyr, with disruption erasing all information regarding the initial shape of the mass function at the low-mass end.
In a galactic environment, of course, the clusters are not isolated, and are additionally subject to external forces such as galactic tides and dynamical friction. The inner 1 kpc of a galaxy, with its strong tidal fields, is a particularly dangerous place for star clusters. But as noted by Fall & Zhang (2001), their models “support the suggestion that at least some of the star clusters formed in merging and interacting galaxies can be regarded as young globular clusters.” As shown in Figure 7, the adiabatic evolution of a cluster through stellar evolution and mass loss over a similar time frame will tend to move the M82 SSCs into the parameter space occupied by old Galactic globular clusters. While we cannot predict the fate of any individual M82 SSC, our results suggest that any cluster which should happen to survive for a Hubble time could resemble the old globular clusters seen in the Milky Way today.
6. Summary
In this paper, we investigate the SSC population of the inner pc of the M82 starburst. The nuclear starburst in M82 contains roughly two dozen SSCs that are prominent in the near-IR. Based on high spectral resolution near-IR spectra, we measure line-of-sight velocity dispersions for 19 SSCs in the nuclear starburst. We find dispersions in the range of km s, comparable with values for older globular clusters. We apply the virial theorem to the measured velocity dispersions and halflight radii to derive the masses of 15 of the SSCs. The SSC masses lie in the range of Mto M, placing them at the high end of the mass distribution function for old Galactic globular clusters. The total mass of the 15 measured SSCs is M, which is of the same order of magnitude as the total mass of the globular cluster system of the Milky Way. Evolution of the clusters via gradual mass loss from stellar evolution would move them into the realm of parameter space occupied by old Milky Way globular clusters. The cumulative mass function of the clusters follows a power law with an index of . This is very similar to the mass distribution of young SSCs in the Antennae galaxies, and lends credence to the suspicion that SSCs are potential future globular clusters.
Appendix A Appendix
The consequences of mass loss from a virialized star cluster depend upon the rate of loss. We consider specifically two cases: (1) rapid mass loss, where a star cluster has a sufficiently long relaxation time that and are unable to readjust during the ejection of some quantity of mass, and (2) slow mass loss, where and for the cluster continually readjust to maintain equilibrium.
In the case of rapid mass loss, Hills (1980) derives an expression for the relation between the initial mass and the amount of mass ejected:
| (A1) |
Evidently, as tends to the cluster radius tends to infinity and the cluster becomes unbound.
In the case of gradual mass loss, the cluster constantly adjusts to maintain equilibrium. The total energy at any instant, whether the cluster is in equilibrium or not, is
| (A2) |
where is the 3-d rms velocity and is a non-dimensional form factor. The corresponding change in total energy of the system is
| (A3) |
After is lost, the cluster must readjust to the new equilibrium. In the new equilibrium configuration the Virial theorem, (Binney & Tremaine, 1987, p. 211), can be invoked to express the partial derivative:
| (A4) |
which can be integrated from the initial mass, , and energy ,
| (A5) |
to yield . Substituting again from the Virial theorem, which shows that , we have have an expression for the radius as a function of mass,
| (A6) |
which is the adiabatic invariant from Hills (1980), where .
In the equilibrium states both before and after loss of , the Virial theorem applies, and (where is the kinetic energy). Thus:
| (A7) |
Simplifying and combining terms,
| (A8) |
which has the physical solution . If we compare this last result to Equation (A6), we find
| (A9) |
and therefore for adiabatic mass loss, constant.
References
- Aarseth (1974) Aarseth, S. J. 1974, A&A, 35, 237
- Achtermann & Lacy (1995) Achtermann, J. M. & Lacy, J. H. 1995, ApJ, 439, 163
- Alonso-Herrero et al. (2003) Alonso-Herrero, A., Rieke, G. H., Rieke, M. J., & Kelly, D. M. 2003, AJ, 125, 1210
- Ashman & Zepf (1998) Ashman, K. M. & Zepf, S. E. 1998, Globular Cluster Systems (New York: Cambridge University Press)
- Böker et al. (2001) Böker, T., van der Marel, R. P., Mazzuca, L., Rix, H., Rudnick, G., Ho, L. C., & Shields, J. C. 2001, AJ, 121, 1473
- Böker et al. (1999) Böker, T., van der Marel, R. P., & Vacca, W. D. 1999, AJ, 118, 831
- Bastian & Gieles (2006) Bastian, N. & Gieles, M. 2006, ArXiv Astrophysics e-prints, astro-ph/0609669
- Bastian et al. (2005) Bastian, N., Gieles, M., Lamers, H. J. G. L. M., Scheepmaker, R. A., & de Grijs, R. 2005, A&A, 431, 905
- Binney & Tremaine (1987) Binney, J. & Tremaine, S. 1987, Galactic Dynamics (Princeton, NJ: Princeton University Press)
- Boily et al. (2005) Boily, C. M., Lançon, A., Deiters, S., & Heggie, D. C. 2005, ApJ, 620, L27
- Brandl et al. (1999) Brandl, B., Brandner, W., Eisenhauer, F., Moffat, A. F. J., Palla, F., & Zinnecker, H. 1999, A&A, 352, L69
- Brandl et al. (1996) Brandl, B., Sams, B. J., Bertoldi, F., Eckart, A., Genzel, R., Drapatz, S., Hofmann, R., Loewe, M., & Quirrenbach, A. 1996, ApJ, 466, 254
- Chernoff & Weinberg (1990) Chernoff, D. F. & Weinberg, M. D. 1990, ApJ, 351, 121
- de Grijs et al. (2001) de Grijs, R., O’Connell, R. W., & Gallagher, J. S. 2001, AJ, 121, 768
- Doane & Mathews (1993) Doane, J. S. & Mathews, W. G. 1993, ApJ, 419, 573
- Dubath & Grillmair (1997) Dubath, P. & Grillmair, C. J. 1997, A&A, 321, 379
- Fall et al. (2005) Fall, S. M., Chandar, R., & Whitmore, B. C. 2005, ApJ, 631, L133
- Fall & Zhang (2001) Fall, S. M. & Zhang, Q. 2001, ApJ, 561, 751
- Förster Schreiber (1998) Förster Schreiber, N. M. 1998, PhD thesis, Lugwig-Maximilians-Universität München
- Förster Schreiber et al. (2001) Förster Schreiber, N. M., Genzel, R., Lutz, D., Kunze, D., & Sternberg, A. 2001, ApJ, 552, 544
- Freedman et al. (1994) Freedman, W. L., Hughes, S. M., Madore, B. F., Mould, J. R., Lee, M. G., Stetson, P., Kennicutt, R. C., Turner, A., Ferrarese, L., Ford, H., Graham, J. A., Hill, R., Hoessel, J. G., Huchra, J., & Illingworth, G. D. 1994, ApJ, 427, 628
- Gilbert (2002) Gilbert, A. M. 2002, PhD thesis, Univ. of California, Berkeley
- Gilbert et al. (2000) Gilbert, A. M., Graham, J. R., McLean, I. S., Becklin, E. E., Figer, D. F., Larkin, J. E., Levenson, N. A., Teplitz, H. I., & Wilcox, M. K. 2000, ApJ, 533, L57
- Harris (1991) Harris, W. E. 1991, ARA&A, 29, 543
- Heckman (1998) Heckman, T. M. 1998, in ASP Conf. Ser. 148: Origins, ed. C. E. Woodward, J. M. Shull, & H. A. Thronson (San Francisco: Astronomical Society of the Pacific), 127
- Hills (1980) Hills, J. G. 1980, ApJ, 235, 986
- Ho & Filippenko (1996a) Ho, L. C. & Filippenko, A. V. 1996a, ApJ, 466, L83
- Ho & Filippenko (1996b) —. 1996b, ApJ, 472, 600
- Howell (2000) Howell, S. B. 2000, Handbook of CCD Astronomy (Cambridge: Cambridge University Press)
- King (1981) King, I. R. 1981, QJRAS, 22, 227
- Kirian et al. (2006) Kirian, R., McCrady, N., & Graham, J. R. 2006, ApJS, in press
- Kroupa (2001) Kroupa, P. 2001, MNRAS, 322, 231
- Lada & Lada (2003) Lada, C. J. & Lada, E. A. 2003, ARA&A, 41, 57
- Larsen et al. (2004) Larsen, S. S., Brodie, J. P., & Hunter, D. A. 2004, AJ, 128, 2295
- Larsen et al. (2002) Larsen, S. S., Brodie, J. P., Sarajedini, A., & Huchra, J. P. 2002, AJ, 124, 2615
- Leitherer (2001) Leitherer, C. 2001, in ASP Conf. Ser. 245: Astrophysical Ages and Times Scales, ed. N. M. T. von Hippel & C. Simpson (San Francisco: Astronomical Society of the Pacific), 390
- Lipscy & Plavchan (2004) Lipscy, S. J. & Plavchan, P. 2004, ApJ, 603, 82
- Lynds & Sandage (1963) Lynds, C. R. & Sandage, A. R. 1963, ApJ, 137, 1005
- Mandushev et al. (1991) Mandushev, G., Staneva, A., & Spasova, N. 1991, A&A, 252, 94
- McCrady (2005) McCrady, N. 2005, PhD thesis, Univ. of California, Berkeley
- McCrady et al. (2003) McCrady, N., Gilbert, A. M., & Graham, J. R. 2003, ApJ, 596, 240
- McCrady et al. (2005) McCrady, N., Graham, J. R., & Vacca, W. D. 2005, ApJ, 621, 278
- McLean et al. (1998) McLean, I. S., Becklin, E. E., Bendiksen, O., Brims, G., Canfield, J., Figer, D. F., Graham, J. R., Hare, J., Lacayanga, F., Larkin, J. E., Larson, S. B., Levenson, N., Magnone, N., Teplitz, H., & Wong, W. 1998, in Proc. SPIE Vol. 3354, Infrared Astronomical Instrumentation, ed. A. M. Fowler (Bellingham: SPIE), 566
- McLeod et al. (1993) McLeod, K. K., Rieke, G. H., Rieke, M. J., & Kelly, D. M. 1993, ApJ, 412, 111
- Mengel et al. (2002) Mengel, S., Lehnert, M. D., Thatte, N., & Genzel, R. 2002, A&A, 383, 137
- Mengel et al. (2005) —. 2005, A&A, 443, 41
- Meurer et al. (1995) Meurer, G. R., Heckman, T. M., Leitherer, C., Kinney, A., Robert, C., & Garnett, D. R. 1995, AJ, 110, 2665
- Meyer et al. (1998) Meyer, M. R., Edwards, S., Hinkle, K. H., & Strom, S. E. 1998, ApJ, 508, 397
- Miller & Scalo (1978) Miller, G. E. & Scalo, J. M. 1978, PASP, 90, 506
- O’Connell et al. (1994) O’Connell, R. W., Gallagher, J. S., & Hunter, D. A. 1994, ApJ, 433, 65
- O’Connell et al. (1995) O’Connell, R. W., Gallagher, J. S., Hunter, D. A., & Colley, W. N. 1995, ApJ, 446, L1
- Origlia et al. (2004) Origlia, L., Ranalli, P., Comastri, A., & Maiolino, R. 2004, ApJ, 606, 862
- Pryor & Meylan (1993) Pryor, C. & Meylan, G. 1993, in ASP Conf. Ser. 50: Structure and Dynamics of Globular Clusters, ed. S. G. Djorgovski & G. Meylan (San Francisco: Astronomical Society of the Pacific), 357
- Rieke et al. (1993) Rieke, G. H., Loken, K., Rieke, M. J., & Tamblyn, P. 1993, ApJ, 412, 99
- Rosolowsky (2005) Rosolowsky, E. 2005, PASP, 117, 1403
- Salpeter (1955) Salpeter, E. E. 1955, ApJ, 121, 161
- Satyapal et al. (1997) Satyapal, S., Watson, D. M., Pipher, J. L., Forrest, W. J., Greenhouse, M. A., Smith, H. A., Fischer, J., & Woodward, C. E. 1997, ApJ, 483, 148
- Sirianni et al. (2000) Sirianni, M., Nota, A., Leitherer, C., De Marchi, G., & Clampin, M. 2000, ApJ, 533, 203
- Smith & Gallagher (2001) Smith, L. J. & Gallagher, J. S. 2001, MNRAS, 326, 1027
- Spitzer (1987) Spitzer, L. 1987, Dynamical Evolution of Globular Clusters (Princeton, NJ: Princeton University Press)
- Takahashi & Portegies Zwart (2000) Takahashi, K. & Portegies Zwart, S. F. 2000, ApJ, 535, 759
- Walborn et al. (2002) Walborn, N. R., Maíz-Apellániz, J., & Barbá, R. H. 2002, AJ, 124, 1601
- Whitmore (2000) Whitmore, B. 2000, in ASP Conf. Ser. 197: Dynamics of Galaxies: from the Early Universe to the Present, ed. G. A. M. F. Combes & V. Charmandaris (San Francisco: Astronomical Society of the Pacific), 315
- Whitmore (2001) Whitmore, B. C. 2001, in Starburst Galaxies: Near and Far, ed. L. Tacconi & D. Lutz (Berlin: Springer), 106
- Whitmore & Schweizer (1995) Whitmore, B. C. & Schweizer, F. 1995, AJ, 109, 960
- Whitmore et al. (1999) Whitmore, B. C., Zhang, Q., Leitherer, C., Fall, S. M., Schweizer, F., & Miller, B. W. 1999, AJ, 118, 1551
- Zepf et al. (1999) Zepf, S. E., Ashman, K. M., English, J., Freeman, K. C., & Sharples, R. M. 1999, AJ, 118, 752
- Zhang & Fall (1999) Zhang, Q. & Fall, S. M. 1999, ApJ, 527, L81
| Date | Objects | Airmass | Seeing | Atm Star | Remarks | |
|---|---|---|---|---|---|---|
| (UT) | (min) | (sec ) | (′′) | (SpT) | ||
| 2002 Feb 23 | 3, 9, 11 | 40 | 1.6 | 0.5 | HD 74604 (B8V) | (1) |
| 2003 Jan 19 | F, L | 70 | 1.9 | 0.8 | HD 173087 (B5V) | |
| 2003 Feb 6 | 1b, 1c, r | 60 | 1.8 | 0.7 | HD 74604 (B8V) | |
| 2003 Feb 6 | 1a, 3, m | 50 | 1.7 | 0.7 | HD 82327 (B9V) | (2) |
| 2003 Feb 6 | 6, 7 | 60 | 1.6 | 0.7 | HD 82327 (B9V) | |
| 2003 Feb 6 | 8, 10, c | 120 | 1.6 | 0.6 | HD 82327 (B9V) | |
| 2003 Feb 6 | s, t | 60 | 1.9 | 0.6 | HD 146926 (B8V) | |
| 2003 Feb 7 | a, b | 90 | 2.0 | 1.5 | HD 146926 (B8V) | (3) |
| 2003 Dec 5 | 6, 7 | 20 | 1.6 | 0.5 | HD 63586 (A0V) | |
| 2003 Dec 5 | 3, 6, h | 40 | 1.6 | 0.5 | HD 63586 (A0V) | (4) |
| 2004 Feb 8 | a, y | 60 | 1.9 | 0.8 | HD 146926 (B8V) | |
| 2004 Feb 8 | r, z | 30 | 2.2 | 1.0 | HD 146926 (B8V) | |
| 2004 Feb 9 | r, z | 40 | 1.6 | 1.3+ | HD 82327 (B9V) | (3) |
| 2004 Feb 9 | a, y | 30 | 1.7 | 1.3+ | HD 82327 (B9V) | (3) |
| 2005 Jan 24 | 1a, 1b | 20 | 1.6 | 0.6 | HD 82327 (B9V) | |
| 2005 Jan 24 | 1a, 1c, q | 20 | 1.5 | 0.6 | HD 82327 (B9V) | |
| 2005 Jan 24 | j, k, q | 30 | 1.5 | 0.6 | HD 82327 (B9V) |
Note. — Seeing values are estimates. Remarks. — (1) Only 30 min on object 3. (2) Only 40 min on object 1a. (3) Seeing very poor & variable. (4) Only 20 min on object 3.
| Best Fit | Mean CCF | Dispersion | Mass$\ast$$\ast$Error in mass includes errors in distance to M82, half-light radius and velocity dispersion. | $\dagger$$\dagger$Crossing time, described in §4.2. | |
|---|---|---|---|---|---|
| Object | Template | Peak Value | (, km s | ( M) | ( yr) |
| SSC L | HR2289 | ||||
| SSC F | HR2289 | ||||
| SSC a | HD237008 | ||||
| SSC 11 | HD237008 | ||||
| SSC 9 | HD237008 | ||||
| SSC 8 | HD14469 | ||||
| SSC 7 | HD237008 | ||||
| SSC 6 | HD237008 | ||||
| SSC h | HD237008 | ||||
| SSC j | HD237008 | ||||
| SSC k | HD237008 | ||||
| SSC m | HD14469 | ||||
| SSC q | HD237008 | ||||
| SSC 3 | HD237008 | ||||
| SSC 1a | HD237008 | ||||
| SSC 1c | HD237008 | ||||
| SSC r | HD237008 | ||||
| SSC t | HD237008 | ||||
| SSC z | HD237008 |