The Transition from the First Stars to the Second Stars in the Early Universe
Abstract
We observe a sharp transition from a singular, high-mass mode of star formation, to a low-mass dominated mode, in numerical simulations, at a metallicity of 10-3 Z⊙. We incorporate a new method for including the radiative cooling from metals into adaptive mesh-refinement hydrodynamic simulations. Our results illustrate how metals, produced by the first stars, led to a transition from the high-mass star formation mode of Pop III stars, to the low-mass mode that dominates today. We ran hydrodynamic simulations with cosmological initial conditions in the standard CDM model, with metallicities, from zero to 10-2 Z⊙, beginnning at redshift, z = 99. The simulations were run until a dense core forms at the center of a 5 105 M⊙ dark matter halo, at z 18. Analysis of the central 1 M⊙ core reveals that the two simulations with the lowest metallicities, Z = 0 and 10-4 Z⊙, contain one clump with 99% of the mass, while the two with metallicities, Z = 10-3 and 10-2 Z⊙, each contain two clumps that share most of the mass. The Z = 10-3 Z⊙ simulation also produced two low-mass proto-stellar objects with masses between 10-2 and 10-1 M⊙. Gas with Z 10-3 Z⊙ is able to cool to the temperature of the CMB, which sets a lower limit to the minimum fragmentation mass. This suggests that the second generation stars produced a spectrum of lower mass stars, but were still more massive on average than stars formed in the local universe.
1 Introduction
Numerical simulations have shown that the very first stars invariably formed in isolation and were much more massive than the sun, due mainly to the inability of primordial gas to efficiently cool at low temperatures (Abel et al., 2002; Bromm et al., 2002; Yoshida et al., 2006). Tumlinson et al. (2004) have suggested that the Pop III IMF was not dominated by very massive stars (M 140 M⊙), but instead by stars with M = 8–40 M⊙. Even this IMF, though, is still remarkably distinct from that observed for the local universe, which peaks at less than one solar mass (Miller & Scalo, 1979; Kroupa, 2002; Chabrier, 2003).
The deaths of the first stars produced and distributed copious amounts of metals into their surroundings, through either core-collapse (M 10 M⊙) or pair-instability (M 140 M⊙) supernovae (Heger & Woosley, 2002). These metals provide additional avenues for radiative cooling of the ambient gas, through fine-structure and molecular transitions, as well as continuum emission from dust formed from the supernova ejecta, permitting the gas that will form the next generation of stars to reach temperatures lower than what is possible for metal-free gas. Fragmentation of collapsing gas will continue so long as the gas can keep decreasing in temperature as the density increases (Larson, 2005), or until the gas becomes optically thick to its own emission (Low & Lynden-Bell, 1976). The minimum fragment mass is determined by the local Jeans mass,
| (1) |
where T, n, and are the temperature, number density, and mean molecular weight, at the halt of fragmentation (Larson, 2005). For metal-free gas, a minimum temperature of 200 K is reached at n 104 cm-3 when H2 cooling becomes inefficient, yielding a Jeans mass, MJ 103 M⊙ (Abel et al., 2002; Bromm et al., 2002). At some certain chemical abundance, it is conjectured that metals provide sufficient cooling, so that the temperature of the gas continues to decrease as the density increases past the stalling point for metal-free gas, allowing the collapsing gas-cloud to undergo fragmentation and form smaller and smaller clumps. The enrichment of gas to some critical metallicity, Zcr, will trigger the formation of the first low-mass (Pop II) stars in the universe, as the gas can cool to lower temperatures at higher metallicity, in general. The value of Zcr can be estimated by calculating the metallicity required to produce a cooling rate equal to the rate of adiabatic compression heating at a given temperature and density. This has been carried out for individual alpha elements, such as C and O, by Bromm & Loeb (2003), and C, O, Si, Fe, as well as solar abundance patterns by Santoro & Shull (2006), yielding roughly, 10-3.5 Z⊙ Zcr 10-3 Z⊙.
Aside from the minimum clump mass, however, not much more can be said about the spectrum of clump masses produced during fragmentation. Omukai et al. (2005) use one-zone models with very sophisticated chemical networks to follow the evolution of temperature and density in the center of a collapsing gas cloud, for a range of metallicities. The predictions of fragmentation from this work, though, are based solely on statistical arguments of elongation in prestellar cores and do not capture the complex processes of interaction and accretion associated with the formation of multiple stars (Bate et al., 2003). Tsuribe & Omukai (2006) simulate the high density (n 1010 cm-3) evolution of extremely low-metallicity gas (Z 10-4 Z⊙), but the conclusions of this work are limited by the fact that the simulations are initialized at an extremely late phase in the evolution of the prestellar core. The numerical simulations by Bromm et al. (2001), which use cosmological initial conditions, show fragmentation in gas with Z = 10-3 Z⊙, but a mass resolution of 100 M⊙ prevents this study from saying anything conclusive about the formation of sub-stellar mass objects.
In this paper, we present the results of three-dimensional hydrodynamic simulations of metal-enriched star-formation. These simulations are similar in nature to those of Bromm et al. (2001), but with vastly improved numerical methods and updated physics. We describe the setup of our simulations in §2, with the results in §3 and a discussion of the consequences of this work in §4.
2 Simulation Setup
We perform a series of four simulations, with constant metallicities, Z = 0 (metal-free), 10-4 Z⊙, 10-3 Z⊙, and 10-2 Z⊙, using the Eulerian adaptive mesh refinement hydrodynamics/N-body code, Enzo (Bryan & Norman, 1997; O’Shea et al., 2004). The metallicity is held constant throughout each simulation in order to isolate the role of heavy element concentration in altering the dynamics of collapse compared to the identical metal-free case. In reality, metals will be injected over time into star forming gas by Pop III supernova blast waves, and the mixing of those metals with the gas will not be completely uniform. Here we focus on an idealized approximation in order to capture the essential physics of collapse and fragmentation.
Each simulation begins at z = 99, in a cube, 300 h-1 kpc comoving per side, in a CDM universe, with the following cosmological parameters: = 0.3, = 0.7, = 0.04, and Hubble constant, h = 0.7, in units of 100 km s-1 Mpc-1. We initialize all the simulations identically, with a power spectrum of density fluctuations given by Eisenstein & Hu (1999), with = 0.9 and n = 1. The computation box consists of a top grid, with 1283 cells, and three static subgrids, refining by a factor of 2 each. This gives the central refined region, which is 1/64 the total computational volume, an effective top grid resolution of 10243 cells. The grid is centered on the location of a 5 105 M⊙ dark matter halo that is observed to form at z 18 in a prior dark-matter-only simulation, as is done similarly in Abel et al. (2002); O’Shea et al. (2005). Refinement occurs during the simulations whenever the gas, or dark matter, density is greater than the mean density by a factor of 4, or 8, respectively. We also require that the local Jeans length be resolved by at least 16 grid cells at all times in order to avoid artificial fragmentation as prescribed by Truelove et al. (1997).
To include the radiative cooling processes from the heavy elements, we use the method described in Smith, Sigurdsson, & Abel (2007), in preparation. The nonequilibrium abundances and cooling rates of H, H+, H-, He, He+, He++, H2, H, and e- are calculated internally, as in Abel et al. (2002); Anninos et al. (1997). Meanwhile, the metal cooling rates are interpolated from large grids of values, precomputed with the photoionization software, CLOUDY (Ferland et al., 1998). We ignore the cooling from dust and focus only on the contribution of gas-phase metals in the optically-thin limit. Unlike other studies of the formation of the first metal-enriched structures, we do not assume the presence of an ionizing UV background. In our model, the singular pop III star that was associated with the dark matter halo in which our stars form has already died in a supernova. We also assume any other Pop III stars are too distant to affect the local star-forming region and that QSOs have yet to form. We use the coronoal equilibrium command when constructing the cooling data in CLOUDY to simulate a gas where all ionization is collisional. The metal cooling data was created using the Linux cluster, Lion-xo, run by the High Performance Computing Group at The Pennsylvania State University. As a consequence of our choice to ignore any external radiation, we do not observe the fine-structure emission of [C ii] (157.74 m) that was reported by Santoro & Shull (2006) to be important. Instead, cooling from C comes in the form of fine-structure lines of [C i] (369.7 m, 609.2 m). The cooling from [C i] in our study dominates in the same range of densities and temperatures as the cooling from [C ii] in Santoro & Shull (2006). We observe the contributions of the other coolants studied by Santoro & Shull (2006), [O i], [Si ii], and [Fe ii], to be in agreement with their work. In addition, we find that emission from [S i] (25.19 m) dominates the cooling from metals at n 107 cm-3 and T 1–3 103 K. The absence of UV radiation in our simulations also allows H2 to form, differentiating this study from Bromm et al. (2001). This allows for a more direct comparison between the metal-free and metal-enriched cases.
The simulations are run until one or more dense cores form at the center of the dark matter halo and a maximum refinement level of 28 is reached for the first time, giving us a dynamic range of greater than 1010. Only the simulation with Z = 10-2 Z⊙ reached 28 levels of refinement. The three other simulations were stopped after reaching 27 refinement levels, since their central densities were already higher than the simulation with Z = 10-2 Z⊙. Table 1 summarizes the final state of each simulation, where zcol is the collapse redshift, lmax is the highest level of refinement, is the maximum gas density within the box, and tcol is the time difference to collapse from the metal-free simulation.
3 Results
As can be seen in Table 1, the runs with higher metallicities reach the runaway collapse phase faster. The relationship between metallicity relative to solar and tcol is well fit by a power-law with index, n 0.22. Gas-clouds with more metals are able to radiate away their thermal energy more quickly, and thus, collapse faster. An inverse relation between metallicity and the number of grids and grid-cells exists because the low-density, background gas evolves at roughly the same rate in all simulations, yet has more time, in the runs with lower metallicities, with which to collapse to higher density, requiring additional refinement.
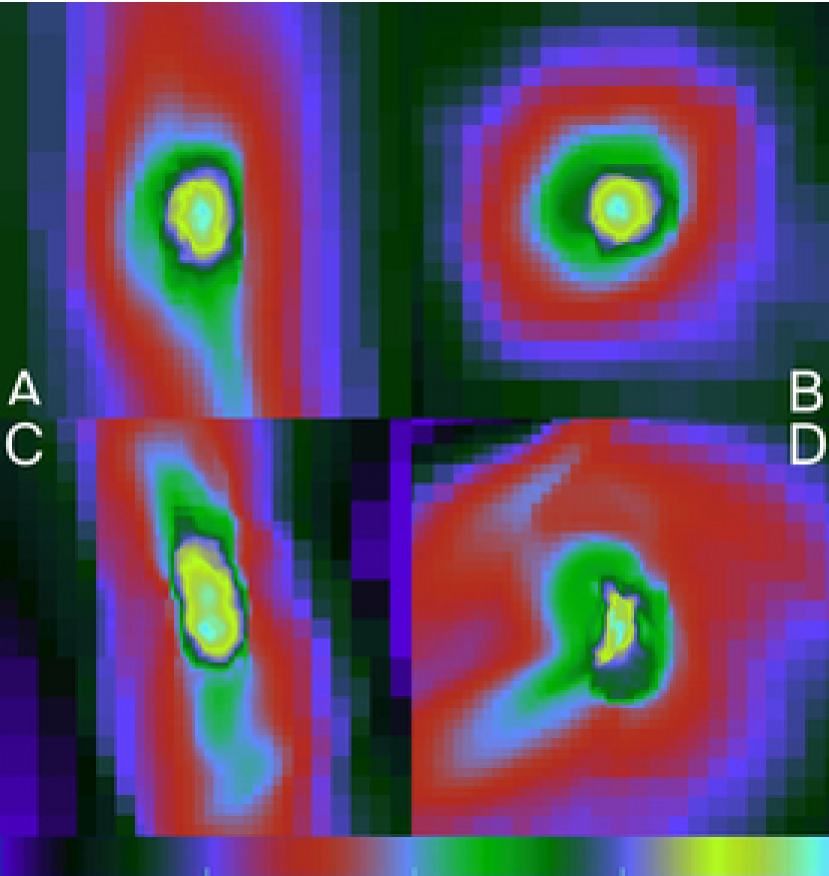
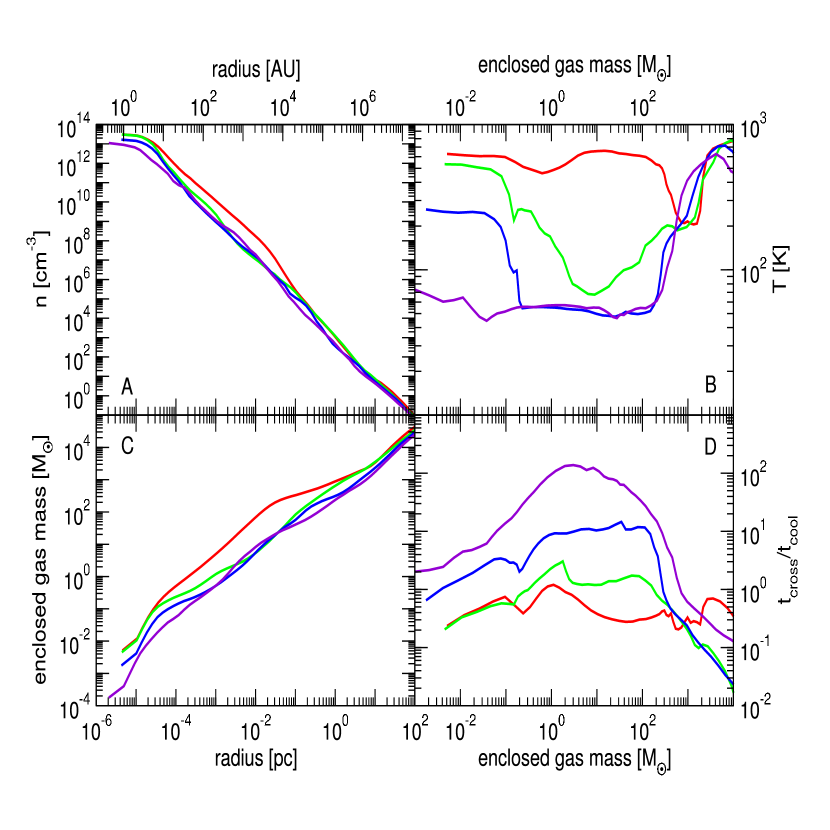
Our simulations, shown in Figure 1, display a qualitative transition in behavior between metallicities of 10-4 Z⊙ and 10-3 Z⊙. In the runs with the highest metallicities (Figure 1C and 1D), the central core is extremely asymmetric, and multiple density maxima are clearly visible. All four runs display similar large-scale density profiles (Figure 2A). Radiative cooling from H2 becomes extremely inefficient below T 200 K, creating the effective temperature floor, visible in Figure 2B for the metal-free case (Abel et al., 2002; Bromm et al., 2002). At n 104 cm-3, the rotational levels of H2 are populated according to LTE, reducing the cooling efficiency and causing the temperature to increase (Abel et al., 2002; Bromm et al., 2002). In the isothermal collapse model of Shu (1977), the accretion rate is proportional to the cube of the sound speed. The increase in temperature leads to an increase in the accretion rate, causing the density, and thus, the enclosed mass (Figure 2C), to be slightly higher inside the central 0.1 pc in the metal-free case. A similar situation occurs further within for the Z = 10-4 Z⊙ and, later, the 10-3 Z⊙ cases, as the metal cooling is overwhelmed by adiabatic compression heating and the temperature begins to rise with density. The presence of metals at the level of 10-4 Z⊙ enhances the cooling enough to lower the gas temperature to 75 K. Metallicities greater than 10-3 Z⊙ provide sufficient cooling to bring the gas down to the temperature of the cosmic microwave background, where TCMB 2.7 K (1 + z). The gas temperatures are in general agreement with the calculations of Omukai et al. (2005) that include a CMB spectrum at z = 20. Fragmentation requires that the cooling time be less than the dynamical time. Figure 2D shows that this criterion is essentially never met in the zero metallicity case, and only marginally in the Z = 10-4 Z⊙ case. However, the fragmentation criterion is more than satisfied in the Z = 10-3 Z⊙ and 10-2 Z⊙ cases over a wide mass-range.
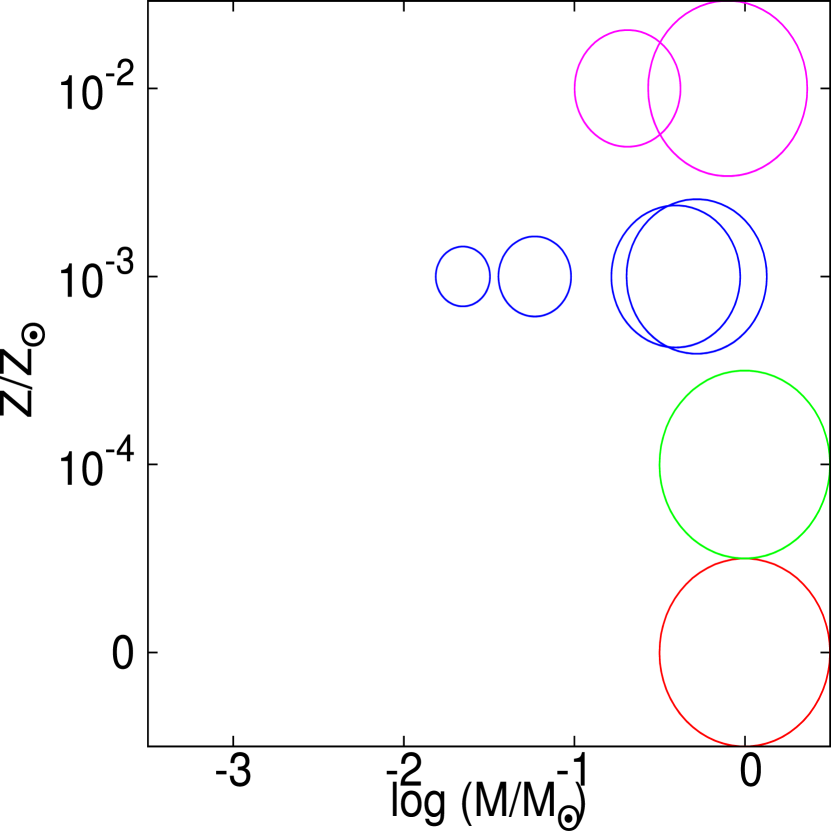
In order to locate fragments within our simulations, we employ an algorithm, based on Williams et al. (1994), that works by identifying isolated density countours. Before we search for clumps, we smooth the density field by assigning each grid-cell the mass-weighted mean density of the group of cells including itself and its neighbors within one cell-width. This serves to eliminate small density perturbations that would be misidentified as clumps by the code. In order to directly compare the fragmentation from each simulation, we limit the search for clumps to the 1 M⊙ of gas surrounding the cell with the highest density. On larger scales, all of the runs display a filamentary structure that is qualitatively similar. No other region in any of the simulation boxes has collapsed to densities comparable to those found within the region where the clump search is performed. The results are shown in Figure 3. A single clump exists in the metal-free and 10-4 Z⊙ simulations, containing 99.7% of the total mass within the region of interest. In the simulation with Z = 10-3 Z⊙, 91% of the mass is shared between two clumps with 0.52 M⊙ and 0.39 M⊙. In the same simulation, we also find two smaller clumps 0.06 M⊙ and 0.02 M⊙. Finally, in the Z = 10-2 Z⊙ simulation, we see two clumps with 0.79 M⊙ and 0.21 M⊙.
4 Discussion
We have shown, through three-dimensional hydrodynamic simulations, that fragmentation occurs in collapsing gas with metallicities, Z 10-3 Z⊙. Our results indicate that star-formation occurs in exactly the same manner at metallicity, Z = 10-4 Z⊙, as it does at zero metallicity. The similarities between the simulations with metallicities, Z = 10-3 Z⊙ and 10-2 Z⊙, suggest that the transition to low-mass star-formation is complete by 10-3 Z⊙, implying that the entire transition occurs over only one order of magnitude in metal abundance. More simulations, bracketing the metallicity range, 10-4 to 10-3 Z⊙, will test how abrupt the transition truly is. We will also explore the effect of non-solar abundances on the low metallicity IMF. It has been recently argued that dust cooling at high densities (n 1013 cm-3) can induce fragmentation for metallicities as low as 10-6 Z⊙ Schneider et al. (2006). In light of the work by Frebel et al. (2007), who note the absence of stars with Dtrans -3.5, where Dtrans is a measure of the combined logarithmic abundance of C and O, it seems unlikely that Zcr is this low. While the fragmentation mode discussed in Schneider et al. (2006), and also Omukai et al. (2005), may truly exist, it is possible that metal yields from Pop III supernovae overshoot this metallicity, for realistic mixing scenarios, leaving almost no star-forming regions with such a low concentration of heavy elements. Similar to our results, Omukai et al. (2005) note that only high-mass fragments are produced when Z = 10-4 Z⊙. If Pop III supernovae are able to immediately enrich the local universe to Z = 10-4 Z⊙, the high-density dust cooling fragmentation mode would be skipped altogether, and the high-mass stars that formed via the mode observed at 10-4 Z⊙ would leave no record in the search for low-metallicity stars in the local universe.
We have limited the search for fragments to the dense 1 M⊙ core at the center of each simulation. Within this region, it is unlikely that any more fragments will form in any of the simulations. In all of the cases presented, the cooling has begun to be overwhelmed by compression heating such that the central temperature is now increasing with increasing density, which was indicated by Larson (2005) to be the end of hierarchical fragmentation. Fragmentation may continue in the surrounding lower density gas in the cases of Z = 10-3 Z⊙ and 10-2 Z⊙. The final stellar masses of these objects will also be affected interaction and accretion that will occur in later stages of evolution. In the two lowest metallicity cases, the gas immediately surrounding the central core evolves slowly enough that it will not have sufficient time to reach high densities before the UV radiation from the central, massive star dissociates all of the H2. As was shown by Bromm et al. (2001), clouds with metallicities, Z 10-4 Z⊙ are unable to collapse without the aid of H2 cooling.
In the two simulations in which significant fragmentation is observed, Z = 10-3 and 10-2 Z⊙, the gas is able to cool rapidly to the temperature of the CMB. Wise & Abel (2005) predict that the rate of Pop III supernovae peaks at a redshift, z 20, and then drops off sharply, implying that metal production from Pop III stars is effectively finished at this point. In this epoch, the characteristic mass-scale for metal-enriched star formation will be regulated by the CMB, as is predicted in Bromm & Loeb (2003). Thus, the first Pop II stars will be considerably more massive, on average, than stars observed today, as was suggested by Larson (1998). Observations of low-mass prestellar cores in the local universe reveal them to have temperatures of about 8.5 K (Evans, 1999), implying that the IMF may not become completely ’normal’ until z 3 when the CMB fell below this temperature.
References
- Abel et al. (2002) Abel, T., Bryan, G. L., & Norman, M. L. 2002, Science, 295, 93
- Anninos et al. (1997) Anninos, P., Zhang, Y., Abel, T., & Norman, M. L. 1997, New Astronomy, 2, 209
- Bate et al. (2003) Bate, M. R., Bonnell, I. A., & Bromm, V. 2003, MNRAS, 339, 577
- Bromm et al. (2002) Bromm, V., Coppi, P. S., & Larson, R. B. 2002, ApJ, 564, 23
- Bromm et al. (2001) Bromm, V., Ferrara, A., Coppi, P. S., & Larson, R. B. 2001, MNRAS, 328, 969
- Bromm & Loeb (2003) Bromm, V. & Loeb, A. 2003, Nature, 425, 812
- Bryan & Norman (1997) Bryan, G. & Norman, M. L. 1997, in Workshop on Structured Adaptive Mech Refinement Grid Methods, ed. N. Chrisochoides, IMA Volumes in Mathematics No. 117 (Springer-Verlag)
- Chabrier (2003) Chabrier, G. 2003, PASP, 115, 763
- Eisenstein & Hu (1999) Eisenstein, D. J. & Hu, W. 1999, ApJ, 511, 5
- Evans (1999) Evans, II, N. J. 1999, ARA&A, 37, 311
- Ferland et al. (1998) Ferland, G. J., Korista, K. T., Verner, D. A., Ferguson, J. W., Kingdon, J. B., & Verner, E. M. 1998, PASP, 110, 761
- Frebel et al. (2007) Frebel, A., Johnson, J. L., & Bromm, V. 2007, ArXiv Astrophysics e-prints
- Heger & Woosley (2002) Heger, A. & Woosley, S. E. 2002, ApJ, 567, 532
- Kroupa (2002) Kroupa, P. 2002, Science, 295, 82
- Larson (1998) Larson, R. B. 1998, MNRAS, 301, 569
- Larson (2005) —. 2005, MNRAS, 359, 211
- Low & Lynden-Bell (1976) Low, C. & Lynden-Bell, D. 1976, MNRAS, 176, 367
- Miller & Scalo (1979) Miller, G. E. & Scalo, J. M. 1979, ApJS, 41, 513
- Omukai et al. (2005) Omukai, K., Tsuribe, T., Schneider, R., & Ferrara, A. 2005, ApJ, 626, 627
- O’Shea et al. (2005) O’Shea, B. W., Abel, T., Whalen, D., & Norman, M. L. 2005, ApJ, 628, L5
- O’Shea et al. (2004) O’Shea, B. W., G., B., Bordner, J., Norman, M. L., Abel, T., Harknes, R., & Kritsuk, A. 2004, in Lecture Notes in Computational Science and Engineering, Vol. 41, Adaptive Mesh Refinement - Theory and Applications, ed. T. Plewa, T. Linde, & V. G. Weirs
- Santoro & Shull (2006) Santoro, F. & Shull, J. M. 2006, ApJ, 643, 26
- Schneider et al. (2006) Schneider, R., Omukai, K., Inoue, A. K., & Ferrara, A. 2006, MNRAS, 369, 1437
- Shu (1977) Shu, F. H. 1977, ApJ, 214, 488
- Truelove et al. (1997) Truelove, J. K., Klein, R. I., McKee, C. F., Holliman, II, J. H., Howell, L. H., & Greenough, J. A. 1997, ApJ, 489, L179+
- Tsuribe & Omukai (2006) Tsuribe, T. & Omukai, K. 2006, ApJ, 642, L61
- Tumlinson et al. (2004) Tumlinson, J., Venkatesan, A., & Shull, J. M. 2004, ApJ, 612, 602
- Williams et al. (1994) Williams, J. P., de Geus, E. J., & Blitz, L. 1994, ApJ, 428, 693
- Wise & Abel (2005) Wise, J. H. & Abel, T. 2005, ApJ, 629, 615
- Yoshida et al. (2006) Yoshida, N., Omukai, K., Hernquist, L., & Abel, T. 2006, ApJ, 652, 6
| Table 1 | ||||||
|---|---|---|---|---|---|---|
| Simulation Final States | ||||||
| Z (Z⊙) | zcol | lmax | Grids | Cells | (cm-3) | tcol (Myr) |
| 0 | 18.231519 | 27 | 8469 | 4.82 | 4.11 | - |
| 10-4 | 18.838816 | 27 | 8060 | 4.64 | 3.90 | 9.19 |
| 10-3 | 19.336557 | 27 | 7911 | 4.56 | 1.65 | 16.21 |
| 10-2 | 20.032518 | 28 | 7521 | 4.42 | 1.50 | 25.33 |