11email: gag,zhar@astrosen.unam.mx
On the orbital period of the magnetic Cataclysmic Variable HS 0922+1333
Abstract
Context. The object HS 0922+1333 was visited briefly in 2002 in a mini survey of low accretion rate polars (LARPs) in order to test if they undergo high luminosity states similar to ordinary polars. On the basis of that short observation the suspicion arose that the object might be an asynchronous polar (Tovmassian et al. 2004). The disparity between the presumed orbital and spin period appeared to be quite unusual.
Aims. We performed follow-up observations of the object to resolve the problem.
Methods. New simultaneous spectroscopic and photometric observations spanning several years allowed measurements of radial velocities of emission and absorption lines from the secondary star and brightness variations due to synchrotron emission from the primary.
Results. New observations show that the object is actually synchronous and its orbital and spin period are equal to 4.04 hours.
Conclusions. We identify the source of confusion of previous observations to be a high velocity component of emission line arousing from the stream of matter leaving L1 point.
Key Words.:
stars: - cataclysmic variables - magnetic, individual: - stars: HS 0922+13331 Introduction
Magnetic cataclysmic variables (CV) are accreting binary systems in which material transfers from a dwarf secondary star onto a magnetic (5 B 250 MG) white dwarf (WD) through Roche lobe overflow. Polars or AM Her systems with magnetic fields larger than MG stand out among magnetic CVs because the spin period of the primary WD is synchronized with the orbital period of the system. Unlike non-magnetic or low-magnetic accreting binaries, they have neither a disk nor the capacity to accumulate the transferred matter, so the bulk of flux of these systems comes from the accretion flow, particularly around magnetic poles. Therefore, their luminosity is sensitive to the mass transfer rate . Polars are known to have highs and lows in their luminosity state, which is directly dependent on .
In recent years a number of polars were identified with extremely low accretion rates. They are commonly called LARPs, a name coined by Schwope et al. (schwope02 (2002)). Their mass accretion rate is estimated to be about a few M⊙/yr, two orders of magnitude below the average for CVs and they are distinguished for their prominent cyclotron emission lines on top of otherwise featureless blue continua. The first two LARPs, including the subject of this study, were discovered in the course of the Hamburg QSO survey, thanks to a broad variable feature in the spectra subsequently identified with cyclotron lines (Reimers et al. rehaho99 (1999); Reimers & Hagen reha00 (2000), hereafter RH). Later, another newly identified magnetic CV from the list of ROSAT sources (RX J1554.2+2721) was spotted in the low state with a spectrum identical to LARPs (Tovmassian et al. to01 (2001, 2004)). Intrigued by that discovery, we conducted a blitz campaign to check if canonical LARPs, namely HS 1023+3900 and HS 0922+1333, might be caught in a high state as well.
Since both objects had only recently been discovered and had very limited observational coverage, we obtained one full binary orbital period of spectral observations. Our instrumental setup provided higher spectral resolution than the original discovery observation by RH. We observed emission from the H line apparently arising from the irradiated surface of the secondary star facing the hot accreting spot on the WD and Na i infrared doublet from the cooler parts of the secondary star (Tovmassian et al. to04 (2004)). The derived radial velocity (RV) curve from that observation did not fold well with the period estimated in the discovery paper. However, the limited time coverage undermined our ability to measure the period properly. We could only state that the period might be exceeding what was reported by RH by at least 1.14 times, corresponding to Pspin/Porb=0.88. It should be noted that RH determined their period from the cyclotron hump cycles and thus, they measured the WD spin period rather than the binary orbital period. It would be quite usual to find some degree of de-synchronization between the spin period of the WD and orbital period. Nevertheless, the difference in periods was too large for an asynchronous polar and too small for an intermediate polar. The latter mostly follow the empirical ratio Pspin/P. In rare cases, Pspin/P (see e.g. Norton et al. norton (2004)). There are also theoretical restrictions on a kind of ratio that was indicated by our observation as evident from the Norton et al. (norton (2004)) paper. Therefore, we conducted a new series of observations in order to establish the orbital period of the compact binary and to classify it properly. This brief paper analyses a combined set of observations and discusses the reasons that led us to an erroneous conclusion in to04 (2004).
In Sect.2 we describe our observations and the data reduction. The data analysis and the results are presented in Sect.3, and conclusions are drawn in Sect.4.
| Date | HJD+ | Telescope | Instrument/Grating | Range/Band | Exp.Time | Duration |
|---|---|---|---|---|---|---|
| Spectroscopy | 24530000 | Num. of Integrations | ||||
| 2002 02 04 | 2309 | 2.1m | B&Ch1 600l/mm | 6200-8340Å | 900s19 | 4.5h |
| 2003-03-25 | 2723 | 2.1m | B&Ch 1200l/mm | 6100-7200Å | 900s13 | 3.3h |
| 2003-03-26 | 2724 | 2.1m | B&Ch 1200l/mm | 6100-7200Å | 900s6 | 1.3h |
| 2003-03-27 | 2725 | 2.1m | B&Ch 1200l/mm | 6100-7200Å | 900s15 | 2.6h |
| 2005-10-27 | 3670 | 2.1m | B&Ch 400l/mm | 6100-9200Å | 900s15 | 2.2h |
| 2005-10-29 | 3672 | 2.1m | B&Ch 400l/mm | 6100-9200Å | 900s11 | 1.7h |
| 2005-10-30 | 3673 | 2.1m | B&Ch 400l/mm | 6100-9200Å | 900s8 | 1.2h |
| 2006-01-18 | 3673 | 2.1m | B&Ch 400l/mm | 5800-8900Å | 1800s8 | 3.7h |
| Photometry | ||||||
| 2003-03-26 | 2724 | 1.5m | RUCA2 | R | 120s107 | 3.8h |
| 2003-03-27 | 2725 | 1.5m | RUCA | R | 120s99 | 3.4h |
| 2003-03-28 | 2726 | 1.5m | RUCA | R | 120s99 | 3.4h |
| 1 B&Ch - Boller & Chivens spectrograph (http://haro.astrospp.unam.mx/Instruments/bchivens/bchivens.htm) |
| 2 RUCA - CCD photometer (http://haro.astrospp.unam.mx/Instruments/laruca/laruca_intro.htm) |
2 Observations and reduction
Sets of observations were collected over a four-year period and analyzed. All observations of HS 0922+1333 reported here were obtained at the Observatorio Astrónomico Nacional San Pedro Martir, México. The B&Ch spectrograph installed at the 2.1 meter telescope was used for the extensive spectroscopy, while a 1.5 m telescope was used to obtain simultaneous photometry during the 2003 March run. In the first observations, upon which Tovmassian et al. (to04 (2004)) depended, we used a 600 l/mm grating centered in the optical IR range (6200 – 8340 Å) to achieve a spectral resolution of 4.2 Å FWHM in a sequence of 900 sec exposures covering one orbital period. The controversy over the periods led us to re-observe the object during three nights in March 2003. This time we utilized the highest available grating of 1200 l/mm. The spectral resolution reached 2.2 Å FWHM covering the 6100 – 7200 Å range. Later we collected more observations with lower resolution to refine the orbital period and properly classify the secondary star.
In all observations an SITe 24 m pixel CCD was used to acquire the data. The slit width was usually set to 20 and oriented in the E–W direction. He-Ar arc lamp exposures were taken at the beginning and end of each run for wavelength calibration.
In 2003 March observations we conducted simultaneously with differential photometry. Exposure times were 40–60 sec with an overall time resolution of about 80–100 sec using the Johnson-Cousins Rc filter.
The reduction of data was done in a fairly standard manner. The bulk of reduction was performed using IRAF111http://iraf.noao.edu procedures, except for removing of cosmic rays by a corresponding program in MIDAS222ESO-MIDAS is the acronym for the European Southern Observatory Munich Image Data Analysis System which is developed and maintained by the European Southern Observatory, as this is an easier and more reliable tool. The biases were taken at the beginning and end of the night and were subtracted after being combined using the CCD overscan area for control of possible temperature-related variations during the night. We did not do flat field correction for spectral observations and used blank sky images taken at twilight for direct images. The flux calibration was done by observing a spectrophotometric standard star. Feige 34 was observed during a 2002 run and G191-B2B during the rest of the observations.
The wavelength calibration is routinely done by observing a He–Ar arc lamp at the beginning and end of a sequence on the object or every 2 hours if the sequence is too long. Then the wavelength solutions calculated for each arc-lamp exposure and an average of preceding and succeeding images are applied to the object observed in between. The wavelength solutions are usually good to a few 1/10 of an Angstrom, while deviations due to the telescope position and flexations of the spectrograph can exceed that by an order of magnitude. Usually, that does not pose a problem since we work with moderate resolutions and the amplitude of radial velocity variation is on the order of hundreds of km/sec. The sensible way of checking and correcting wavelength calibration is to measure the night sky lines. We measured several lines by selecting unblended ones located close to H and Na I. The measurements of sky lines show a clear trend and indicate the scale of errors that one can incur depending on the telescope inclination. Although the trend is unusually steep, reaching 30 km/sec over 4 hours of observation, the scatter of points around a linear fit is relatively small, which defines the error of the measurements (rms) and is 8 km/sec. Nevertheless, the error bars in the corresponding plots reflect the entire range of deviation just to demonstrate the scale of corrections applied to the data. The deviations of the linear fit to the measured night sky lines (with an average of 2 night sky lines around each measured line) from the rest value were used to correct the wavelength calibration by the corresponding amount.

3 Orbital period and system parameters
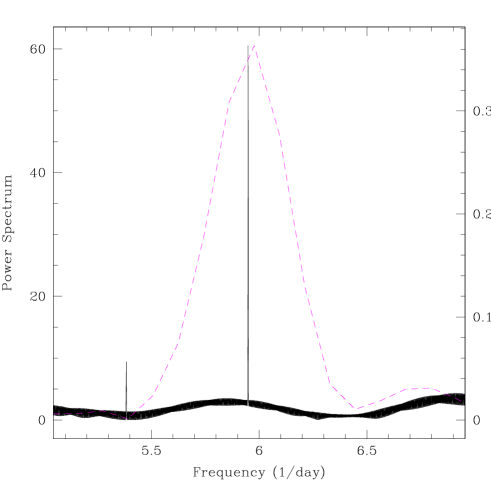
We measured the H line in the 2002 spectra with single Gaussian fits. The resulting RV curve was reasonably smooth and sinusoidal, but the ends of the curve would not overlap when folded with the period reported by RH (see Fig. 5 in to04 (2004)). We speculated that the actual orbital period is longer than the one derived from the photometry. However, the measurements of new spectra obtained in 2003 do not show such a large discrepancy, and the period analysis of the combined dataset easily reveals that the true period is indeed 4.0395 hours and coincides with the photometric period derived from the synchrotron lines variability within errors of measurement. The combination of data taken years apart and several nights in a row each year allowed us to determine the period very precisely. We applied the CLEAN procedure (Roberts et al. clean (1987)) to sort out the alias periods resulting from the uneven data sampling and daily gaps and obtained a strong peak in the power spectrum at the cycles/day, corresponding to a hour period (see Fig. 1). Simultaneous with spectroscopy, we obtained photometry in Rc band that partially includes the strongest cyclotron line. It is a dominant contributor to the light curve (Fig.2), so we can use it to determine the spin period of the WD. The power spectrum calculated from photometry gives exactly the same result, but the peak is broader, because the data lacks a longer time base. In Fig.1 the power spectra of spectral and photometric data are presented together.
It is clear that this system is a synchronous magnetic cataclysmic variable. The spin period of its white dwarf primary is locked with the orbital and is not shorter, as suspected earlier. We explored the cause of confusion. First of all, we corrected all measured radial velocities using the night sky lines to remove the trends. This decreased the gap a little between points in the 2002 data in phases 0.0 through 0.2 where they were not overlapping. But even taking errors related to the wavelength calibration into account, they still do not fold properly (see the open (blue) square symbols in Fig.3). What is more interesting, however, is that the amplitude of the radial velocity variation has a much higher value in the 2002 data than in 2003 data, as measured with single Gaussians. The careful examination of the 2003 data, with twice the spectral resolution than in 2002, reveals that at the bottom of the H emission line there is a weak and broad bump present in most phases. We de-blended the H line from 2003 observations using two Gaussian components in the IRAF splot procedure. The result is shown on the right side of the left panel of Fig.3 only (positive phases). The strong, narrow component basically coincides with the single Gaussian measurements. But the weak broad component appears to show a much larger amplitude and reveals itself mainly between phases 0.3 through 0.9. This component is clearly identified as the heated matter leaving the Lagrangian L1 point, the nozzle where the accretion stream forms. Outflowing matter has intrinsic velocity, so at phase 0.75 when the secondary star reaches maximum velocity toward the observer, it tilts the weight of the emission line toward larger velocity. Its phasing appears to be similar to a high-velocity component (HVC) detected routinely in polars (Schwope et al. schwope (1997), Tovmassian et al. tov (1999)) that originates in the ballistic part of the stream. In the lower-resolution spectra this component could not be separated, therefore the radial velocity curve became stretched and deformed. That and the short time coverage limited to just a little over one orbital period led to the misinterpretation of the 2002 spectral data. It is very interesting that we were able to distinguish the accretion flow onset. So far these objects have been known to show only the synchrotron humps as an evidence of accretion processes taking place in them (Schwope et al. schwope02 (2002)).
The RV curve derived from sodium lines (see Fig.3) gives the measure of the rotation of the center of mass of the secondary in the orbital plane, while the narrow component of the H line originates from the front side of the elliptically distorted secondary. The ephemerides of HS 0922+1333 from the RV measurements can be described as
where corresponds to the crossing of the RV curve as follows from the fitting of sinusoid to the RV measurements of H and sodium lines separately according to the following equation:
Corresponding numbers derived from the fitting are presented in the Table 2. Unfortunately, due to the large errors there is no marked difference between the semi-amplitude of radial velocities between H and Na I lines. Otherwise, knowing the spectral type of the secondary, we could deduce the basic parameters of the binary since that difference reflects the size of the Roche lobe of the secondary.
| Line | K | Residuals | |
|---|---|---|---|
| km/sec | km/sec | km/sec | |
| H | 36.67 | 13212 | 25.1 |
| Na I 8185Å | -8111 | 16217 | 29.5 |
| Na I 8197Å | -6513 | 13920 | 32.7 |
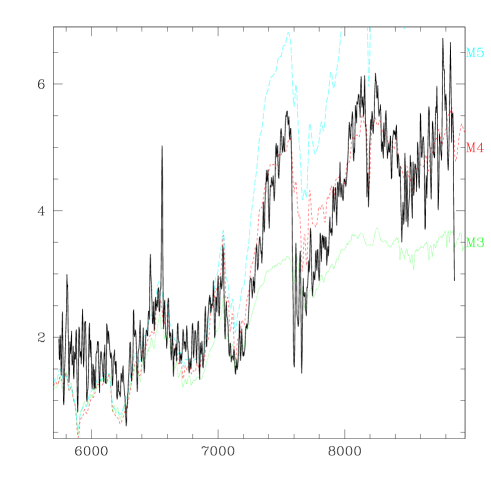
The spectrum of the secondary in the absence of an accretion disk is clearly seen, and in the phases when the magnetic accreting spot that is radiating strong synchrotron emission is self-eclipsed, one can see undisturbed secondary spectrum in the near infrared range. In the Fig. 4 the flux calibrated spectrum of the object obtained at phase 0.5 is presented. Overplotted are standard spectra of M3 to M5 main sequence stars (Pickles uksp (1998)) normalized to the object. The WD’s contribution has not been removed. However, at wavelengths above 6500 Å, its contribution is apparently insignificant and a good accordance emerges between the object and M4 V standard star. This is also consistent with what is expected from the Porb - spectral type II relation (Beuermann beu (2000)), although the secondary is a M3.5 star according to RH.
The masses of secondaries in systems with periods similar to HS 0922+1333 range from 0.35 to 0.42 M⊙, in those cases where the mass could be estimated precisely. Such a secondary would follow the empirical mass-period and radius-period relations from Smith & Dhillon (smdhi (1998))
| (1) |
Observations with higher resolution in the near IR will permit investigators to precisely measure the difference between the RV of H originating at the facing side of the secondary and sodium absorption lines reflecting the motion of the center of mass. Subsequently, it should allow for estimating the observed radius of the star to check the possibility that it fills the Roche lobe. For now, we can only assume that the mass transfer proceeds in a way similar to other polars, based on the detection of a high velocity component in the emission line. Its presence can also be illustrated by constructing Doppler tomograms.
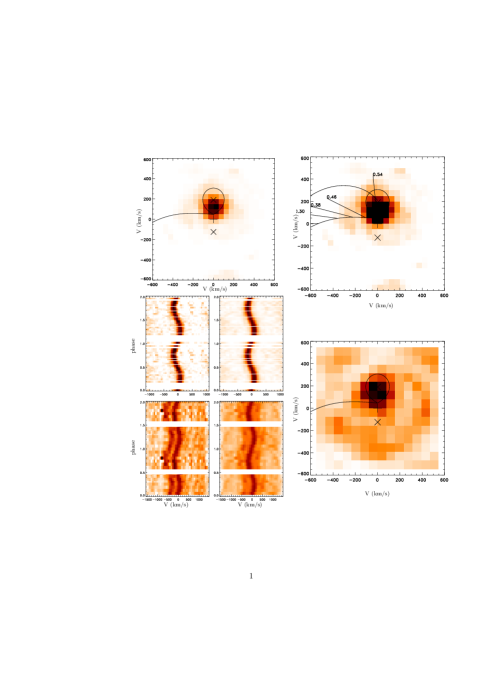
Doppler tomography (Marsh & Horne Marsh88 (1988); Marsh Marsh02 (2001)) is a powerful tool in cases like this, where the origin of line profiles is bound to the orbital plane and the system has relatively high inclination. We constructed Doppler maps, or tomograms, using both the H emission line and the Na I absorption line to prove the accuracy of our estimate of the binary parameters. The tomograms in Fig.5 show that the H line is mostly confined to the front side of the secondary, while the sodium absorption fills the entire body of the secondary. However, the difference is not very obvious. The reason for that appears to be the the lower spectral resolution and fewer spectra employed.
4 Conclusions
-
1.
We have determined the 4.0395 hours spectroscopic period of the LARP HS 0922+1333 based on the radial velocity measurements of H emission line originating at the irradiated secondary star. The derived value coincides within measurement errors with the spin period of the system, thus proving that the object is a synchronized polar.
-
2.
The profiles of the H emission line in higher-spectral resolution observations turned out to be complex. They are formed basically on the irradiated surface of the secondary star, but they also show a small contribution from the matter in close proximity to the L1 point. The matter escaping the secondary shows RVs with higher velocity and a different phase.
-
3.
The Doppler tomograms tend to confirm detection of a stream of transfer matter.
The parameters of the system that we have obtained are interesting in the context of the model proposed by Webbink and Wickramasinghe (ww2005 (2005)). According to it, the LARPs are relatively young and are still approaching their first Roche lobe overflow. The accretion is due to the capture of the wind material from the secondary by the strong magnetic field of the primary. We think that we see evidence of a faint stream common to the polars that transfer material through the L1 point which is usually due to the Roche lobe overflow. However, the wind will probably also cause a flow of matter through the same trajectory, so it is difficult to say if the observation runs against the model. The precise measurement of the secondary star size may help to clarify this.
Acknowledgements.
This study was supported partially by grant 25454 from CONACyT. GT acknowledges the UC-MEXUS fellowship program enabling him to visit CASS UCSD. The authors are grateful to the anonymous referee for careful reading of the manuscript and valuable comments. We thank L.Valencic for help in language related issues.References
- (1) Beuermann, K. 2000, New Astronomy Review, 44, 93
- (2) Demircan, O., & Kahraman, G. 1991, Ap&SS, 181, 313
- (3) Marsh, T. R., Horne, K. 1988, MNRAS, 235, 269
- (4) Marsh, T. R. 2001, ”Doppler Tomography”, Astrotomography, Indirect Imaging Methods in Observational Astronomy, Edited by H.M.J. Boffin, D. Steeghs and J. Cuypers, Lecture Notes in Physics, vol. 573, p.1
- (5) Norton, A. J., Wynn, G. A., & Somerscales, R. V. 2004, ApJ, 614, 349
- (6) Pickles, A. J. 1998, PASP, 110, 863
- (7) Roberts, D. H., Lehar, J., Dreher, J. W. 1987, AJ, 93, 968
- (8) Reimers, D., & Hagen, H.-J. 2000, A&A, 358, L45
- (9) Reimers, D., Hagen, H.-J., & Hopp, U. 1999, A&A, 343, 157
- (10) Schwope, A. D., Mantel, K.-H., & Horne, K. 1997, A&A, 319, 894
- (11) Schwope, A. D., Brunner, H., Hambaryan, V., & Schwarz, R. 2002, ASP Conf. Ser. 261: The Physics of Cataclysmic Variables and Related Objects, 261, 102
- (12) Smith, D. A., Dhillon, V. S. 1998, MNRAS, 301, 767
- (13) Tovmassian, G. H., et al. 1999, ASP Conf. Ser. 157: Annapolis Workshop on Magnetic Cataclysmic Variables, 157, 133
- (14) Tovmassian, G. H., Greiner, J., Zharikov, S. V., Echevarría, J., & Kniazev, A. 2001, A&A, 380, 504
- (15) Tovmassian, G., Zharikov, S., Mennickent, R., & Greiner, J. 2004, ASP Conf. Ser. 315: IAU Colloq. 190: Magnetic Cataclysmic Variables, 315, 15
- (16) Warner, B. 1995, Cataclysmic variable stars, Cambridge Astrophysics Series, Cambridge, New York: Cambridge University Press, 1995
- (17) Webbink, R. F., & Wickramasinghe, D. T. 2005, Astronomical Society of the Pacific Conference Series, 330, 137