Star formation and the growth of stellar mass
Abstract
Recent observations have demonstrated a significant growth in the integrated stellar mass of the red sequence since , dominated by a steadily increasing number of galaxies with stellar masses . In this paper, we use the COMBO-17 photometric redshift survey in conjunction with deep Spitzer 24µm data to explore the relationship between star formation and the growth of stellar mass. We calculate ‘star formation rate functions’ in four different redshift slices, splitting also into contributions from the red sequence and blue cloud for the first time. We find that the growth of stellar mass since is consistent with the integrated star formation rate. Yet, most of the stars formed are in blue cloud galaxies. If the stellar mass already in, and formed in, blue cloud galaxies were to stay in the blue cloud the total stellar mass in blue galaxies would be dramatically overproduced. We explore the expected evolution of stellar mass functions, finding that in this picture the number of massive blue galaxies would also be overproduced; i.e., most of the new stars formed in blue cloud galaxies are in the massive galaxies. We explore a simple truncation scenario in which these ‘extra’ blue galaxies have their star formation suppressed by an unspecified mechanism or mechanisms; simple cessation of star formation in these extra blue galaxies is approximately sufficient to build up the red sequence at .
1 Introduction
Understanding where and when the stars in galaxies form is one of the key goals of observational extragalactic astronomy. In the last decade, magnificent progress has been made towards this goal, with the construction of large galaxy redshift surveys allowing the evolution of cosmic star formation rate (e.g., Madau et al., 1996; Lilly et al., 1996; Steidel et al., 1999; Flores et al., 1999; Haarsma et al., 2000; Hopkins, 2004; Le Floc’h et al., 2005) and the build-up of stellar mass (e.g., Brinchmann & Ellis, 2000; Cole et al., 2001; Dickinson et al., 2003; Rudnick et al., 2003, 2006; Fontana et al., 2004, 2006; Drory et al., 2004, 2005; Borch et al., 2006) to be estimated. Overall, if one assumes an stellar initial mass function with a power-law slope similar to a Salpeter (1955) value for masses , which is universally-applicable on galaxy-wide scales (see, e.g., Elmegreen, 2006, for a critical discussion of this issue), the evolution of total stellar mass in the universe is reasonably well-reproduced by the integrated cosmic-averaged star formation rate (SFR), provided that one accounts for stellar mass loss (Cole et al., 2001; Rudnick et al., 2003; Borch et al., 2006).
It has also become clear that there is a bimodal distribution of galaxy colors at all , with a relatively narrow red sequence dominated by non-star-forming galaxies and a blue cloud of star-forming galaxies (Strateva et al., 2001; Blanton et al., 2003; Bell et al., 2004; Willmer et al., 2006, see Fig. 1). More recently, is has been demonstrated that the stellar mass on the red sequence has built up by a substantial amount — at least 50% of the stellar mass in present-day red sequence galaxies has come into place since (Chen et al., 2003; Bell et al., 2004; Faber et al., 2006; Borch et al., 2006; Brown et al., 2006). Given that relatively few stars form in red-sequence galaxies, this build-up has been argued to be driven by the global suppression of star formation in some fraction of previously blue, star-forming galaxies through a variety of possible physical processes, e.g., galaxy merging, the suppression of star formation in dense environments, or gas consumption by star-forming disks.
Yet, this qualitative picture leaves many questions unanswered. What is the contribution of dust-obscured star formation in red galaxies to the growth of stellar mass on the red sequence? Can simple truncation of star formation in some fraction of blue galaxies provide enough stellar mass to feed the growth of the red sequence? The ‘average’ disk galaxy is several times less massive than typical red sequence galaxies; is it possible to create early-type galaxies through truncation of star formation in the presumably rather low-mass blue cloud population?
In this paper, we present a first, crude attempt at addressing some of these questions. We combine color-split stellar mass functions (Borch et al., 2006) from the COMBO-17 photometric redshift survey (Wolf et al., 2003, 2004) with SFR functions derived from ultraviolet (UV) and infrared (IR) luminosities of galaxies in COMBO-17 (see, e.g., Le Floc’h et al., 2005, for IR luminosity functions derived using spectroscopic redshifts and COMBO-17 redshifts). While both stellar masses and SFRs are model-dependent, depend on the assumption of a universally-applicable galaxy-scale stellar initial mass function (IMF), and suffer from considerable systematic and random uncertainties, such an analysis allows one to explore the growth of stellar mass with cosmic time and attempt to understand in which types of galaxies the bulk of stellar mass forms, and in which types of galaxies most stellar mass ends up. While necessarily qualitatitive, such an approach gives interesting insight into some of the basic features of the physical processes which drive galaxy evolution.
The plan of this paper is as follows. In §2, we describe the COMBO-17 redshift survey data, the construction of stellar masses, and the estimation of SFR functions using Spitzer and COMBO-17 data; this section includes the first estimate of a key observational constraint on this analysis — the estimation of SFR functions split by galaxy color, as a function of cosmic epoch. In §3, we explore the growth of the total stellar mass densities in red and blue galaxies, and how this growth relates to observed star formation in the red and blue galaxy populations. In §4, we explore the evolution of the stellar mass functions of red and blue galaxies, and explore how one might expect the stellar mass function to evolve under various simplistic assumptions. These results are discussed in §5. In this paper, we adopt a km s-1 Mpc-1, and cosmology, and assume that the distribution of stellar masses formed follows a Chabrier (2003) stellar IMF, averaged over galaxy scales; such a stellar IMF gives stellar masses and SFRs consistent with a Kroupa (2001) IMF to within 10%.
2 The Data
2.1 COMBO-17 and stellar masses
To date, COMBO-17 has fully surveyed three disjoint southern and equatorial fields to deep limits in 5 broad and 12 medium passbands. Using these deep data in conjunction with non-evolving galaxy, star, and AGN template spectra, objects are classified and redshifts assigned for % of the objects to a limit of . Typical galaxy redshift accuracy is (Wolf et al., 2004), allowing construction of mag accurate rest-frame colors and absolute magnitudes (accounting for distance and -correction uncertainties). Astrometric accuracy is ″.
Borch et al. (2006) estimated the stellar mass of galaxies in COMBO-17 using the 17-passband photometry in conjunction with a non-evolving template library derived using the Pégase stellar population model (see Fioc & Rocca-Volmerange, 1997, for a description of an earlier version of the model). The masses were derived using a Kroupa et al. (1993) stellar IMF; the use of a Kroupa (2001) or Chabrier (2003) IMF would have yielded stellar masses to within %. Such masses are quantitatively consistent with those derived using a simple color-stellar M/L relation (Bell et al., 2003), and comparison of stellar and dynamical masses for a few early-type galaxies yielded consistent results to within their combined errors (see Borch et al., 2006, for more details). Random stellar mass errors are dex on a galaxy-by-galaxy basis, and systematic errors in the stellar masses (setting the overall mass scale and its redshift evolution) were argued to be at the 0.1 dex level for galaxies without ongoing or recent major starbursts; for galaxies with strong bursts, masses could be overestimated by dex. In particular, the masses are derived using template stellar populations with an age/metallicity combination equivalent to roughly solar metallicity and Gyr since the start of star formation (Borch et al., 2006); the templates do not evolve with redshift. While such a template set is appropriate for galaxies at (assuming that star formation starts at for most massive galaxies), galaxies at lower (higher) redshifts will have older (younger) underlying populations. This leads to small, second-order offsets in stellar M/L at a given ‘color’111The first order reddening of the stellar populations as the Universe ages is accounted for as the aged galaxy will be fit by a redder template. This second order effect comes about because the older, lower redshift galaxies will have a somewhat larger underlying old population (carrying more mass for a given amount of light) than its equivalent galaxy with similar colors at high redshift/earlier times.. As discussed in Bell & de Jong (2001) and Borch et al. (2006, see their Fig. 6), we expect that in our case this would lead to a slight underestimate (overestimate) of stellar masses at lower (higher) redshifts at the level. This has the effect that the internal evolution of mass density within COMBO-17 will be artificially flattened. We have chosen not to apply a correction for this oversimplification in what follows to remain consistent with Borch et al. (2006).
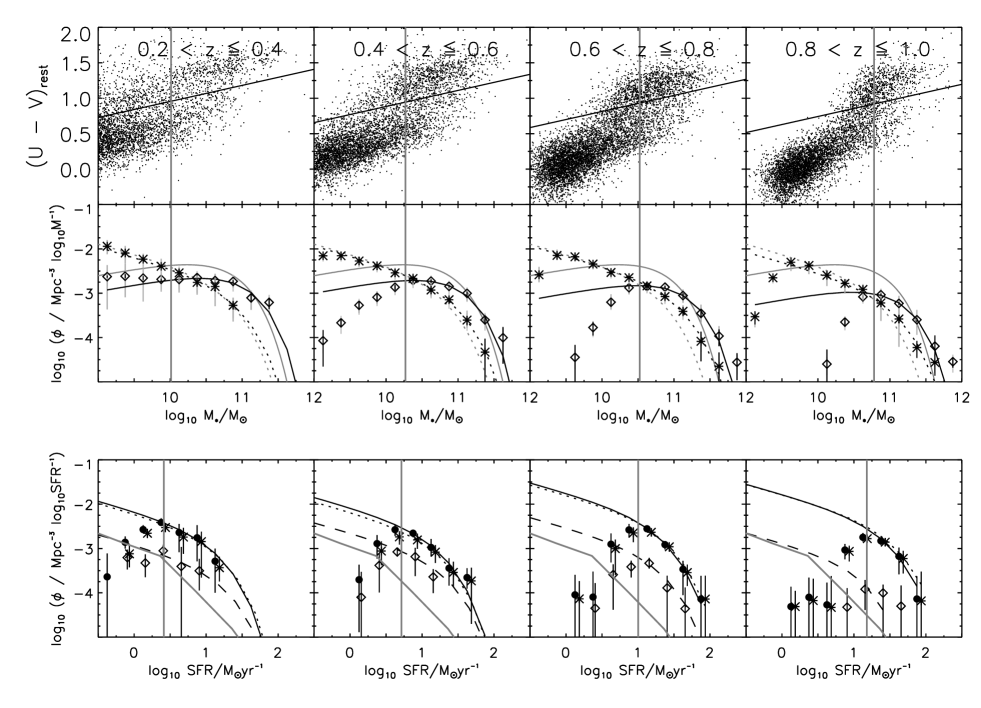
Stellar mass functions were derived for COMBO-17 in four redshift shells: , , , and . Mass-limited subsamples were constructed in each redshift interval: the limiting mass at each redshift was: (see Borch et al., 2006, for details of the calculation and discussion of the limiting stellar masses). Mass functions (i.e., the comoving space density of galaxies as a function of their stellar mass) were calculated for galaxies above this limiting mass (i.e., no corrections were applied, as the sample is volume-limited within this redshift shell, above this mass limit). Schechter functions were fit to the mass functions above their respective mass limits for three different cases: all galaxies, blue cloud galaxies only, and red sequence galaxies only. The stellar mass functions for blue cloud galaxies are complete well below this formal mass limit (owing to the low optical stellar M/L ratios of blue galaxies), therefore the extent to which the fitted mass function follows the data points below this mass limit is a test of the validity of our assumed faint-end slope at each redshift of interest. In each case, a different faint end slope was assumed: for all, blue and red galaxies respectively. These choices were motivated by the stellar mass functions of Bell et al. (2003): we adopt their stellar mass function for the local value in this work. Galaxies were assigned to the red sequence using the approximate222Owing to slight calibration differences between the fields, the detailed red sequence cut is field dependent, with the intercept at and being 1.01, 1.06 and 1.11 in the CDFS, A901 and the S11 fields respectively (see Wolf et al., 2003, for a definition of the fields). cut . The results are shown in Fig. 1. It is worth noting that the overall stellar mass functions are in excellent agreement with previous determinations (see Borch et al., 2006), with the advantage of tracking the evolution of red sequence and blue cloud galaxies separately.
2.2 MIPS 24µm data and star formation rates
Spitzer has observed two of the COMBO-17 fields: a field around the extended Chandra Deep Field South (CDFS) in January and February 2004 as part of the time allocated to the Spitzer Guaranteed Time Observers (GTOs), and a similarly-sized field around the Abell 901/902 galaxy cluster (A901) in December 2004 and June 2005 as part of Spitzer GO-3294 (PI: Bell). In both cases, MIPS 24µm data were taken in slow scan-map mode, with individual exposures of 10 s. We reduced the individual image frames using a custom data-analysis tool (DAT) developed by the GTOs (Gordon et al., 2005). The reduced images were corrected for geometric distortion and combined to form full mosaics. The final mosaic has a pixel scale of pixel-1 and an image PSF FWHM of ″. Source detection and photometry were performed using techniques described in Papovich et al. (2004); based on the analysis in that work, we estimate that our source detection is 80% complete at 83 Jy in the 24µm image in both the CDFS and A901 for a total exposure of s pix-1.
In order to interpret the observed 24µm emission, we must match the 24µm sources to galaxies for which we have redshift estimates from COMBO-17. In both the CDFS and A901 fields, we adopt a 1′′ matching radius. In the areas of the CDFS (A901) fields where there is overlap between the COMBO-17 redshift data and the full-depth MIPS mosaic, there are a total of 3255 (4251) 24µm sources with fluxes in excess of 83Jy. In both fields, 70% of the 24µm sources with fluxes Jy are detected by COMBO-17 in at least the deep -band, with . Some 35% of the 24µm sources have bright and have photometric redshift ; these 35% of sources contain nearly half of the total 24µm flux in objects brighter than 83Jy. Sources fainter than contain the other half of the Jy 24µm sources; investigation of COMBO-17 lower confidence photometric redshifts, their optical colors, and results from other studies lends weight to the argument that essentially all of these sources are at , with the bulk lying at (e.g., Le Floc’h et al. 2004; Papovich et al. 2004; see Le Floc’h et al. 2005 for a further discussion of the completeness of redshift information in the CDFS COMBO-17 data). Given the low-confidence COMBO-17 redshifts in hand, we estimate at dex incompleteness in this bin, and negligible incompleteness in the bins.
The goal of our analysis of the 24µm data is to obtain estimates of SFR which account for both unobscured (via the UV) and dust-obscured star formation (via the thermal IR). Ideally, we would have a measure of the total thermal IR flux from 8–1000µm; instead, we have an estimate of IR luminosity at one wavelength, 24µm, corresponding to rest-frame 20–12µm at the redshifts of interest . Yet, local IR-luminous galaxies show a surprisingly tight correlation between rest-frame 12–15µm luminosity and total IR luminosity (e.g., Spinoglio et al., 1995; Chary & Elbaz, 2001; Roussel et al., 2001; Papovich & Bell, 2002), with a scatter of dex. Following Papovich & Bell (2002), we choose to construct total IR luminosity from the observed-frame 24µm data. We use the Sbc template from the Devriendt et al. (1999) SED library to translate observed-frame 24µm flux into the 8–1000µm total IR luminosity333Total 8–1000µm IR luminosities are dex higher than the 42.5–122.5µm luminosities defined by Helou et al. (1988), with an obvious dust temperature dependence.; such a template is found to reproduce well the average 70µm and 160µm fluxes of galaxies with (Zheng et al., 2007a). The IR luminosity uncertainties are primarily systematic. Firstly, there is a natural diversity of IR spectral shapes at a given galaxy IR luminosity, stellar mass, etc.; one can crudely estimate the scale of this uncertainty by using the full range of templates from Devriendt et al. (1999), or by using templates from, e.g., Dale et al. (2001) instead. This uncertainty is 0.3 dex. Secondly, it is possible that a significant fraction of galaxies have IR spectral energy distributions not represented in the local Universe: while it is impossible to quantify this error until the advent of Herschel Space Telescope, current results suggest that the bulk of intermediate–high redshift galaxies have IR spectra similar to galaxies in the local universe (Appleton et al., 2004; Elbaz et al., 2005; Yan et al., 2005; Zheng et al., 2007a).
We estimate SFRs using the combined directly-observed UV light from young stars and the dust-reprocessed IR emission of the sample galaxies (e.g., Gordon et al., 2000). Following Bell et al. (2005), we estimate SFR using a calibration derived from Pégase assuming a 100 Myr-old stellar population with constant SFR and a Chabrier (2003) IMF:
| (1) |
where is the total IR luminosity (as estimated above) and is a rough estimate of the total integrated 1216Å–3000Å UV luminosity, derived using the 2800Å rest-frame luminosity from COMBO-17 . The factor of 1.5 in the 2800Å-to-total UV conversion accounts for the UV spectral shape of a 100 Myr-old population with constant SFR, and the UV flux is multiplied by a factor of 2.2 before being added to the IR luminosity to account for light emitted longwards of 3000Å and shortwards of 1216Å by the unobscured young stars. This SFR calibration is derived using identical assumptions to Kennicutt (1998), and the calibration is consistent with his to within 30% once different IMFs are accounted for. Uncertainties in these SFR estimates are no less than a factor of two in a galaxy-by-galaxy sense, and systematic uncertainty in the overall SFR scale is likely to be less than a factor of two (see, e.g., Bell, 2003; Bell et al., 2005, for further discussion of uncertainties).
Under the assumption that the bulk of 24µm emission comes from star formation, not AGN activity444Less than 15% of the total 24µm emission at is in X-ray luminous AGN (e.g., Silva, Maiolino, & Granato, 2004; Bell et al., 2005; Franceschini et al., 2005; Brand et al., 2006). Although some Compton-thick AGN will be missed in such a census (e.g., Donley et al., 2005; Martínez-Sansigre et al., 2006; Alonso-Herrero et al., 2006), a fraction of the 24µm emission in galaxies with AGN is powered by star formation. Thus, it is likely that % of the 24µm emission is from AGN; such a contamination is a small uncertainty compared to others inherent to this analysis, and does not affect our conclusions. we proceed to calculate SFR functions in a similar fashion to the stellar mass function. Limiting star formation rates were defined for each redshift bin: these are for respectively. Again, the sample is volume-limited in each redshift shell down to that limiting SFR. The SFR functions are calculated separately for all galaxies, blue cloud galaxies and red sequence galaxies respectively. In this contribution, we choose to adopt a Schechter function fit to the star formation rate function555In the local Universe, a Schechter function is a poor fit to the IR luminosity function (denoted in the lower panels of Fig. 1 by a dark gray line). Our measurements have a modest dynamic range in SFR, and the data can be well-fit with either a Schechter function or a double power-law. In this paper, we choose to adopt a Schechter function fit with faint end slope in order to ensure consistent behavior and extrapolations of the mass functions and SFR functions. Fitting with a double power-law would not affect the results presented in this paper to within the uncertainties. , adopting a faint end slope , noting that the total SFR density is strongly dominated by the contribution of blue galaxies (see Fig. 1)666Schechter functions are fit explicitly to all galaxies and the blue galaxy populations; the red galaxy SFR function is estimated by subtracting the contribution of the blue galaxies from all galaxies.. The best-fit parameters for these SFR functions is given in Table 1.
| Mpc | Mpc-3 | ||||
|---|---|---|---|---|---|
| All Galaxies | |||||
| 0.2 | 0.4 | 9.8(6.0) | 1.11(27) | 1.45 | 0.020(8) |
| 0.4 | 0.6 | 10.7(1.5) | 1.20(15) | 1.45 | 0.027(4) |
| 0.6 | 0.8 | 21(5) | 1.29(12) | 1.45 | 0.065(8) |
| 0.8 | 1.0 | 17(6) | 1.42(15) | 1.45 | 0.072(7) |
| Blue cloud | |||||
| 0.2 | 0.4 | 8.3(4.9) | 1.09(34) | 1.45 | 0.016(8) |
| 0.4 | 0.6 | 8.3(2.0) | 1.16(17) | 1.45 | 0.020(6) |
| 0.6 | 0.8 | 17(5) | 1.29(15) | 1.45 | 0.055(8) |
| 0.8 | 1.0 | 15(6) | 1.45(15) | 1.45 | 0.068(7) |
In §4, we make use of average SFRs for galaxies in given bins of stellar mass. These average SFRs are calculated following Zheng et al. (2006), and the methodology and results are discussed in detail in Zheng et al. (2007b). Briefly, those galaxies in a given bin in stellar mass which were not individually-detected at 24µm were stacked, and a total 24µm flux from individually-undetected sources determined. The total flux from individually-detected sources was then added, and the average flux calculated. These average fluxes were converted into an IR luminosity, combined with UV luminosities, and were then used to construct SFR estimates following the above transformations. Uncertainties in average fluxes were determined by bootstrapping.
3 Comparison of integrated stellar mass and star formation rate densities
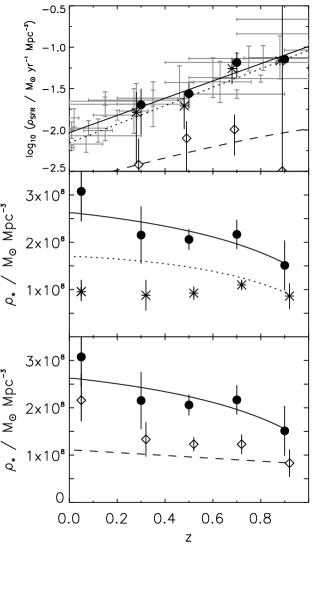


It is useful to establish the basic phenomenology by comparing the evolution of the integrated stellar mass density of the universe with the integral of the star formation rate. To parameterise the evolution of the total SFR, we derive the following best fit to all total SFR points shown in Fig. 2, weighting equally (i.e., our measurements are included on an equal footing to literature measurements): . This linear fit, shown in Fig. 2 as the solid line, appears a reasonable parameterization of the data. In order to track the fraction of star formation in red galaxies, we fit a linear function to the fraction of star formation in red sequence galaxies as a function of redshift: , defined only over the interval . The blue fraction . Again, these parameterizations appear to be a reasonable description of the data.
The result of this exercise is shown in Fig. 2. In the upper panel of Fig. 2 we show the evolution of the cosmic star formation rate; all galaxies are shown as gray error bars (adapted from a compilation from Hopkins 2004) and solid circles (our measurements), asterisks denote our measurements for blue cloud galaxies, and diamonds denote our measurements from red sequence galaxies. In the the lower panels of Fig. 2, we show the evolution of the integrated stellar mass density of the Universe (tabulated in Borch et al., 2006, solid circles), along with the integral of the total star formation rate (solid line), accounting for gas recycling using the Pégase stellar population synthesis code (see Fioc & Rocca-Volmerange, 1997, for a description of an earlier version of this model). One can clearly see that, if one assumes a universally-applicable Chabrier (2003) stellar IMF, that the star formation rate and the growth of stellar mass paint a consistent picture, with around 40% of all stellar mass being formed at .
Yet, when one splits the galaxy population into red and blue galaxies, an interesting phenomenology emerges. It is clear that blue galaxies contain much of the UVIR-inferred star formation at every epoch. If one assumes that blue galaxies will stay blue at all times, one can integrate the SFR to predict the growth of the stellar mass in blue cloud galaxies: the result is shown in Fig. 2 as the dotted line. It is clear that while the bulk of the stars are formed in blue galaxies (as traced by the UVIR), there is little growth in the total stellar mass in blue galaxies with cosmic time. Instead, the bulk of the growth in stellar mass is in red sequence (i.e., largely non-star-forming) galaxies. Blue, star-forming galaxies are shutting off their star formation on global scales and are fading onto the red sequence.
4 Where is this mass transfer occurring?
Further insight into the evolution of stellar mass in red and blue galaxies can be gained by examining the evolution of their stellar mass functions. While such mass functions are well-defined only above (the mass limit at ), this exercise gives some insight into the characteristics of the galaxies which are transferred onto the red sequence from to the present-day.
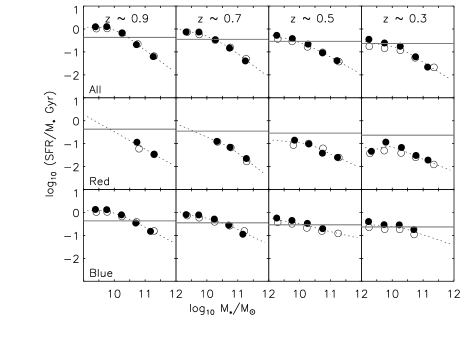
In this section, we perform a simple analysis. One starts with the stellar mass function (of all, red and blue galaxies — whatever population is of interest). Then, one determines the average SFR in broad bins of stellar mass for the galaxies (again, for all, red or blue galaxies), and the average SFR per unit stellar mass is determined as a function of stellar mass (the specific SFR ; illustrated in the left-most set of panels in Fig. 3). Then, the average amount of stellar mass growth between and is estimated, as a function of stellar mass, assuming a constant specific SFR in this interval and a locked-up mass fraction of 0.55 (i.e., 45% of initially-formed stellar mass is returned to the ISM; such a fraction is appropriate for a Chabrier 2003 or Kroupa 2001 IMF for populations with age Gyr). Functionally, we adopt the simple approach of simply re-labelling the stellar mass bin labels of the stellar mass function with a new stellar mass . This predicted mass function (dashed line in the 2nd column of panels in Figs. 4 and 5) is then compared with the observed mass function (solid lines). The procedure is repeated between and , and so on. In this way, one then can estimate (in a very crude fashion) the evolution of the shape of the stellar mass function as a function of time, and ask if this prediction resembles the observed evolution.
The result for all galaxies is shown in the uppermost panel of Figs. 4 and 5. Given the substantial systematic uncertainties, and the crudeness of the analysis, the match between the predicted evolution of the stellar mass function and the observed evolution is impressive. One may notice that there is a slight discontinuity in the behavior of the ‘all’ and ‘red’ stellar mass functions from the bin to the bin. This can be seen also in Fig. 2. Part of this discontinuity reflects the methodology used for COMBO-17 mass estimation (see §2.1); part is likely attributable to remaining cosmic variance at the low redshift end of COMBO-17.
The lower panels of Fig. 4 show the predicted evolution of the stellar mass function of red and blue galaxies as a function of epoch, assuming that all mass formed in blue galaxies will stay in blue galaxies for all time, and all mass formed in red galaxies will stay in red galaxies (i.e., no transfer of mass between blue and red galaxies; the assumptions used in constructing Fig. 2). The low specific SFRs of red-sequence galaxies lead to very modest predicted mass growth, whereas a large amount is observed. In contrast, the higher specific SFRs of blue-cloud galaxies lead to the formation of a large number of blue galaxies, in clear contradiction with the present-day blue cloud stellar mass function.
Motivated by the overall similarity of the observed and blue cloud stellar mass functions, we explore a second simple hypothesis in Fig. 5: all growth of the stellar mass function is added to the red sequence (i.e., the blue cloud mass function is not allowed to change, and the red sequence mass function is given all new galaxies produced in the overall mass function)777It is also possible to carry out this exercise by adding the galaxies created in the blue cloud and red sequence separately. This method gives very similar results at the knee of the mass function, but overproduces slightly the number of faint red sequence galaxies. Such a discrepancy could be addressed by arguing that massive blue galaxies truncate their star formation more frequently than low mass galaxies. Yet, we do not overemphasize challenges at the faint end, as behavior of the mass function at the faint end is observationally unconstrained.. This hypothesis reproduces the evolution of the blue and red stellar mass functions with striking accuracy (considering the significant systematic uncertainties inherent to this kind of analysis).
5 Discussion
In this paper, we have performed a joint analysis of galaxy stellar masses and star formation rates. We found an overall consistency between the predicted growth of stellar mass through star formation and the observed evolution of the stellar mass function (both in differential and integral forms). We showed that the observed star formation in blue cloud galaxies is sufficient to dramatically overproduce the present-day mass budget in blue galaxies. Instead, a significant fraction of blue galaxies must have had their star formation suppressed by some physical process or processes, joining the red sequence. While transformation of galaxies may not be required at masses , large numbers of galaxies with masses must be transferred from the blue cloud to the red sequence at .
5.1 The empirical basis for this paper
While the analysis presented in this paper is clearly model-dependent, the main results are qualitatively robust. The empirical basis for this statement is clear. The rest-frame optical luminosity density in blue cloud galaxies decreases by mag since ; the change is to first order a fading in without accompanying change in (Lilly et al., 1995; Wolf et al., 2003; Willmer et al., 2006). In this interval, the rest-frame optical luminosity density of red sequence galaxies stays roughly constant; the sense of this change is that fades by mag since , accompanied by an increasing to keep the luminosity density constant (Chen et al., 2003; Bell et al., 2004; Faber et al., 2006; Brown et al., 2006). The colors of both red and blue galaxies become redder with increasing time (Bell et al., 2004; Blanton, 2006); it is impossible to avoid some increase in mass-to-light ratio with such aging (Bell & de Jong, 2001; Kauffmann et al., 2003a; Bell et al., 2003). Thus, the stellar mass function of blue cloud galaxies must be approximately unchanging, while the stellar mass function of red sequence galaxies must undergo significant growth, at least around (see, e.g., Bundy et al., 2006; Blanton, 2006; Borch et al., 2006). On the other hand, UV, line emission and thermal-IR surveys all demonstrate convincingly that the bulk of star formation is in blue cloud, primarily disk-dominated galaxies (Flores et al., 1999; Zheng et al., 2004; Hammer et al., 2005; Bell et al., 2005; Melbourne et al., 2005). The IR emission, in particular, argues for significant extra dust-obscured star formation above and beyond what is seen in the local Universe (Elbaz et al., 1999; Chary & Elbaz, 2001; Takeuchi, Buat & Burgarella, 2005; Le Floc’h et al., 2005), suggesting typical star formation rates for massive disks of yr-1 (i.e., doubling times of order a Hubble time; Hammer et al. 2005). Thus, the massive blue galaxies contain the bulk of the star formation; since one is not allowed to change significantly the number of massive disk galaxies (because of the luminosity function and color constraints), these rapidly-growing blue sequence galaxies must be balanced by a loss to the (also rapidly building-up) red sequence. In this way, despite the many model dependencies — the choice of bolometric correction for 24µm-derived star formation rates, calibrations of star formation rates and stellar mass-to-light ratios, choices about faint-end slopes, choice of IMF, etc. — it is clear that the overall picture presented in this paper is rather robust.
5.2 : More than just the crossing point of mass functions?
A particularly interesting result of this analysis is that the mass scale at which the bulk of the red sequence growth takes place is approximately the same as the mass scale at which the bulk of star formation occurs on the blue cloud, at between and ; i.e., at . It was not obvious at all that this needed to be so. We ourselves argued in Bell et al. (2004) that there were an insufficient number of massive disk galaxies with which to feed the red mass function growth: faced with this mismatch, we appealed to widespread and frequent merging of low mass galaxies to produce more massive red sequence counterparts. Such a view is manifestly mistaken, however. Given the results from ISO and Spitzer, it is now clear that massive disk galaxies host a large amount of star formation, sufficient to double their mass in a Hubble time or less (Hammer et al., 2005; Melbourne et al., 2005; Bell et al., 2005). Such intense star formation, obscured by dust, is sufficient to dramatically overproduce the number of local massive disks. This shifts our perception of the blue cloud significantly. A large fraction of massive blue galaxies are required to quench their star formation and join the red sequence; this loss of massive blue galaxies is compensated for by growth of lower-mass blue cloud galaxies through intense star formation.
In the past, much significance has been attached to the transition in galaxy properties seen at , presented first (in a compelling form) by Kauffmann et al. (2003b). In its original incarnation, this transition is defined as the mass at which blue galaxies and red galaxies are equally common, i.e., where the blue and red galaxy stellar mass functions cross. Subsequent work has found other galaxy properties to change at this transition mass, e.g., AGN activity is much more common above this mass than below it (Kauffmann et al., 2003c). Recent works have probed the evolution of the cross-over of the red and blue mass functions out to , finding an order of magnitude decrease in the cross-over point from to the present day (Bundy et al., 2006; Borch et al., 2006). We take the position that this cross-over point is to a certain extent a historical happenstance; indeed, it is observed to be a strong function of environment in the local Universe (Baldry et al., 2006). Instead, we attach much more significance to the cut-off of the blue cloud stellar mass function, starting at . This cut-off, which on the basis of this analysis we interpret as an important scale for global suppression of star formation and transformation to red sequence galaxies, is not a strong function of redshift or environment.
5.3 Expectations of this picture
There are three predictions/expectations of this approach which can be compared with independent analyses. Firstly, it is increasingly apparent from previous analyses as well as our own that massive red sequence galaxies with should have older stellar population than those at (see, e.g., Juneau et al., 2005; Cimatti, Daddi, & Renzini, 2006; Panter et al., 2006). On the basis of the observed of blue cloud galaxies (galaxies whose SFR has not yet been suppressed) and the observed growth of the red sequence, one might expect that the average age of a red sequence galaxy with should be Gyr. At masses , little growth is observed; one would expect most star formation to happen at (as is indeed observed; Papovich et al., 2006; Daddi et al., 2005), giving typical ‘ages’ of Gyr. This compares favorably with observations of the stellar population ages of early-type galaxies from Thomas et al. (2005), discussed also by Thomas & Davies (2006): galaxies with have ages between 5 and 9 Gyr (Thomas & Davies, 2006, adopting the age scatter of , where is the age, from Thomas et al. 2005), while galaxies with masses have ages Gyr (Thomas & Davies, 2006).
Secondly, on a related theme, one expects also a relatively prominent population of galaxies undergoing truncation of their star formation at masses between and . Such a population will be characterized by a rapidly-declining or truncating star formation rate; depending on the rapidity of the truncation, and on the distribution of dust in the galaxy, one is likely to see some spectral evidence of the rapid decrease star formation rate (e.g., enhanced Balmer lines and weak/nonexistent emission lines). In this context, the observations of Le Borgne et al. (2006) are particularly interesting. They study galaxies with at and the present day using the Gemini Deep Deep Survey and the Sloan Digital Sky Survey, finding a decrease in the “H strong” fraction from 50% at to a few percent at present. Extension of this methodology to larger samples (allowing splitting into different mass bins) will allow a more detailed investigation of the redshift evolution, environmetal dependence, and mass dependence of the truncation of star formation in galaxies.
Finally, depending on transformation mechanism, one may expect quite a bit of environmental dependence in galaxy ages; exploration of this issue is well beyond the scope of this work. Qualitatively, however, given that in this picture a large fraction of current red galaxies are generated through suppression of star formation in galaxies which were blue at , and that red galaxies currently live in reasonably dense environments, one expects that a large number of massive blue galaxies will be relatively strongly clustered — clustered much more strongly than present-day massive blue galaxies. Such an expectation is spectacularly borne out by the data: analyses of both the DEEP2 and VVDS galaxy evolution surveys demonstrate an abundance of unusually strongly-clustered massive blue galaxies (Cooper et al., 2006; Cucciati et al., 2006). For workers wishing to understand the driving forces of early-type galaxy evolution, these galaxies merit special attention: analyses of their environment, morphological and structural properties, stellar populations, and supermassive black hole content will shed light on these ‘proto-early-type’ galaxies.
6 Conclusions
In this paper, we have presented a joint analysis of galaxy stellar masses and star formation rates from the COMBO-17 photometric redshift survey combined with Spitzer 24µm data. Stellar masses were estimated using 17-passband optical spectral energy distribution fitting, and star formation rates were determined from the combined ultraviolet and IR fluxes of galaxies. We estimated SFR functions for all galaxies in 4 redshift bins, and presented for the first time SFR functions split into contributions from blue cloud and red sequence galaxies.
When standard stellar mass and SFR calibrations were used, we found an overall consistency between the observed growth of stellar mass since and the integral of the cosmic SFR. Yet, the bulk of SFR occurs in blue cloud galaxies; if all stars either already in or formed in blue galaxies since were to end up in present-day blue cloud galaxies, the total stellar mass budget in blue cloud galaxies today would be dramatically overproduced by a factor of two. Instead, the stellar mass density in red sequence galaxies grows steadily from to the present by approximately the amount required to balance the ‘overproduction’ of stars in blue cloud galaxies. Thus, a large fraction of blue galaxies must have their star formation suppressed by some physical process or processes, joining the red sequence.
We explored the specific SFRs (i.e., SFR per unit stellar mass) as a function of galaxy mass. These specific SFRs were calculated using stacking of 24µm data on the positions of the galaxies of interest, in combination with their rest-frame UV luminosities from COMBO-17. Using these specific SFRs, we ‘predicted’ the evolution of the stellar mass function from one redshift bin to the next. We found that the evolution of the overall stellar mass function is reasonably well reproduced using this approach. Yet, if one assumes that all stars already in or formed in blue galaxies since stay in blue galaxies, one dramatically overproduces the number of present-day massive blue galaxies and underproduces the growth of red sequence galaxies at . This predicted excess of massive blue galaxies is approximately sufficient to feed the growth of the red sequence at . Thus, not only must a significant fraction of blue star forming galaxies suppress their star formation between and the present day, but also the observations require that the suppression mechanism or mechanisms be particularly effective at .
References
- Alonso-Herrero et al. (2006) Alonso-Herrero, A., et al. 2006, ApJ, 640, 167
- Appleton et al. (2004) Appleton, P. N., et al. 2004, ApJS, 154, 147
- Baldry et al. (2006) Baldry, I. K., Balogh, M., Bower, R., Glazebrook, K., Nichol, R., Bamford, S., & Budavari, T. 2006, MNRAS, 373, 469
- Bell & de Jong (2001) Bell, E. F., & de Jong, R. S. 2001, ApJ, 550, 212
- Bell (2003) Bell, E. F. 2003, ApJ, 586, 794
- Bell et al. (2003) Bell, E. F., McIntosh, D. H., Katz, N., & Weinberg, M. D. 2003, ApJS, 149, 289
- Bell et al. (2004) Bell, E. F., et al. 2004, ApJ, 608, 752
- Bell et al. (2005) Bell, E. F., et al. 2005, ApJ, 625, 23
- Blanton et al. (2003) Blanton, M. R., et al. 2003, ApJ, 594, 186
- Blanton (2006) Blanton, M. R. 2006, ApJ, 648, 268
- Borch et al. (2006) Borch, A., Meisenheimer, K., Bell, E. F., Rix, H.-W., Wolf, C., Dye, S., Kleinheinrich, M., & Kovacs, Z. 2006, A&A, 453, 869
- Brand et al. (2006) Brand, K., et al. 2006, ApJ, 644, 143
- Brinchmann & Ellis (2000) Brinchmann, J., & Ellis, R. S. 2000, ApJ, 536, 77L
- Brown et al. (2006) Brown, M. J. I., Dey, A., Jannuzi, B. T., Brand, K., Benson, A. J., Brodwin, M., Croton, D. J., & Eisenhardt, P. R. 2007, ApJ, 654, 858
- Bundy et al. (2006) Bundy, K., et al. 2006, ApJ, 651, 120
- Chabrier (2003) Chabrier, G. 2003, ApJ, 586, L133
- Chary & Elbaz (2001) Chary, R., & Elbaz, D. 2001, ApJ, 556, 562
- Chen et al. (2003) Chen, H.-W., et al. 2003, ApJ, 586, 745
- Cimatti, Daddi, & Renzini (2006) Cimatti, A., Daddi, E., & Renzini, A. 2006, A&A, 453, L29
- Cole et al. (2001) Cole, S., et al. 2001, MNRAS, 326, 255
- Cooper et al. (2006) Cooper, M., et al. 2006, MNRAS, 370, 198
- Cucciati et al. (2006) Cucciati, O., et al. 2006, A&A, 458, 39
- Daddi et al. (2005) Daddi, E., et al. 2005, ApJ, 631, L13
- Dale et al. (2001) Dale, D. A., Helou, G., Contursi, A., Silbermann, N. A., & Kolhatkar, S. 2001, ApJ, 549, 215
- Devriendt et al. (1999) Devriendt, J. E. G., Guiderdoni, B., Sadat, R. 1999, A&A, 350, 381
- Dickinson et al. (2003) Dickinson, M., Papovich, C., Ferguson, H. C., & Budavári, T. 2003, ApJ, 587, 25
- Donley et al. (2005) Donley, J. L., Rieke, G. H., Rigby, J. R., Pérez-González, P. G. 2005, ApJ, 634, 169
- Drory et al. (2004) Drory, N., Bender, R., Feulner, G., Hopp, U., Maraston, C., Snigula, J., & Hill, G. J. 2004, ApJ, 608, 742
- Drory et al. (2005) Drory, N., Salvato, M., Gabasch, A., Bender, R., Hopp, U., Feulner, G., & Pannella, M. 2005, ApJ619, L131
- Elbaz et al. (1999) Elbaz, D., et al. 1999, A&A, 351, L37
- Elbaz et al. (2005) Elbaz, D., Le Floc’h, E., Dole, H., & Marcillac, D. 2005, A&A, 434, L1
- Elmegreen (2006) Elmegreen, B. G. 2006, ApJ, 648, 572
- Faber et al. (2006) Faber, S. M., et al. 2006, submitted to ApJ (astro-ph/0506044)
- Fioc & Rocca-Volmerange (1997) Fioc, M., & Rocca-Volmerange, B. 1997, A&A, 326, 950
- Flores et al. (1999) Flores, H., et al. 1999, ApJ, 517, 148
- Fontana et al. (2004) Fontana, A., et al. 2004, A&A, 424, 23
- Fontana et al. (2006) Fontana, A., et al. 2006, A&A, 459, 745
- Franceschini et al. (2005) Franceschini, A., et al. 2005, AJ, 129, 2074
- Gordon et al. (2000) Gordon, K. D., Clayton, G. C., Witt, A. N., Misselt, K. A. 2000, ApJ, 533, 236
- Gordon et al. (2005) Gordon, K. D., et al. 2005, PASP, 117, 503
- Haarsma et al. (2000) Haarsma, D. B., Partridge, R. B., Windhorst, R. A., & Richards, E. A. 2000, ApJ, 544, 641
- Hammer et al. (2005) Hammer, F., Flores, H., Elbaz, D., Zheng, X. Z., Liang, Y. C., & Cesarsky, C. 2005, A&A, 430, 115
- Helou et al. (1988) Helou, G., Khan, I. R., Malek, L., Boemher, L. 1988, ApJS, 68, 151
- Hopkins (2004) Hopkins, A. M., 2004, ApJ, 615, 219
- Juneau et al. (2005) Juneau, S., et al. 2005, ApJ, 619, L135
- Kauffmann et al. (2003a) Kauffmann, G., et al. 2003a, MNRAS, 341, 33
- Kauffmann et al. (2003b) Kauffmann, G., et al. 2003b, MNRAS, 341, 54
- Kauffmann et al. (2003c) Kauffmann, G., et al. 2003c, MNRAS, 341, 1055
- Kennicutt (1998) Kennicutt Jr., R. C. 1998, ARA&A, 36, 189
- Kroupa (2001) Kroupa, P. 2001, MNRAS, 322, 231
- Kroupa et al. (1993) Kroupa, P., Tout, C. A., & Gilmore, G. 1993, MNRAS, 262, 545
- Le Borgne et al. (2006) Le Borgne, D., et al. 2006, ApJ, 642, 48
- Le Fèvre et al. (2000) Le Fèvre, et al. 2000, MNRAS, 311, 565
- Le Floc’h et al. (2004) Le Floc’h, E., et al. 2004, ApJS, 154, 170
- Le Floc’h et al. (2005) Le Floc’h, E., et al. 2005, ApJ, 632, 169
- Lilly et al. (1995) Lilly, S. J., Tresse, L., Le Fèvre, O., Hammer, F., & Crampton, D. 1995, ApJ, 455, 75
- Lilly et al. (1996) Lilly, S. J., Le Fèvre, O., Hammer, F., Crampton, D. 1996, ApJ, 460, L1
- Lin et al. (2005) Lin, L., et al. 2005, ApJ, 671, L9
- Madau et al. (1996) Madau, P., Ferguson, H. C., Dickinson, M. E., Giavalisco, M., Steidel, C. C., & Fruchter, A. 1996, MNRAS, 283, 1388
- Martínez-Sansigre et al. (2006) Martínez-Sansigre, A., Rawlings, S., Lacy, M., Fadda, D., Jarvis, M. J., Marleau, F. R., Simpson, C., Willott, C. J. 2006, MNRAS, 370, 1479
- Melbourne et al. (2005) Melbourne, J., Koo, D. C., & Le Floc’h, E. 2005, ApJ, 632, L65
- Panter et al. (2006) Panter, B., Jiminez, R., Heavens, A. F., & Charlot, S. 2006, submitted to MNRAS (astro-ph/0608531)
- Papovich & Bell (2002) Papovich, C., & Bell, E. F. 2002, ApJ, 579, L1
- Papovich et al. (2004) Papovich, C., et al. 2004, ApJS, 154, 70
- Papovich et al. (2006) Papovich, C., et al. 2006, ApJ, 640, 92
- Patton et al. (2002) Patton, D. R., et al. 2002, ApJ, 565, 208
- Roussel et al. (2001) Roussel, H., Sauvage, M., Vigroux, L., & Bosma, A. 2001, A&A, 372, 427
- Rudnick et al. (2003) Rudnick G., et al. 2003, ApJ, 599, 847
- Rudnick et al. (2006) Rudnick G., et al. 2006, ApJ, 650, 624
- Salpeter (1955) Salpeter, E. E. 1955, ApJ, 121, 161
- Silva, Maiolino, & Granato (2004) Silva, L., Maiolino, R., & Granato, G. L. 2004, MNRAS, 355, 973
- Spinoglio et al. (1995) Spinoglio, L., Malkan, M. A., Rush, B., Carrasco, L., & Recillas-Cruz, E. 1995, ApJ, 453, 616
- Steidel et al. (1999) Steidel, C. C., Adelberger, K. L., Giavalisco, M., Dickinson, M., & Pettini, M. 1999, ApJ, 519, 1
- Strateva et al. (2001) Strateva, I., et al. 2001, AJ, 122, 1861
- Takeuchi, Buat & Burgarella (2005) Takeuchi, T. T., Buat, V., & Burgarella, D. 2005, A&A, 440, L17
- Thomas & Davies (2006) Thomas, D., & Davies, R. L. 2006, MNRAS, 366, 510
- Thomas et al. (2005) Thomas, D., Maraston, C., Bender, R., & Mendes de Oliveira, C. 2005, ApJ, 621, 673
- Willmer et al. (2006) Willmer, C., et al. 2006, ApJ, 647, 853
- Wolf et al. (2003) Wolf, C., Meisenheimer, K., Rix, H.-W., Borch, A., Dye, S., & Kleinheinrich, M. 2003, A&A, 401, 73
- Wolf et al. (2004) Wolf, C., et al. 2004, A&A, 421, 913
- Wolf et al. (2005) Wolf, C., et al. 2005, ApJ, 630, 771
- Yan et al. (2005) Yan, L., et al. 2005, 2005, ApJ, 628, 604
- Zheng et al. (2004) Zheng, X. Z., Hammer, F., Flores, H., Assémat, F., & Pelat, D. 2004, A&A, 421, 847
- Zheng et al. (2006) Zheng, X. Z., et al. 2006, ApJ, 640, 784
- Zheng et al. (2007a) Zheng, X. Z., Dole, H., Bell, E. F., Le Floc’h, E., Rieke, G. H., Rix, H.-W., & Schiminovich, D. 2007a, submitted to ApJ
- Zheng et al. (2007b) Zheng, X. Z., et al. 2007b, ApJ Letters, in press (astro-ph/0702208)