Inverse Geometric Approach to the Simulation of the Circular Growth.
The Case of Multicellular Tumor Spheroids.
Abstract
We demonstrate the power of the genetic algorithms to construct the cellular automata model simulating the growth of 2-dimensional close-to-circular clusters revealing the desired properties, such as the growth rate and, at the same time, the fractal behavior of their contours. The possible application of the approach in the field of tumor modeling is outlined.
Introduction
The surface phenomena, such as the growth, roughening and penetration into the surrounding medium, as well as their modeling and efficient control, represent long standing research topic in many branches of science and technology. The special case is the close-to-circular growth observed very often in biological systems, like bacterial colonies and tumors. The growth models are usually classified into two groups, (1) continuum, formulated through differential equations (DE), and (2) discrete lattice models, most often represented by cellular automata (CA) VonNeumann1966 , agent-based Mansury2002 ; Mansury2004b , and Monte Carlo inspired models. The CA models are typically constructed by a priori (or microscopically reasoned) setting up the transition rules (CA rules) generating the desired behavior. However, this ad hoc construction of the CA rules is, due to high nonlinearity and multidimensionality of the CA models, often not appropriate in the case of more complicated behaviors. Below we propose the application of genetic algorithms (GA) Holland1975 to retrieve the CA rules generating the growth of the clusters revealing the desired features, such as the growth rate and fractal dimension of the contour. In the here presented inverse geometric approach we quantify the differences between the properties of a CA cluster growth and the fixed desired properties (i. e. the quality of the corresponding CA rules) by the definition of the objective function, and use the optimization technique to set the CA rules which minimize the objective function value. We demonstrate that the approach is, in general, efficient enough to retrieve the CA rules generating the growth of the CA cluster with the desired properties. At the end we outline its possible contribution to the cancer research.
Methods
Cellular automata Wolfram1983 were originally introduced by John von Neumann as a possible idealization of biological systems. In the simple case they consist of a 2D lattice of sites , in the states , where , is the discrete time and the size of the lattice. During the time steps they evolve obeying the set of local transition rules (CA rules) , formally written
| (1) |
which defines the CA rules as the mapping
| (2) |
The two basic update strategies are typically adopted: i) synchronous, when the states (1) of all the CA sites are computed one by one in advance and the updates themselves are performed afterwards; and ii) asynchronous, when a randomly chosen site is immediately updated. The CA evolution is represented by the respective point in -dimensional binary space enabling, in principle, the enormous number of possible global behaviors, predestining the CA to be an efficient simulation and modeling tool Toffoli1987 . Inherent nonlinearity of the CA models is, however, a double-edged sword. On the one hand, it enables to model a broad variety of behaviors, from trivial to complex, on the other hand it results in difficulty with retrieving the transition rules generating the desired global behavior.
No well-established universal technique exists to solve the problem, and, despite sporadic promising applications of the genetic algorithms to solve the task Richards1990 ; Mitchell1994 ; Jimenez-Morales2002 , one typically implements the CA by intuitive (ad hoc or microscopically reasoned) construction of the transition rules, or reduces the dimensionality of the CA search space by incorporating a symmetry into the transition rules. Well known are totalistic rules, when only the number of the adjacent sites in the state 1 (or 0) affects the future state of the respective site. Despite the crucial simplification, they provide very complex behavior (e. g. Conway’s Game of Life).
Genetic Algorithms Holland1975 are general-purpose search and optimization techniques based on the analogy with Darwinian evolution of biological species. In this respect, the evolution of a population of individuals is viewed as a search for an optimum (in general sense) genotype. The feedback comes as the interaction of the resulting phenotype with environment. Formalizing the basic evolutionary mechanisms, such as mutations, crossing-over and survival of the fittest, the fundamental theorem of GA was derived (schema theorem) which shows that the evolution is actually driven by multiplying and combining good (quantified by an appropriate objective function), correlations of traits (also called schemata, or hyperplanes). The remarkable feature resulting from the schema theorem is the implicit parallelism stating that by evaluating a (large enough) population of individuals, one, at the same time, obtains the information about the quality of many more correlations of the traits.
In the following we use the GA optimization to retrieve the CA rules producing the growth of the 2D CA cluster by the required rate as well as fractal behavior of the contour, which is here understood as the set of all the CA sites in the state 1 with at least one neighbor in the state 0.
At the beginning, the chain of concentric circles (learning patterns) with randomly deformed close-to-circular contours , for , were generated accordingly to
| (3) |
with linearly increasing tumor radius
| (4) |
where is the initial radius of the CA cluster and () the desired growth rate constant.
The first objective of the optimization task solved by the GA was to retrieve the CA rules (2) providing the growth from the initial pattern , generated by the same relation as (3), through the sequence of (1), , with the minimum mismatch from the learning patterns in the respective , quantified by the objective function
| (5) |
where is the standard Kronecker delta symbol, is the weight factor, in our case . The above expression of the objective function (5) reflects the programming issues. The larger overlap of with enhances the denominator of Eq. (5), the prefactor in the term reduces the computational overhead by ignoring the calcul for .
The second objective to the desired growth relates to the geometric properties of the contour. Broadly accepted invariant measure expressing the contour irregularity is the fractal dimension, . Using the box-counting method it can be calculated as
| (6) |
where is the minimum number of boxes of size required to cover the contour. Here, it has been determined as the slope in the log-log plot of against using the standard linear fit. To obtain the CA rules generating the cluster with the desired fractal dimension, , the objective function (5) has been multiplied by the factor
| (7) |
where is the fractal dimension of the cluster kept after the steps with the CA rules , being the weight.
Finally, the objective function is written
| (8) |
and the optimum CA rules, , meet the requirement
| (9) |
Results
If not stated otherwise, all the below CA runs started from the pattern (3), with the radius . The size of the 2D CA lattice varied form 120 to 200 (reflecting the growth constant), with the periodic boundaries, and the length of the CA evolution steps. The asynchronous update has been adopted. The canonical GA search has been applied to retrieve the set of the optimum CA rules, , which gives minimum objective function values (5, or 8, respectively). The size of the population was kept constant (1000 individui), the probability of bit-flip mutation 0.001, and the crossing over probability 1. The ranking selection scheme was applied. The length of the optimization was generations.

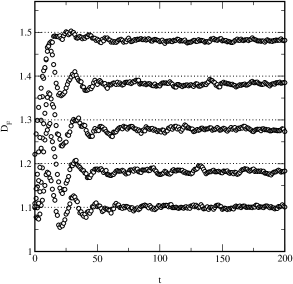
Figs. 1 to 4 show the capability of the above approach to fulfill the required objectives. In Fig. 1 we present the comparison of the typical growths created by the CA rules minimizing the criterion (5) with the respective prescribed rates (4) as well as the respective average contours calculated from 100 repetitions for each of the growths. One can see that in this case the CA rules preserve circular symmetry for all the tested growth rates.

Fig. 2 shows the growing contours created by the CA rules minimizing both the criteria, the desired rate and fractal dimension of the contour, as implemented in (8). The respective average contours (Fig. 3) shows slight deviations from the circular symmetry.

The above results demonstrate that the GA optimization procedure can be used to retrieve the CA rules generating the close-to-circular growths by desired rates and, at the same time, fractal dimensions of their the contours (Fig. 4).
Application to tumor growth modeling
Here we present the application of the above approach in the field of tumor modeling, enabling to study the tumor growth on the spatio-temporal scales where the microscopic details have vanished and eventual universal features of the growth emerge. To understand the universal properties of the growth, physicists have developed the fractal and scaling analysis Barabasi1995 , enabling them to classify many growth processes of seemingly different nature into the universality classes Odor2004 . Led by similar motivations, the fractal and scaling methodology seems to be potentially promising approach to study various aspects of carcinogenesis. The morphology of growing tumor surface is the product of the interactions of many biochemical agents, physical processes and geometrical constraints. Pathologists have used the morphology and shapes of neoplasms to distinguish between the malignant and benign forms as a rule of thumb. Recently, a few papers Landini1996 ; Spillman2004 ; Grizzi2005 ; Kikuchi2006 ; Risser2007 have indicated that the fractal dimension of the tumor contour, morphology or vascular networks can be applied to distinguish between the normal and malignant tissue. In vitro grown tumors usually form 2 (or 3) dimensional close-to-spherical aggregations, called multicellular tumor spheroids (MTS) Delsanto2005 . They can be viewed as the prototype of some real types of human tumors, such as melanomas or gliomas. Allowing the strict control of nutritional and mechanical conditions, the MTS are excellent experimental objects to test the validity of the models of tumor growth.
The below outlined application of the inverse geometric approach to tumor growth modeling is based on the morphometric MTS data by Bru et al. Bru1998 ; Bru2003 , namely therein suggested linear increase of the MTS mean radius, proliferation activity located at the tumor border and the range of the fractal dimensions of the in vitro grown cell colony contours between 1.1 and 1.4, such as HT-29 cell line (tumor type colon adenocarcinoma, ), HeLa (cervix carcinoma, 1.25), Saos-2 (osteosarcoma, 1.34), etc. Using the optimized CA models, we reproduce and interpret some of the features, like the growth rate, response of the tumor to chemotherapy and scaling properties of the contour. We emphasize that in the below application the CA site does not correspond to the only biological cell. We interpret it as a 2D constant size window occupied by the above (or under) critical number of tumor cells, corresponding to 2 states - 1 and 0, respectively. Switching the state of the CA site from 0 to 1 (as well as from 1 to 0) during the simulation simply means that the number of tumor cells in that site has just crossed the critical value. The mechanism itself stays out of the scope of this phenomenological approach, nevertheless it encompasses the mean effect of proliferating activity, cells migration, apoptosis, immune response, etc.
Radius increase
The simplest mathematical models of the tumor growth assume an exponential increase of the tumor mass Shackney1993 (which is however plausible for the early stage of carcinogenesis). Bru et al. Bru1998 ; Bru2003 have recently experimentally shown that the MTS mass, , actually grows linearly increasing its mean radius,
| (10) |
where and retains their meanings (4).
Fig. 5 shows the log-log time dependence of the radius of the two growing CA clusters applying the different rules, optimized to produce the clusters with the fractal dimension of their contours, , equal , and , respectively. Their slopes differ negligible, nevertheless both are slightly steeper than the slope of the idealized growth accordingly to Eq. (10).
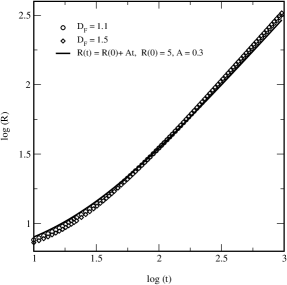
Intuitively, the assumption of the linear increase of the radius is consistent with the observation that proliferation activity is located at the tumor contour. Nevertheless, the results (Fig. 5) show slight deviations from the linear increase of the radius, which we attribute to longer than ideally circular contour of the cluster, giving higher chance to proliferate. On the other hand, the fractal dimension of the contour, , corresponding to the roughness of the cluster contour, does not influence the growth rate in a simple way. We have observed that the CA cluster enforced to grow with the fractal dimension of the contour close to 1 very often ”freeze” repeating some simple pattern which leads to significant deviations from circularity Wolfram1985 . As the deviations from the circularity of the tumor contour is the obvious experimental fact as well, we find the hypothesis of linear increase of the cluster mean radius valid for the spatio-temporal scales where the deviations of the contour points from circularity is negligible in comparison to the mean radius.
Simulation of chemotherapy
To outline the possible therapeutic perspective of the above inverse geometric approach we present the simulation of the impact of chemotherapy to MTS growth. Most chemotherapeutic drugs effectively damage fast proliferating cells (such as tumor cells). Here, the chemotherapy is included into the model in a similar way as in DE models DeVladar2004 as the term inhibiting the production of tumor cells, regardless of the microscopic background of the process. For our purposes, the chemotherapy is viewed as any mechanism (additional to those already imprinted on the CA rules by the optimization procedure) converting the CA site from 1 (i. e. occupied by the above critical number of tumor cells) to 0 (occupied by the under critical number of tumor cells) with non-zero probability, represented by the free parameter, called efficiency of chemotherapy and denoted as . In our CA simulations the above mechanism was realized simply by switching a randomly chosen CA site (of the contour only - by definition in the state 1) to 0 with the probability , instead of applying the respective CA rule.

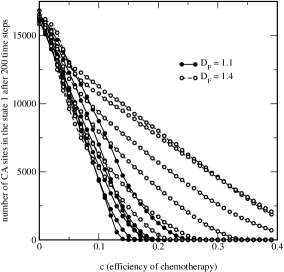
Fig. 6 shows the typical impact of the simulated chemotherapy on the growth of the CA clusters. One CA cluster was grown with the transition rules which had been optimized to generate smoother contours (quantified by its fractal dimension, , upper line), one CA cluster grown with the rules optimized to generate more rough contours (, bottom line). In the left column we compare the sizes and shapes of both the clusters after 200 time steps grown in the absence of chemotherapy (), against the respective cases with the chemotherapy added (, right column). Fig. 7 shows the dependence of the CA cluster growth on the efficiency of the chemotherapy for the two sets of transition rules (generating the contours with , and , respectively) in general. The simulation results clearly demonstrate that the impact of chemotherapy is more inhibiting to the CA clusters grown with smoother contours than those growing with more rough contours.
Hopefully, the above demonstrated results could motivate researchers to search for more quantitative relation between the fractal dimension of the tumor’s contour and the efficiency of chemotherapy. Disposing with concrete morphometric tumor data, the above inverse geometric approach could be used to build the corresponding CA model to make predictions of the resistance to chemotherapy or provide rough estimates of the therapeutic efficiency for the respective in vitro grown tumor cell lines.
Scaling behavior
Inspired by the fractal and scaling concepts, Bru and coworkers Bru1998 ; Bru2003 scrutinized the results of morphometric experiments on a few tens different in vitro growing tumors and cell colonies by the fractal and scaling analysis, and suggested that the tumor reveals the basic features of Molecular Beam Epitaxy (MBE) universality class Barabasi1995 characterized by i) a linear growth rate of the radius, ii) the proliferating activity at the outer border, and iii) diffusion at the tumor surface. Moreover, to characterize the tumor growth dynamics, they determined the critical exponents Barabasi1995 , nevertheless the issue is still under discussion Buceta2005 ; Bru2005 .
Here we outline the typical scaling behavior of the contours of the growing CA clusters applying the CA rules obtained by the above optimization approach for the respective desired growth rate and fractal dimension. We note that no scaling properties have been explicitly included into the optimization procedure.
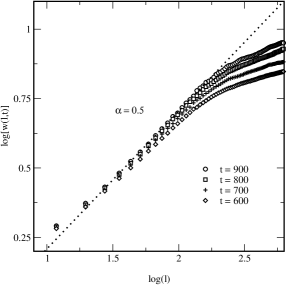
A rough interface is usually characterized by the fluctuations of the contour points , where refers to the th point of the th segment of the arc length in time . By defining the average , the local interface width is given by
| (11) |
where are the numbers of contour points along the th angular segment of the arc length . The brackets mean the average over the different realizations of the arc length .
In general, the growth processes are expected to follow the Family-Vicsek ansatz Family1985 ,
| (12) |
with the asymptotic behavior of the scaling function
| (13) |
where is the roughness exponent and characterizes the stationary regime in which the height-height correlation length ( is so called dynamic exponent) has reached a value larger than . The ratio is called the growth exponent and characterizes the short-time behavior of the interface.
Figs. 8 to 10 demonstrate the typical scaling behavior of the growing CA cluster contours. By fitting the slope of the in the respective regions (13) of the log-log plot we have determined the values of and exponents, giving the value of the exponent .
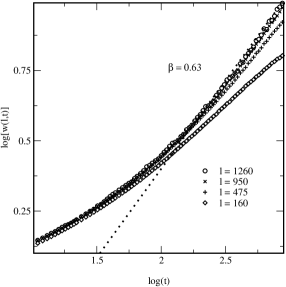
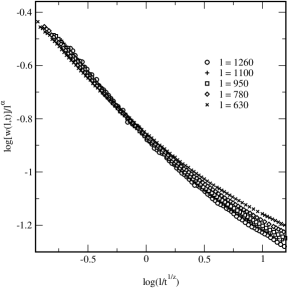
Performing the scaling analysis of 10 CA clusters growing accordingly to the respective CA rules optimized to fulfill different combinations of the desired rate constants, fractal dimensions and weights we have observed weak dependence of the exponent on the growth rate (Tab. 1).
| 0.5 - 0.6 | 0.41 - 0.56 | 0.38 - 0.53 | |
| 0.63 - 0.76 | 0.6 - 0.75 | 0.68 - 0.89 | |
| 0.79 | 0.63 - 0.74 | 0.55 - 0.6 |
The values of the scaling exponents differ from that presented in Bru2003 . Nevertheless, there performed scaling analysis of the circular contours, as well as the scaling analysis of growing circular contours in general, is under discussion Bru2003 ; Buceta2005 ; Bru2005 .
Conclusion
During the recent years cancer research has developed into a very active scientific field with many concepts from other scientific areas, such as statistical physics, applied mathematics, nonlinear science and modeling Baish2000 ; Delsanto2000 ; Deisboeck2001 ; Ferreira2002 ; Chignola2000 ; Galam2001 ; Gazit1995 ; Scalerandi2002 ; Sole2003 penetrating into it. The ultimate aim of the modeling is, in general, to provide correct predictions for the real systems. These traditionally come from the deep knowledge of the problem (microscopic models, ab initio approaches) or from phenomenology (e. g. represented by the growth laws written in the form of the first order differential equations). The microscopic models of tumor growth are typically based on the conceptions such as cell migration, proliferation, chemotaxis, apoptosis, etc. However, involving the plethora of parameters, these models often face to conventional problems of complex systems - subjective choice of the model parameters and their questionable measurement, both leading to the loss of predictive power. On the other hand, macroscopic models often miss adequacy Castorina2006 . The way out of the obstacle could be based on the phenomenological universalities involving phenomena like scale laws, complexity, and nonlinearity Castorina2006 . Here presented approach can be seen as the instance of that way of thinking, benefiting from the demonstrated possibility to simulate the MTS growth by the respective GA optimized CA model. Implementing some of the features of the MTS growth into the CA model one can eventually observe the feature(s) which has not originally been included into the model and, consequently, try to identify the feature(s) in the MTS growth itself.
To illustrate the future perspective of the above CA approach in cancer research we propose the hypothesis of the existence of the saturation time dividing the short time behavior of the local interface width (11) from its universal, time-independent behavior, which is obvious in the simulated CA clusters growth (Figs. 8 and 9). In general, during the roughening of a contour the lateral correlations develop. At the beginning, different sites on the contour are correlated only to the characteristic distance, the correlation length (12). The local interface width increases as a power of time until the correlation length reaches the size of the contour, the time is called saturation time. After that all the sites become correlated and the local interface width reaches a (time independent) saturation value, which increases as a power of the system size. However, if the system, in addition to roughening of the contour, increases in size, the question whether and when the saturation is reached (or lost, if started as correlated) arises. Consequently, the following questions emerge: Show the different tumors different saturation times (and values) of the local interface width? Does the behavior of the local interface width relates to malignity of tumors? Can it be purposefully affected by the chemotherapy? The finding of eventual relation between the malignity (or proliferation activity) and the saturation time supported by the experimental evidence could lead to the development of the new therapeutic approach based on the (re)establishing of the correlations.
The most salient feature of the above approach is that neither microscopically based parameters in the traditional sense, such as the cell migration, proliferation, chemotaxis, apoptosis, etc, are required nor the relations between them are a priori built. Both stay hidden in the transition rules, optimized to fulfill chosen objectives, and acquire statistical (or even symbolic) meaning. For example, the proliferation activity can be deduced only from the increase (or decrease) of the CA cluster size, not from the local changes of the states of individual CA sites, as on the here adopted scale it is impossible to distinguish between the contributions of cell proliferation, migration, apoptosis, etc. On the other hand, some statistically modeled mechanisms (such as the response to drugs) can be included in a quite straightforward manner.
The authors acknowledge financial support from VEGA, Slovak Republic (Grants No. 1/4021/07 and 1/3033/06). High performance computing part of this work has been performed under the Project HPC-EUROPA (RII3-CT-2003-506079), with the support of the European Community - Research Infrastructure Action under the FP6 ”Structuring the European Research Area” Programme.
References
- (1) J. von Neumann. Theory of self-reproducing automata. University of Illinois Press, 1966.
- (2) Y. Mansury, M. Kimura, J. Lobo, and T. S. Deisboeck. Emerging patterns in tumor systems: Simulating the dynamics of multicellular clusters with an agent based spatial agglomeration model. J. Theor. Biol., 219:343–370, 2002.
- (3) Y. Mansury and T. S. Deisboeck. Simulating ’structure-function’ patterns of malignant brain tumors. Physica A, 331:219–232, 2004.
- (4) J. H. Holland. Adaptation in natural and artificial systems. The University of Michigan, 1975.
- (5) S. Wolfram. Statistical mechanics of cellular automata. Rev. Mod. Phys., 55:601–644, 1983.
- (6) T. Toffoli and N. Margolus. Cellular automata machines. MIT Press, 1987.
- (7) F. C. Richards, T. P. Meyer, and N. H. Packard. Extracting cellular automaton rules directly from experimental data. Physica D, 45:189–202, 1990.
- (8) M. Mitchell, J. P. Crutchfield, and P. T. Hraber. Evolving cellular automata to perform computations - mechanisms and impediments. Physica D, 75:361–391, 1994.
- (9) F. Jimenez-Morales, M. Mitchell, and J. P. Crutchfield. Evolving one dimensional cellular automata to perform a non-trivial collective behavior task: One case study. Lecture Notes in Computer Science, 2329:793–802, 2002.
- (10) A. L. Barabasi and H. E. Stanley. Fractal Concepts in Surface Growth. Cambridge University Press, 1995.
- (11) G. Odor. Universality classes in nonequilibrium lattice systems. Rev. Mod. Phys., 76:663–723, 2004.
- (12) G. Landini and J. W. Rippin. How important is tumor shape? Quantification of the epithelial-connective tissue interface in oral lesions using local connected fractal dimension analysis. J. Pathol., 179:210–217, 1996.
- (13) W. B. Spillman, J. L. Robertson, W. R. Huckle, B. S. Govindan, and K. E. Meissner. Complexity, fractals, disease time, and cancer. Phys. Rev. E, 70:061911, 2004.
- (14) F. Grizzi, C. Russo, P. Colombo, B. Franceschini, E. E. Frezza, E. Cobos, and M. Chiriva-Internati. Quantitative evaluation and modeling of two-dimensional neovascular network complexity: the surface fractal dimension. BMC Cancer, 5:109, 2005.
- (15) A. Kikuchi, S. Kozuma, T. Yasugi, and Y. Taketani. 3-d fractal tumor growth of epithelial ovarian cancer. Eur. J. Gyneac. Oncol., 27:561–565, 2006.
- (16) L. Risser, F. Plouraboue, A Steyer, P. Cloetens, G. Le Duc, and C. Fonta. From homogeneous to fractal normal and tumorous microvascular networks in the brain. J. Cerebr. Blood. F. Met., 27:293–303, 2007.
- (17) P. P. Delsanto, M. Griffa, C. A. Condat, S. Delsanto, and L. Morra. Bridging the gap between mesoscopic and macroscopic models: The case of multicellular tumor spheroids. Phys. Rev. Lett., 94:148105, 2005.
- (18) A. Bru, J. M. Pastor, I. Fernaud, I. Bru, S. Melle, and C. Berenguer. Super rough dynamics on tumor growth. Phys. Rev. Lett., 81:4008–4011, 1998.
- (19) A. Bru, S. Albertos, J. L. Subiza, J. L. Garcia-Asenjo, and I. Bru. The universal dynamics of tumor growth. Biophys. J., 85:2948–2961, 2003.
- (20) S. E. Shackney. Tumor Growth, Cell Cycle Kinetics, and Cancer Treatment. McGraw Hill, New York, 1993.
- (21) N. H. Packard and S. Wolfram. Two-dimensional cellular automata. J. Stat. Phys., 38:901–946, 1985.
- (22) H. P. de Vladar and J. A. Gonzales. Dynamic response of cancer under the influence of immunological activity and therapy. J. Theor. Biol., 227:335–348, 2004.
- (23) J. Buceta and J. Galeano. Comments on the article ”The universal dynamics of tumor growth” by A. Bru et al. Biophys. J., 88:3734–3736, 2005.
- (24) A. Bru, S. Albertos, J. L. Subiza, J. L. Garcia-Asenjo, and I. Bru. Reply to comments by Buceta and Galeano regarding the article ”The universal dynamics of tumor growth”. Biophys. J., 88:3737–3738, 2005.
- (25) F. Family and T. Vicsek. Scaling of the active zone in the eden procces on percolation networks and the ballistic deposition model. J. Phys. A, 18:L75–L81, 1985.
- (26) J. W. Baish and R. K. Jain. Fractals and cancer. Cancer Res., 60(14):3683–3688, 2000.
- (27) P. P. Delsanto, A. Romano, M. Scalerandi, and G. P. Pescarmona. Analysis of a phase transition from tumor growth to latency. Phys. Rev. E, 62:2547–2554, 2000.
- (28) T. S. Deisboeck, M. E. Berens, A. R. Kansal, S. Torquato, A. O. Stemmer-Rachamimov, and E. A. Chiocca. Pattern of self-organization in tumour systems: complex growth dynamics in a novel brain tumour spheroid model. Cell. Prolif., 34:115–134, 2001.
- (29) S. C. Ferreira, M. L. Martins, and M. J. Vilela. Reaction-diffusion model for the growth of avascular tumor. Phys. Rev. E, 65:021907, 2002.
- (30) R. Chignola, A. Schenetti, G. Andrighetto, E. Chiesa, R. Foroni, S. Sartoris, G. Tridente, and D. Liberati. Forecasting the growth of multicell tumour spheroids: implications for the dynamic growth of solid tumours. Cell. Prolif., 33:219–229, 2000.
- (31) S. Galam and J. P. Radomski. Cancerous tumor: The high frequency of a rare event. Phys. Rev. E, 63:051907, 2001.
- (32) Y. Gazit, D. A. Berk, M. Leunig, L. T. Baxter, and R. K. Jain. Scale-invariant behavior and vascular network formation in normal and tumor tissue. Phys. Rev. Lett., 75:2428–2431, 1995.
- (33) M. Scalerandi and F. Peggion. Properties of a phase transition induced by antiangiogenetic therapeutical protocols. Phys. Rev. E, 66:031903, 2002.
- (34) R. V. Sole. Phase transition in unstable cancer populations. Eur. Phys. J. B, 35:117–123, 2003.
- (35) P. Castorina, P. P. Delsanto, and C. Guiot. Classification scheme for phenomenological universalities in growth problems in physics and other sciences. Phys. Rev. Lett., 18:188701, 2006.