Effects of Eye-phase in DNA unzipping
Abstract
The onset of an “eye-phase” and its role during the DNA unzipping is studied when a force is applied to the interior of the chain. The directionality of the hydrogen bond introduced here shows oscillations in force-extension curve similar to a ”saw-tooth” kind of oscillations seen in the protein unfolding experiments. The effects of intermediates (hairpins) and stacking energies on the melting profile have also been discussed.
pacs:
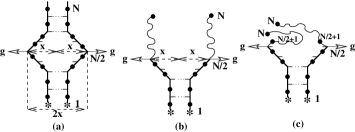
64.90.+b,36.20.Ey,82.35.Jk,87.14.GgMolecular interactions play a key role in living organisms. Recent advances in experimental techniques have allowed nanomanipulation in single biological molecule and made possible to measure these interactions sinmol . The aim is to exert a force in the pN range by optical tweezers, atomic force microscopy, etc and characterize the molecular, elastic, structural and functional properties of bio-molecules cof ; ubm . In typical experiments of double stranded DNA (dsDNA) unzipping, a force is applied to the ends of the chain (Fig. 1a) and one studies the force-extension curve which shows the elastic properties and the gross features that reflect the local ‘G-C’ vs ‘A-T’ content along the sequence smh ; mgz ; chl ; rief ; bloom . Moreover, the force-temperature diagram shows, below the melting temperature, that the over-stretching force bloom decreases nearly linearly with temperature.
Theoretically, DNA unzipping may be studied in different ensembles busta depending on the experiments. For example, Atomic force microscopes (AFM) work in constant distance ensemble (CDE) while magnetic bead uses the concept of constant force ensemble (CFE). The prediction of unzipping transition based on interacting Gaussian chains bhat99 raised a lot interest and now results are available from dynamical approach seba , exact solutions of lattice models trieste ; kbs , simple models of quenched-averaged DNA nelson ; lam , numerical simulations and scaling analysis nsys ; chen . Recently for a model of interacting polymers where any monomer of one chain can interact with any monomer of the other chain (we call it model A), the role of an intermediate entropy-stabilized phase was recognized and a force-induced triple point kgbhat in a force-temperature plane was established.
In most of the models studied for dsDNA trieste ; kbs ; nelson ; lam ; nsys ; baiesi , a monomer of one strand can only interact with the -th monomer of the other strand, which is similar to the models of DNA (we call it model B) proposed earlier by Poland and Scheraga polsch . These models do not take into account the directional nature of the hydrogen bond and underestimate the entropy by restricting the formation of hydrogen bonds. Thus these models may only give a limited picture of the unzipping transition and do not allow to study the effect of intermediate states danilow .

So far, most of the theories of DNA unzipping have focused on the thermodynamic limit, and therefore, consist of a few parameters typically in the form of an effective base-pair interaction in a simplified way. In all the single molecule experiments, a finite size chain is used and hence no “true phase transition” can in principle be observed. Still, the “phase transition” observed in such experiments may be considered as real if the length of the chain exceeds the characteristic correlation lengths. It is now becoming possible to go to the other limit of studying shorter segments ( base pair) at coarse grained level sosg ; lfenb . The purpose of this letter is to provide exact results of a semi-microscopic model of short chains by incorporating the directional nature of hydrogen bonds and then propose a method to study the effect of molecular interactions right at the individual base pair level and their role on melting profile.
In the following, we adopt a more realistic model of DNA, which may be defined in any dimension kgs (herein after we call it model C). A similar model has been used in Ref. 24 in the context of relative stabilities of DNA hairpin structures. The model takes care of important shortcomings of model B and also incorporates some additional features like existence of intermediate states, effects of stacking energy, excluded volume properties of nucleotides and the directional nature of hydrogen bonds.
Although the importance of bubble formation during thermal melting has been recognized, no attempt has been made so far to experimentally explore the phase diagram when a force is applied to the interior of the chain as shown in Fig 1b. Such situations occur in many biological processes, for example, during gene-expression, RNA forms bubbles or “eye-type” conformations on DNA. Therefore, we consider two cases: () force has been applied at the end of the chain (Fig. 1a,‘END’ case or case), and () at the middle of the chain (Fig. 1b, ‘MID’ case). The contribution to energy by this force, , is , where is the absolute distance in the -direction between the two strands at the point of application of the force.
We model the two strands (e.g. A-T) of a homopolymer DNA by two mutually- attracting-self-avoiding walks (MASAWs) on a square lattice as shown in Figs. 1(c-e). The bases are associated with the link between two monomers of a chain as depicted in Fig. 1. In one strand the bases point towards the right while on the other they are on the left, as one traverses the chains sequentially. We associate a contact energy (effective base pair interaction) with each pairing between complementary strands only if the bases are nearest neighbors (short range nature of the hydrogen bond) and approach each other directly without the strands coming in between [Fig. 1c]. Fig. 1e shows the possibility of formation of hairpin (which is not possible in model B) in a single strand of DNA. However, in this case, non-native contribution has been taken into account but no apparent weight has been assigned to stem as it is made up of same nucleotides.
The partitions function () of the system under consideration can be written as a sum over all possible configurations of MASAWs i.e. , where is the inverse temperature, being the Boltzmann constant. is the number of distinct conformations walks of length having number of intact base pairs whose end (or mid) points are at a distance apart. We have obtained for and analyzed the partition function using exact enumeration and series analysis technique ratio ; exenu . We prefer this technique because it can predict various phases of the system maren quite effectively and the scaling corrections can be correctly taken into account by a suitable extrapolation methods ratio ; exenu . To achieve the same accuracy in Monte Carlo, a chain of two orders of magnitude larger than in the exact enumeration method is required ykg . We set and calculate the reduced free energy per base pair from the relation exenu . The limit is achieved by using the ratio method ratio for extrapolation. The transition point can be obtained from the plot of versus or from the peak value of .
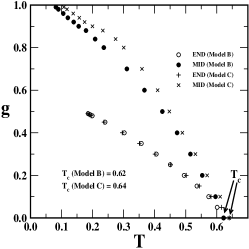
A force-temperature () phase diagram of model B and C for end and mid case is shown in Fig. 2. The qualitative features of the phase diagram obtained here may be compared with experiments bloom . The phase boundary separates the zipped and the unzipped state. At , the critical force can be found from a simple analytic calculation and is equal to kgbhat that is in agreement with the one from Fig. 2.
Experimentally, the melting profiles are obtained by monitoring the change in the UV absorbence with temperature which provides the information about the fraction of open base pairs and the melting temperature is defined when half of the total base pairs get open melt . Another quantity of experimental interest is to monitor and measure the end separation by varying the force. We calculate these quantities from the expressions and and plot their variations with temperature and force in Figs. 3 and 4, respectively. It is evident from Fig. 3 that, with increasing temperature (or force), the number of intact base pairs decreases and there is a sharp transition from a zipped state to the unzipped state.
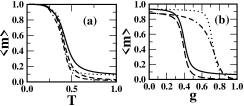
Remarkably, to break the same amount of base pairs at low temperature one requires almost double the force if it is applied in the middle of the chain, rather than the end (Fig. 3b) consistent with the exact results kbs . Near the melting temperature, fluctuation dominates and less than double the force is required for unzipping the chain from the middle.
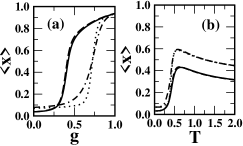
Another interesting observation is the variation of average elongation with force which shows a monotonically increasing trend (Fig. 4a) at constant temperature and approaches unity. Meanwhile the variation of extension at constant force shows a sharp rise with temperature (Fig. 4b) and then a slight decline to approach a value below unity. At constant temperature, there is a transition from the zipped to the unzipped (“rod-like”) state. Keeping force constant, when temperature is varied, there is a transition and the chain acquires conformations close to the rod-like states. As this temperature is still low, with further increase in temperature, the entropy of the system increases and the chain acquires coil-like state at higher temperature and thus average distance decreases.
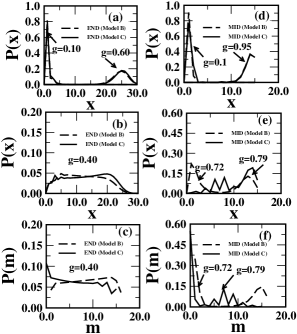
We also study the probability distribution curves with and with for model B and C defined by and respectively. In Figs. 5(a-f) we have shown and for different values of force and a fixed temperature . The -component of the distribution function gives information about the states of dsDNA. The maxima of at correspond to the zipped state for a given set with and . For small forces, thermal fluctuations are too weak to unzip the strand and the DNA remains in the zipped state. This is being reflected in the structure-less distribution function with a well defined peak at the most likely value of the extension (Figs. 5a and 5d). For both the models at higher force and at the same temperature ( for end and for mid respectively at ), thermal fluctuations have been suppressed by a strong force and strands are found in the segregated “rod-like” state with more or less an identical distribution peaked at maximum extension. However, striking differences are observed in the probability distribution curves for model B and C at intermediate forces below transition line ( plane) when the force is applied in the middle. No such differences are observed for the end case. For the mid case, the probability distribution curve of model C shows strong oscillations, whereas for model B no such oscillations are observed. This indicates that the model B may be described by two state models. However, model C shows that certain intermediates states (“eye-shape” of even width) are more favorable than others.
It is interesting to note that the phase diagram of model B and C are almost identical without any re-entrance at low temperature. This may be because of the fact that the energy of the ground state and the unbound state for both models are the same. At the center point of the ‘Y’ (end case), the phase boundary is determined by a balance of the net force - and the unzipping potential with associated entropy. In the thermodynamic limit, directionality of the hydrogen bonds, which appear in the form of entropy of the partial bound states does not play a crucial role in this balance. The absence of re-entrance is understood with the zero entropy of the ground state for both models. As shown recently by Kapri et al. kbs for mid case, in the CDE there is a possibility of a coexistence region that is better thought of as an “eye-phase” two ‘Y’ joined together. In this case, the separation at the point of application of force is smaller than the fully open case and thus such conformations statistically have more weight than the other conformations.
Since the bottom end is kept fixed, the top side of the strand may open due to thermal fluctuations (Fig. 6b) and form a partial bound state as shown in Fig. 6c which is more stable than Fig. 6b. Therefore, in model C, the half of the chain undergoes an unzipping transition while other half due to the non-native contacts, shows the combined effects of unzipping and slippage (shearing) transition. Thus in the model C, the transition appears more smoother than the model B which can be seen in Fig. 3b. The consecutive peaks in vs curve (Fig. 5e) represent the “eye-phase” of even widths which contribute most to the partition function. Because of native contacts, the contribution of the “eye-shape” conformation is significantly less and small thermal fluctuations are sufficient to unzip the chain in model B.
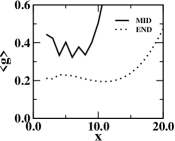
We substantiate our arguments by extending calculation in CDE also. The partition function in CDE may be defined as . The two ensemble are related by kbs ; nelson . The free energy is given by the relation . In CFE the average separation fluctuates while in CDE one measures the average force to keep the separation constant given by the expression at constant temperature busta . The force-extension curve thus obtained is shown in Fig. 7 for model C which also shows oscillations for the ‘MID’ case but constant for the ‘END’ case. Though a somewhat similar effect has been seen experimentally in molecules like Titin protein , DNA has not been probed so far. The average of force obtained here ( for ‘END’ case and for ‘MID’ case at ) also matches with the value shown in Fig. 2.
The stacking energy in case of homopolymers gets adsorbed in the effective base pair interaction. To see this, we associate an additional energy between two consecutive parallel base pairs (only possible in model C) and found that there is no qualitative change in the phase diagram except shift in the transition temperature. If stacking energy is negative (attractive interaction) chain becomes stiffer. However, it does not change the nature of oscillations as observed in probability distribution curves for the ‘MID’ case.
The exact results on short chains of a new semi-microscopic dsDNA that incorporates the directional nature of hydrogen bond show unequivocal signature of an “eye phase”, without going to the long chain limit. This happens for the case with a force acting in the middle of the dsDNA. The variation of elongation due to the force in different ensembles has different behaviour both qualitatively and quantitatively. We anticipate that refinements in high precision single molecule experiments will be able to verify these predictions.
We thank Y. Singh, S. M. Bhattacharjee and Jeff Chen for many fruitful discussions on the subject and University Grants Commission, India for the financial assistance. One of us (SK) would like to acknowledge financial support from MPIPKS, Dresden, Germany.
References
- (1) M. Rief, et al., Science 276, 1112 (1997); C. Bustamante, Z. Bryant, S. B. Smith, Nature 421, 6921 (2003).
- (2) M. Carrion-Vazquez, et al., Prog. Biophys. Mol. Bio. 74, 63 (2000); A. Engel, et al., Curr. Biol., 9, R133 (1999).
- (3) U. Bockelmann, Curr. Opin. Struc. Biol. 14, 368 (2004).
- (4) J. C. Sitko, et al., Biophys. J. 84, 419 (2003).
- (5) Y. Zeng, et al., Phys. Rev. Lett. 91, 148101 (2003).
- (6) P. Cluzel, et al. , Science,271, 792 (1996).
- (7) S. B. Smith ,et al. Science 271, 795 (1996).
- (8) I. Rouzina and V. A. Bloomfleld, Biophys J. 80, 894(2001); ibid, 80, 894 (2001).
- (9) C. Bustamante, J. Liphardt and F. Ritort, Physics Today, 58, 43 (2005), cond-mat/0511629.
- (10) S. M. Bhattacharjee, J. Phys. A 33 L423 (2000).
- (11) K. L. Sebastian, Phys. Rev. E 62, 1128 (2000).
- (12) D. Marenduzzo, et al., Phys. Rev. E 64, 031901 (2001); D. Marenduzzo, et al., Phys. Rev. Lett. 88, 028102 (2002).
- (13) R. Kapri, et al., Phys. Rev. Lett. 93, 248102 (2004); R. Kapri and S. M. Bhattacharjee, cond-mat/0511531.
- (14) D. K. Lubensky and D. R. Nelson, Phys. Rev. Lett. 85, 1572 (2000); ibid, D. K. Lubensky and D. R. Nelson, Phys. Rev. E 65,031917 (2002).
- (15) Pui-Man Lam et al., Biopolymers 73, 293 (2004).
- (16) N. Singh and Y. Singh, Euro. Phys. J. E 17 , 7 (2005).
- (17) Jeff Z.Y. Chen, Phys. Rev. E 66, 031912 (2002).
- (18) S. Kumar, et al., Phys. Rev. E, 71, 51804 (2005).
- (19) M. Baiesi et al. Phys. Rev. E 66, 021804 (2002).
- (20) D. Poland and H. A. Scheraga, J. Chem. Phys. 45, 1456 (1966); ibid 45, 1464 (1966).
- (21) C. Danilowicz et al., Phys. Rev. Lett. 93, 078101 (2004); C. Danilowicz et al., PNAS 100, 1694(2003).
- (22) T. Strunz, et al., PNAS, 96 11277 (1999).
- (23) M. J. Lang, et al., Nature Methods 1, 1 (2004).
- (24) S. Kumar, et al., Europhysics Lett. 70, 15 (2005).
- (25) A. J. Guttmann Phase Transition and Critical Phenomena, edited by C. Domb and J. L. Lebowitz (Academic, New York) Vol 13 (1989); P. K. Mishra, S. Kumar and Y. Singh, Physica A 323, 453 (2003).
- (26) C. Vanderzande, Lattice models of polymers (Cambridge University Press, UK, 1998).
- (27) D. Marenduzzo, et al., Phys. Rev. Lett. 90,088301.
- (28) Y. Singh, et al. J. Phys. A: Math Gen. 34, L67 (2001).
- (29) R. M. Wartel and A. S. Benight, Phys. Rep. 126,67 (1985).
- (30) M. Rief et al., Science 275, 1295 (1997).