New scaling relations in cluster radio halos and the re-acceleration model
Abstract
In this paper we derive new expected scaling relations for clusters with giant radio halos in the framework of the re-acceleration scenario in a simplified, but physically motivated, form, namely: radio power () vs size of the radio emitting region (), and vs total cluster mass () contained in the emitting region and cluster velocity dispersion () in this region.
We search for these correlations by analyzing the most recent radio and X-ray data available in the literature for a well known sample of clusters with giant radio halos. In particular we find a good correlation between and and a very tight “geometrical” scaling between and . From these correlations is also expected to scale with and and this is confirmed by our analysis. We show that all the observed trends can be well reconciled with expectations in the case of a slight variation of the mean magnetic field strength in the radio halo volume with . A byproduct correlation between and is also found, and can be further tested by optical studies. In addition, we find that observationally scales non-linearly with the virial radius of the host cluster, and this immediately means that the fraction of the cluster volume which is radio emitting increases with cluster mass and thus that the non-thermal component in clusters is not self-similar.
keywords:
particle acceleration - turbulence - radiation mechanisms: non–thermal - galaxies: clusters: general - radio continuum: general - X–rays: general1 Introduction
Radio halos are diffuse Mpc scales synchrotron radio sources observed at the center of a growing number ( 20) of massive galaxy clusters (see e.g., Feretti 2005 for a review). Radio halos are always found in merging clusters (e.g., Buote 2001; Schuecker et al 2001) thus suggesting a link between the dynamical status of clusters and the radio halos. Observations show that radio halos are rare; however present data suggest that their detection rate increases with increasing the X-ray luminosity of the host clusters and reaches 30-35% for galaxy clusters at and with X-ray luminosity larger than erg/s (Giovannini, Tordi & Feretti 1999, GTF99).
Two main possibilities have been so far investigated to explain the radio halos: i) the so-called re-acceleration models, whereby relativistic electrons injected in the intra cluster medium (ICM) are re-energized in situ by various mechanisms associated with the turbulence generated by massive merger events (e.g., Brunetti et al. 2001; Petrosian et al. 2001); ii) the secondary electron models, whereby the relativistic electrons are secondary products of the hadronic interactions of cosmic rays with the ICM (e.g., Dennison 1980; Blasi & Colafrancesco 1999).
Recently, calculations in the framework of the re-acceleration scenario have modelled the connection between radio halos and cosmological cluster mergers, and investigated the observed correlations between the synchrotron radio power and the X-ray properties of the hosting clusters (Cassano & Brunetti 2005, CB05; Cassano, Brunetti & Setti 2006, CBS06). Observed correlations relate the radio power at 1.4 GHz () with the X-ray luminosity (), temperature () and cluster mass (Liang 1999; Colafrancesco 1999; Feretti 2000,2003; Govoni et al. 2001a; Enßlin and Röttgering 2002; CBS06); also a trend between the largest linear size of radio halos and the X-ray luminosities of the hosting clusters is found (Feretti 2000). In particular, CBS06 found a correlation between and the virial mass of the hosting clusters, , by combining the correlation derived from a sample of 17 giant radio halos with the correlation obtained for a large sample of galaxy cluster compiled by Reiprich & Böheringer (2002). However, this correlation, which has been discussed in the particle re-acceleration scenario by CBS06, relates quantities which pertain to very different spatial regions: the observed radio emission comes from a radial size time smaller than the virial radius .
In this paper we discuss expected scaling relations for radio halos in the framework of the re-acceleration scenario in its simplest form. Then, we derive a novel observed correlation between the radio power of radio halos and their extension and a tight “geometrical” correlation between the size of radio halos and the mass of the cluster within the emitting region. We also present additional correlations which are expected on the basis of these two scalings. Finally we compare all these observed correlations with the model expectations.
A CDM ( km Mpc-1, , ) cosmology is adopted.
2 Particle acceleration scenario
2.1 Main features and implications of the re-acceleration model
The particle re–acceleration model is designed to explain the origin of the synchrotron radio emission diffused on scales larger than that of the cluster cores (giant radio halos), while the so called mini–halos and other smaller scale diffuse sources at the cluster center (e.g. core halo sources) might have a different origin (e.g., Gitti, Brunetti, Setti 2002; Pfrommer & Ensslin 2004, and ref. therein).
In the conventional particle re–acceleration scenario the lower energy electrons (), relic of past activities in the clusters, are re-energized due to resonant and/or non-resonant interactions with the turbulence developed during cluster-cluster mergers. Turbulence and shear flows are expected to amplify the magnetic field in galaxy clusters (e.g., Dolag et al. 2002, 2005; Brüggen et al. 2005) however, the decay time-scale of the magnetic field is expected to be larger than several Gyr (e.g., Subramanian, Shukurov and Haugen 2006) and thus the particle re-acceleration process can be thought as occurring in a stationary magnetic field amplified during the previous merging history of the cluster.
The basic features of this model can be briefly summarized as follows:
a) The average synchrotron spectrum of radio halos is curved and can be approximated by a relatively steep quasi–power law which further steepens at higher frequencies up to a cut-off frequency.
The curved, cut-off spectrum is a unique feature of the re-acceleration model, which well represents the typical observed radio halo spectrum, due to the existence of a maximum energy of the radiating electrons (at ) determined by the balance between the energy gains (re–acceleration processes) and synchrotron and inverse Compton losses (e.g., Brunetti et al. 2001, 2004; Ohno et al 2002; Kuo et al. 2003). Accordingly, the detection of a radio halo critically depends on cut–off frequency which should be sufficiently larger than the observing frequency. As a consequence, there is a threshold in the efficiency which should be overcome by the re–acceleration processes in order to accelerate the electrons at the energies necessary to produce radio emission at the observed frequency in the clusters’ magnetic fields. In the merger–related scenario it is expected that only mergers between massive galaxy clusters may be able to generate enough turbulence on large scales to power giant radio halos at GHz frequencies, thus not all clusters which show some merger activity are expected to possess a giant radio halo. In particular, CB05 show that the expected fraction of clusters with radio halos increases with cluster mass due to a more efficient particle re-acceleration process in more massive galaxy clusters, and this is in line with the increase of the fraction of radio halos with cluster mass which is claimed from the analysis of present radio surveys (e.g., GTF99).
b) In the re–acceleration model radio halos should be transient phenomena in dynamically disturbed clusters. The time scale of the radio halo phenomena comes from the combination of the time necessary for the cascading of the turbulence from cluster scales to the smaller scales relevant for particle acceleration, of the time–scale for dissipation of the turbulence and of the cluster–cluster crossing time.
Present observations suggest that radio halos are preferentially found in dynamically disturbed systems (e.g., Buote 2001; Govoni et al. 2004). Under the hypothesis that radio halos form in merging clusters in the hierarchical scenario, Kuo et al. (2004) found that the lifetime of these radio halos should be Gyr to not overproduce the observed occurrence of these sources.
2.2 Predicted scalings for giant radio halos
In this Section we derive scaling expectations for giant and powerful radio halos in the context of the re–acceleration scenario in its simplest form.
The most important ingredient is the energy of the turbulence injected in the ICM. Numerical simulations of merging clusters show that infalling sub-halos induce turbulence (e.g., Roettiger, Loken & Barns 1997; Ricker & Sarazin 2001; Tormen, Moscardini & Yoshida 2004). An estimate of the energy of merging-injected turbulence has been recently derived in CB05 by assuming that a fraction of the PdV work done by the infalling sub-halos is injected into compressible turbulence. They show that the turbulent energy is expected to roughly scale with the thermal energy of the ICM, a result in line with recent analysis of numerical simulations (Vazza et al. 2006, V06).
Once injected this turbulence is damped by Transit-Time-Damping (TTD) resonance with thermal and relativistic particles (at a rate and , respectively). Since the damping time is shorter than the other relevant time scales (dynamical and re-acceleration) the energy density of the turbulence reaches a stationary condition given by , where is the turbulence injection rate (CB05). When re–acceleration starts, the bulk of the energy density of compressible modes which is damped by the relativistic electrons goes into the re–energization of these electrons. On the other hand, after a few re–acceleration times, in a time–scale of the order of the typical age of radio halos, electrons are boosted at high energies at which radiative losses are severe () and the effect of particle re–acceleration () is balanced by that of radiative losses. The electron spectrum gradually approaches a quasi-stationary condition and it can be assumed that the energy flux of the turbulent modes which goes into relativistic electrons is essentially re–radiated via synchrotron and inverse Compton mechanisms:
| (1) |
where and are the synchrotron and IC emissivities (and , CB05; Brunetti & Lazarian 2007).
The ratio simply depends on , where G is the equivalent magnetic field strength of the CMB (z, the redshift) and the mean magnetic field strength in the radio halo volume, which can be parameterized as with the total cluster mass within (the average radius of the radio emitting region).

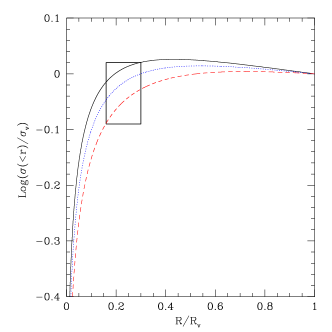
Based on CB05, the injection rate of the turbulence in the radio halo volume can be estimated as , where is the mean density of the ICM in the radio halo volume, is the cluster-cluster impact velocity, , and is the cluster-cluster crossing time (see CB05) and is constant by definition of virial mass in the cosmological hierarchical model (e.g., Borgani 2006, for a review). In the case is larger than the cluster core radius it is and , the velocity dispersion inside , is (for the sake of clarity in Fig. 1 we report a comparison between and for our sample of clusters with radio halos). Thus we shall simply assume that the injection rate of turbulence in the radio halo volume is . The term is (Brunetti 2006, Brunetti & Lazarian 2007), where is the temperature of the cluster gas, and is the ratio between the energy densities in relativistic particles and in the thermal plasma. Although this ratio might reasonably vary from cluster to cluster, we shall assume that it does not appreciably change in any systematic way with cluster mass (or temperature), at least if one restricts to the relatively narrow range in cluster mass spanned by clusters with giant radio halos (see also the results from numerical simulations for cosmic rays in Jubelgas et al. 2006). Then from Eq.1 the total emitted radio power is:
| (2) |
where we have taken and . The expression (Fig.2) is constant in the asymptotic limit or in the simple case in which the rms magnetic field in the radio halo region is independent of the cluster mass. For one has that , thus in the general case the expected scaling is steeper (slightly for of the order of a few G) than that obtained by assuming a constant .

It is important to stress here that the expression in Eq.2 is a general theoretical trend which implies simple scaling relations. Indeed, by taking and under the assumption that the mass scales with as (see also Sect. 3.2), Eq.2 (with constant) entails the correlations:
| (3) | |||||
| (4) | |||||
| (5) |
the effect of a non constant is a steepening (although not substantial for G fields) of these scalings.
3 Observed scaling relations in clusters with radio halo
Motivated by the theoretical expectations outlined in the previous Section, we have searched for the predicted scaling relations in the available data set for giant radio halos. Operatively, we will first discuss the case of the scaling expected in Eq.3, which will allow us to address the tricky point of the measure of in radio halos, and then we will show that a tight observational scaling exists for radio halos. Then, we will discuss and verify the byproduct observational scalings between and .
We consider a sample of 15 clusters with known giant radio halos ( kpc) already analyzed in CBS06, with the exclusion of CL0016+16, due to the lack of good radio images to measure , and of A754, due to very complex radio structure. References for 14 giant radio halos are given in CBS06, while for A2256 we use the more recent radio data from Clarke & Enßlin (2006). In Tab.LABEL:tab.RH we report the relevant observed and derived quantities for our sample.

3.1 Radio power versus sizes of radio halos
| cluster’s | z | Log() | Log() | Log() | Log() |
|---|---|---|---|---|---|
| name | [Watt/Hz] | [kpc ] | [] | [] | |
| 1E50657-558 | 0.2994 | ||||
| A2163 | 0.2030 | ||||
| A2744 | 0.3080 | ||||
| A2219 | 0.2280 | ||||
| A1914 | 0.1712 | ||||
| A665 | 0.1816 | ||||
| A520 | 0.2010 | ||||
| A2254 | 0.1780 | ||||
| A2256 | 0.0581 | ||||
| A773 | 0.2170 | ||||
| A545 | 0.1530 | ||||
| A2319 | 0.0559 | ||||
| A1300 | 0.3071 | ||||
| Coma (A1656) | 0.0231 | ||||
| A2255 | 0.0808 |
A direct scaling between for radio halos is not reported in the literature. We want to check the existence of a correlation by making use of directly measurable quantities, such as the power and the radius at 1.4 GHz. In the present literature it is customary to use the Largest Linear Size (LLS), obtained from the Largest Angular Size (LAS) measured on the radio images as the largest extension of the or contour level, as a measure of the radio emitting region (e.g., Giovannini & Feretti 2000; Kempner & Sarazin 2001). Since a fraction of radio halos in our sample is characterized by a non–spherical morphology, meaning a non-circular projection on the plane of the sky, an adequate measure of a radio halo’s size can be obtained by modelling the emitting volume with a spherical region of radius , and being the minimum and maximum radius measured on the 3 radio isophotes. In this way we have derived the values for all 15 radio halos, as reported in Tab.LABEL:tab.RH, by making use of the most recent radio maps available in literature. In Fig.3 we report versus for our sample. We find a clear trend with increasing with , i.e., the more extended radio halos are also the most powerful. The best-fit of this correlation is given by:
| (6) | |||||
A Spearman test yields a correlation coefficient of and a significance, indicative of a relatively strong correlation.
3.1.1 Uncertainties in the measure of the size of radio halos
The dispersion of the correlation is relatively large, a factor of in , and this may be due to the errors associated with the measure of . Indeed, radio halos are low brightness diffuse radio sources which fade away gradually, until they are lost below the noise level of a given observation. Thus, the measure of a physical size is not obvious and, in any case, it needs to be explored with great care. However, what is important here is not so much the precise measure of for each radio halo, but rather the avoidance of selection effects which might force a correlation.
In principle the sensitivity in the different maps may play a role because the most powerful radio halos are also the most bright ones (Feretti 2005), and thus they might appear more extended then the less powerful radio halos in the radio maps. To check if this effect is present, in Fig.4 we plot the ratios between the average surface brightness of each radio halo in our sample and the rms of each map used to get . It is clear that there is some scattering in the distribution which would yield a corresponding dispersion in the accuracy of , however, and most importantly, the ratios are randomly scattered, and there is no trend with , i.e., fainter radio halos are usually imaged with a higher sensitivity and thus the correlation cannot be forced by the maps used to derive .
An additional effort in assessing the reliability of (and of the correlation) would be to measure the radial brightness profile of regular radio halos which are not severely affected by powerful and extended radio sources. In our sample it is feasible to obtain accurate radial profiles from available data for the following radio halos: A2163, A2255, A2744, A545 and A2319. We take the data at 1.4 GHz (Feretti et al. 2001, Govoni et al. 2005, Govoni et al. 2001a, Bacchi et al. 2003, Feretti et al. 1997, respectively), and use the software package SYNAGE++ (Murgia 2001) to extract the radial brightness profiles, after subtraction of the embedded radio sources.


In Fig.5 we report the integrated brightness profiles of these radio halos. It is seen that the profiles flatten with distance from the respective clusters centres, indicating that basically all the extended radio emission is caught and that it is possible to extract an accurate physical size. In Fig.6 we report for these 5 radio halos the comparison between , estimated directly from 3 radio isophotes (see the above definition), and and , i.e., the radii respectively containing the 85% and 75% of the flux of the radio halos. We apply the same procedure also to the case of the Coma cluster at 330 MHz for which a brightness profile and radio map were already presented in the literature (Govoni et al 2001b). For Coma at 330 MHz we find and , which set Coma in a configuration similar to that of the other clusters in Fig.6.
The linear, almost one-to-one correlation between and and the relatively small dispersion, consistent with the uncertainties in the profiles due to source subtraction, prove that our definition of is a simple but representative estimate of the physical size of radio halos.

We note that the sensitivities of the radio maps, the physical sizes and powers of the 5 regular halos are representatives of the values encompassed by the full radio halo sample. Moreover, for these 5 radio halos alone we find , fully consistent with the correlation obtained for the total sample.
3.1.2 Possible biases in the selection of the sample
Since the correlation is the driving correlation, one has to check whether this correlation may not be forced by observational biases due to the selection of the radio halo population itself. Indeed the great majority of these radio halos have been discovered by follow-ups of candidates, mostly identified from the NVSS which is surface brightness-limited for resolved sources111The rms brightness fluctuations in the NVSS are mJy/beam (beam=4545 arcsec, Condon et al. 1998); the NVSS is sensitive to radio sources with size (appropriate for radio halos at ; GTF99). and this may introduce biases in the selected sample.
The upper bound of the correlation is likely to be solid: objects as powerful as those at the upper end of the correlation () but with small (similar to that of radio halos in the lower end of the correlation) should appear in the NVSS up to the largest redshifts of the sample, since, even at , they should be 10 times brighter than the low power radio halos in the correlation and extended (). As a matter of fact A545 (z=0.15) and A520 (z=0.2), which are among the smaller radio halos in our sample, are already detected in the NVSS up to a redshift 0.2 and there is no reason why objects with similar extension, but times brighter than A545 and A520, should not have been detected at .
The lower bound of the correlation deserves much care since the brightness limit of the NVSS may play some role. It is clear that present surveys may significantly affect the selection of the faint end of the radio halo population. However, Feretti (2005) and Clarke (2005), have already concluded that the typical brightness of the powerful and giant radio halos are well above the detection limit.
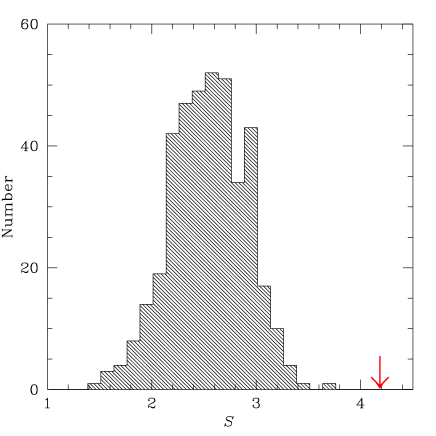
In any case, a brightness limit should drive a correlation, much flatter then the observed one. In order to provide a further compelling argument against observational biases, we have run Monte Carlo simulations. To this end we have randomly extracted brightness values of hypothetical radio halos within a factor of interval (consistently with the range spanned in our sample) above a given minimum brightness and each time randomly assigned and z among the observed values. In Fig.7 we report the distribution of the slopes obtained with our Monte Carlo procedure and note that this distribution is peaked around with a dispersion of (this is somewhat steeper than the expected due to the well known redshift effect, however small given the small redshift range of our sample). The values of the slopes from the Monte Carlo procedure are far from the observed value (Fig.7) and a statistical test allows us to conclude that the probability that the observed correlation is forced by observational biases is .
3.2 Geometrical scaling for radio halos
The existence of a possible tight scaling between the size of radio halos and the cluster mass within the emitting region is not reported in the literature. Yet an observational scaling may be important to relate virial quantities () with quantities ( and ) which refer to the emitting region, and to test simple model expectations (Sect. 2.2).
At this stage of the paper, the main difficulty concerns the measure of the cluster mass inside a volume of size . Here the only possibility is to use the X-ray mass determination based on the assumption of hydrostatic equilibrium. Nevertheless, radio halo clusters are not well relaxed systems and thus the assumption of hydrostatic equilibrium and spherical symmetry may introduce sizeable errors in the mass determination. Several numerical simulation studies, which have been undertaken in order to determine whether the above assumptions introduce significant uncertainties in the mass estimates, indicate that in the case of merging clusters the hydrostatic equilibrium method might lead to errors up to 40% of the true mass, which can be either overestimated or underestimated (e.g., Evrard et al. 1996; Röttiger et al. 1996; Schindler 1996; Rasia et al. 2006). This would cause an unavoidable scattering in the determination of the mass in our sample, although there are indications that a better agreement between the gravitational lensing, X-ray and optically determined cluster masses is achieved on scales larger than the X-ray core radii (e.g., Wu 1994; Allen 1998; Wu et al. 1998), which is the case under consideration ().
However, what is important here is that the mass determination does not introduce systematic errors which depend on the mass itself and which may thus affect the real trend of the correlation. We thus compute the total gravitational cluster mass within the radius as:
| (7) |


where is the core radius, the isothermal gas temperature and the ratio between the kinetic energy of the dark matter and that of the gas (-model; e.g., Sarazin 1986). We have excluded from our analysis A2254 for which no information on the -model is available. For the remaining 14 clusters references are given in CBS06. From Eq.7 one has that for and for . In Fig.8 we plot versus for our sample: we find , which falls in between the above asymptotic expectations.
3.3 Radio power versus mass and velocity dispersion
In principle, the two correlations discussed so far for giant radio halos, and , imply the existence of correlations between and . In particular is expected to roughly scale as . In Fig.9 we report versus for our sample together with the best-fit: , which is indeed in line with the above expectation. A Spearman test of this correlation yields a correlation coefficient of and significance, indicative of a very strong correlation.
is expected to scale with and we found for our sample a best-fit correlation: ; a Spearman test yields a correlation coefficient of and to significance, indicative of a very strong correlation.
Finally, as a by-product of all the derived scalings, it is worth noticing that also a trend between is expected (Fig.10). This finding might also be tested by observations in the optical domain which can directly constrain the velocity dispersion.

4 Implications of the derived scalings
Given that the larger radio halos are also the most powerful ones and are hosted in the most massive clusters, we expect that the size of a giant radio halo should scale with the size of the hosting cluster. We estimate for each cluster of our sample the virial radius () by combining the virial mass–X-ray correlation (; CBS06) and the virial radius-virial mass relation (e.g. Kitayama & Suto 1996). This method allows to reduce the effect of scattering due to the uncertainties in the mass measurements (and thus in the ) of merging galaxy clusters (see discussion in CBS06). In Fig.11 we plot versus for our sample. The best fit gives , i.e. a pronounced non-linear increase of the size of the radio emitting region with the virial radius. A Spearman test yields a correlation coefficient of and significance, indicative of a relatively strong correlation, albeit less strong than the others correlations found in this paper.
Given that massive clusters are almost self similar (e.g. Rosati et al. 2002) one might have expected that scales with and that the radial profiles of the radio emission are self-similar. On the contrary, our results prove that self-similarity is broken in the case of the non-thermal cluster components. This property of radio halos was also noticed by Kempner & Sarazin (2001), which used a sample of radio halos taken from Feretti (2000) and found evidence for a trend of the Largest Linear Size, LLS, with the X-ray luminosity in the 0.1-2.4 keV band, , while a flatter scaling, is expected in the case of a self-similarity. Their results imply ; if one takes , this is substantially in line with our findings. It is also worth noticing that X-ray–radio comparison studies of a few radio halos indicates that the profile of the radio emission is typically broader than that of the thermal emission (e.g., Govoni et al. 2001b). The two ingredients which should be responsible for the break of the self–similarity are the distributions of relativistic electrons and magnetic fields. In MHD cosmological simulations (Dolag et al. 2002, 2005) it is found that the magnetic field strength in cluster cores increases non-linearly with cluster mass (temperature). This implies that the radio emitting volume should increase with cluster mass because the magnetic field at a given distance from the centre increases with increasing the mass. A detailed analysis of the magnetic field profiles of massive clusters from MHD simulations could be of help in testing if the magnetic field is the principal cause of the break of the self-similarity.
5 Particle re-acceleration model and observed scalings
Although we have been guided by the analysis of Eq.2 to predict the existence of scaling relationships, the observed correlations derived in Sec. 3 are actually independent from the form of this equation. To test Eq.2 against the observed quantities of our sample of radio halos we make use of the monochromatic instead of the unavailable bolometric . This is possible because the typical spectral shape of radio halos is () and thus the K-correction is not important (CBS06).

In Fig.12 we report versus . The best fit gives . The observed scaling is slightly steeper, but still in line with the linear scaling expected from Eq.2 for constant (dashed line). As already discussed in Sec. 2.2 is constant for or in the case in which the rms magnetic field in the radio halo region is quite independent from the cluster mass (small ), while formally a non–constant always implies a steepening of the scaling. Namely, in the case of G magnetic fields, by combining Eq.2 with the observed correlation (Sec. 3.2, Fig.8), one has that the best-fit in Fig.12 is fulfilled by the model expectations for .
In principle the fit can be used to set constraints on the values of the theoretical parameters entering the normalization of Eq.2, (namely , and the fraction of the PdV work which goes into turbulence), but we will not pursue this any further here (see CB05 for a discussion).
It is important to stress that not only the trend in Fig. 12, but also the existence of the correlations found in Sec. 3 could have been predicted on the basis of the re-acceleration model (Sec. 2, Eqs. 3, 4, 5) under the very reasonable assumption that . Indeed, if one uses the observed scaling to fix the parameter , from Eq.2, and assuming the most simple case in which is constant, one finds and , which are actually consistent (within the dispersion) with the observed correlations (Sec. 3); as in the case of the trend in Fig. 12, an even better fulfillment of all these correlations is obtained for a slightly non-constant .
A relevant point which derive from the comparison of model expectation and observed correlations (unless ) is that, at least under our simplified approach (Sec. 2.2), does not critically depend on cluster mass inside and that radio halos might essentially select the regions of the cluster volume in which the magnetic field strength is above some minimum value (say G level). It is important to note that a roughly constant with cluster mass does not contradict the scaling of B, averaged in a fixed volume, with cluster mass (or temperature) found in the MHD simulations (B within the cluster core radius, ), and also found in CBS06 (B averaged within a fixed region of size), because the magnetic field is averaged over a volume of radius that becomes substantially larger than the core radius with increasing the cluster mass ( goes from to with increasing cluster mass in our sample).
6 Summary & Conclusions
The particle re-acceleration model is a promising possibility to explain the origin and properties of the giant radio halos (e.g., Brunetti 2004; Blasi 2004; Hwang 2004; Feretti 2005, for recent reviews).
In its simplest form, as assumed here (Sect.2), it predicts
a very simple relationship (Eq.2) between the total radio power , the total mass within the radio halo, the gas velocity dispersion and the average magnetic field .
Under the assumption of a tight scaling between and the size , and that the gas is in gravitational equilibrium, Eq.2 naturally translates into simple scaling relations: , , and (Eqs. 3, 4, 5).
Motivated by the above theoretical considerations, we have searched for the existence of this type of correlations by analyzing a sample of 15 galaxy clusters with giant radio halos. A most important point here is the measure of the size , in itself a non-trivial matter, since the brightest radio halos may appear more extended in the radio maps and this might force artificial correlations with radio power. A careful analysis of published 15 GHz radio maps of the radio halos of our sample shows that this effect is not present (Sec.3.1.1). From the same data set we derive a meaningful estimate of the radius for each radio halos. We also show that our procedure leads to estimates fully consistent with the measurements from the brightness profiles worked out from the data for the five most regular radio halos; this consistency holds over the total range spanned by in our sample (Sect. 3.1.1).
We obtain a good, new correlation (correlation coefficient ) between the observed radio power at 1.4 GHz and the measured size of the radio halos in the form (Sect.3.1). In Sect.3.1.2 we discuss in detail several selection effects which might affect this correlation and conclude that it is unlikely that the observed correlation is driven by observational biases.
We address observationally also the presence of a tight scaling between and and this allows us to relate virial quantities to quantities in the emitting region.
The presence of the and correlations implies also other correlations. We derive relatively strong correlations (Sect. 3.3) in the form: and , and, as a byproduct,
also .
A correlation between the size and the cluster virial radius, , is qualitatively expected in the framework of the particle re-acceleration model.
In Sec. 4 we compare vs. for our sample of clusters with giant radio halos, obtaining the non-linear trend , i.e., the fraction of the cluster volume that is radio emitting significantly increases with the cluster mass. This break of the self-similarity, in line with previous suggestions (e.g., Kempner & Sarazin 2001), points to the changing distributions of the magnetic fields and relativistic electrons with cluster mass and, as such, is potentially important in constraining the physical parameters entering the hierarchical formation scenario, such as the turbulence injection scale and the magnetic field strength and profile. Finally, we note that, by combining the and correlations, one easily derives , which is consistent with previous findings (; CBS06).
These observed correlations are well understood in the framework of the particle re-acceleration model. Indeed, we show that the theoretical expectation (Eq.2) is consistent with the data (see Fig.12).
Assuming a simple constant form for in Eq.2 and
the observed scaling, which is necessary to fix the model parameter (Sect.2), the model expectations (Eqs. 4, 3, 5) naturally translates into , and correlations, all consistent (within the dispersion) with the observed correlations; an even better fulfillment of all these correlations is obtained for a slightly non-constant , which corresponds to field in the radio halo region.
Unless it is , from the comparison of model expectations and observations we conclude that should not strongly depend on , and thus in our simplified scenario (Sec. 2.2) radio halos essentially trace the regions of G fields in galaxy clusters in which particle
acceleration is powered by turbulence.
To conclude, the particle re-acceleration model, closely linked to the development of the turbulence in the hierarchical formation scenario, appears to provide a viable and basic physical interpretation for all the correlations obtained so far with the available data for giant radio halos. Future deep radio surveys and upcoming data from LOFAR and LWA will be crucial to improve the statistics and to provide further constraints on the origin of radio halos.
Acknowledgments
RC acknowledge the MPA in Garching for the hospitality during the preparation of this paper. We thank Matteo Murgia for the use of the SYNAGE++ program. We thank Luigina Feretti for providing the data for A2163, A545 and A2319, and Marco Bondi for useful discussions. This work is partially supported by MIUR and INAF under grants PRIN2004, PRIN2005 and PRIN-INAF2005.
References
- [1] Allen S.W., 1998, MNRAS 296, 392
- [2] Bacchi M., Feretti L., Giovannini G., Govoni F., 2003, A&A, 400, 465
- [3] Blasi P., 2004, JKAS 37, 483.
- [4] Blasi P., Colafrancesco S., 1999, APh 12, 169
- [5] Borgani S., 2006, Lectures for 2005 Guillermo Haro Summer School on Clusters, to appear in ”Lecture notes in Physics” (Springer), astro-ph/0605575
- [6] Brüggen, M., Ruszkowski, M., Simionescu, A., Hoeft, M., & Dalla Vecchia, C. 2005, ApJ, 631, L21
- [7] Brunetti G., 2004, JKAS 37, 493
- [8] Brunetti G., 2006, AN 327, 615
- [9] Brunetti G., Setti G., Feretti L., Giovannini G., 2001, MNRAS 320, 365
- [10] Brunetti G., Blasi P., Cassano R., Gabici S., 2004, MNRAS 350, 1174
- [11] Brunetti G., Lazarian A., 2007, MNRAS in press, astro-ph/0703591
- [12] Buote D.A, 2001, ApJ 553, 15
- [13] Cassano R. & Brunetti G., 2005, MNRAS 357, 1313 (CB05)
- [14] Cassano R., Brunetti G., Setti G., 2006, MNRAS 369,1577(CBS06)
- [15] Clarke T.E., 2005, ASP Conference Series, Eds. by N.E. Kassim, M.R. Perez, W.Junor and P.A. Henning, Vol 345, pag. 227
- [16] Clarke T.E., Enßlin T.A., 2006, AJ 131, 2900
- [17] Colafrancesco S., 1999, in ”Diffuse thermal and relativistic plasma in galaxy clusters”. Bohringer H., Feretti L., Schuecker P. Eds., Garching, Germany: MPE 271, p.269
- [18] Condon J.J., Cotton W.D., Greisen E.W., Yin Q.F., Perley R.A., Taylor G.B., Broderick J.J., 1998, AJ 115, 1693
- [19] Dennison B., 1980, ApJ 239L
- [20] Dolag K., Bartelmann M., Lesch H, 2002, A&A 387, 383
- [21] Dolag K., Grasso D., Springel V., Tkachev I.,2005,JCAP 1, 9
- [22] Evrard A.E., Metzler C.A., Navarro J.F., 1996, ApJ 469, 494
- [23] Enßlin T.A., Röttgering H., 2002, A&A, 396, 83
- [24] Feretti L., 2000, Invited review at IAU 199 ‘The Universe at Low Radio Frequencies’ in Pune, India, 1999
- [25] Feretti L., 2003, in ’Matter and Energy in Clusters of Galaxis’, ASP Conf. Series, vol.301, p.143, eds. S. Bowyer and C.-Y. Hwang.
- [26] Feretti L., 2005, in ’X-Ray and Radio Connections’, published electronically by NRAO, eds. L.O.Sjouwerman and K.K.Dyer
- [27] Feretti L., Giovannini G., Bohringer H., 1997, New Astronomy 2, 501
- [28] Feretti L., Fusco-Femiano R., Giovannini G., Govoni F., 2001, A&A, 373, 106
- [29] Giovannini G., Tordi M., Feretti L., 1999, NewA 4, 141
- [30] Giovannini G., Feretti L., 2000, New Astronomy 5, 335 in ’Merging Processes in Galaxy Cluster’, vol.272, p.197, eds. L.Feretti, I.M.Gioia, G.Giovannini
- [31] Gitti M., Brunetti G., Setti G., 2002, A&A 386, 456
- [32] Govoni F., Feretti L., Giovannini G., Böringer H., Reiprich T.H., Murgia M., 2001a, A&A, 376, 803
- [33] Govoni F., Enßlin T.A., Feretti L., Giovannini G., 2001b, A&A 369, 441
- [34] Govoni F., Markevitch M., Vikhlinin A., VanSpeybroeck L., Feretti, L., Giovannini G., 2004, ApJ 605, 695
- [35] Govoni F., Murgia M., Feretti L., Giovannini G., Dallacasa D., Taylor G. B., 2005, A&A, 430, L5
- [36] Henry J.P., Finoguenov A.; Briel U.G., 2004, ApJ 615, 181
- [37] Hwang C.-Y., 2004, JKAS 37, 461
- [38] Jubelgas M., Springel V., Ensslin T.A., Pfrommer C., 2006, sub.to A&A, astro-ph/0603485
- [39] Kempner J.C., Sarazin C.L., 2001, ApJ 548, 639
- [40] Kitayama T., Suto Y., 1996, ApJ.469, 480
- [41] Kuo P.-H., Hwang C.-Y.; Ip, W.-H., 2003, ApJ 594, 732
- [42] Kuo, P.-H.; Hwang, C.-Y.; Ip, W.-H., 2004, ApJ 604, 108
- [43] Liang H., 1999, in ”Diffuse thermal and relativistic plasma in galaxy clusters”. Bohringer H., Feretti L., Schuecker P. Eds., Garching, Germany : MPE 271, p.33
- [44] Markevitch M., Mazzotta P., Vikhlinin A., Burke D., Butt Y., David L., Donnelly H., Forman W. R., Harris D., Kim D.-W., and 2 coauthors, 2003, ApJ 586, 19
- [45] Murgia M, 2001, Ph.D Thesis, Univerity of Bologna
- [46] Navarro J. F., Frenk C. S., White S. D. M., 1997, ApJ 490, 493
- [47] Ohno H. Takizawa M., Shibata S., 2002, ApJ 577, 658
- [48] Petrosian V., 2001, ApJ 557, 560
- [49] Pfrommer C., Enßlin T.A., 2004, A&A 413, 17
- [50] Rasia E., Ettori S., Moscardini L., Mazzotta P., Borgani S., Dolag K., Tormen G., Cheng L.M., Diaferio A, 2006, MNRAS 369, 2013
- [51] Ricker P.M., Sarazin C.L., 2001, ApJ 561, 621
- [52] Reiprich T.H., Böhringer H., 2002, ApJ 567, 716
- [53] Rosati P., Borgani S., Norman C. 2002, ARA&A 40, 539
- [54] Roettiger K., Burns J.O., Loken C., 1996, ApJ 473, 651
- [55] Roettiger K., Loken C.; Burns J.O., 1997, ApJS 109, 307
- [56] Sarazin C.L., 1986, Reviews of Modern Physics 58, 1
- [57] Schindler S., 1996, A&A 305, 756
- [58] Schuecker P., Böhringer H.; Reiprich T.H., Feretti L., 2001, A&A 378, 408
- [59] Subramanian, K., Shukurov, A., & Haugen, N. E. L. 2006, MNRAS 366, 1437
- [60] Tormen G.; Moscardini L.; Yoshida N., 2004, MNRAS 350, 1397
- [61] Vazza F., Tormen G., Cassano R., Brunetti G., Dolag K., 2006, MNRAS 369L, 14 (V06)
- [62] Wu X.-P., 1994, ApJ 436, L115
- [63] Wu X.-P., Chiueh T., Fang L.-Z., Xue Y.-X., 1998, MNRAS 301, 861