High statistics measurement of the cross sections of
production
T. Mori
Nagoya University, Nagoya
S. Uehara
High Energy Accelerator Research Organization (KEK), Tsukuba
Y. Watanabe
Kanagawa University, Yokohama
K. Abe
Tohoku Gakuin University, Tagajo
I. Adachi
High Energy Accelerator Research Organization (KEK), Tsukuba
H. Aihara
Department of Physics, University of Tokyo, Tokyo
K. Arinstein
Budker Institute of Nuclear Physics, Novosibirsk
V. Aulchenko
Budker Institute of Nuclear Physics, Novosibirsk
T. Aushev
Swiss Federal Institute of Technology of Lausanne, EPFL, Lausanne
Institute fo
r Theoretical and Experimental Physics, Moscow
A. M. Bakich
University of Sydney, Sydney, New South Wales
V. Balagura
Institute for Theoretical and Experimental Physics, Moscow
E. Barberio
University of Melbourne, School of Physics, Victoria 3010
A. Bay
Swiss Federal Institute of Technology of Lausanne, EPFL, Lausanne
K. Belous
Institute of High Energy Physics, Protvino
U. Bitenc
J. Stefan Institute, Ljubljana
I. Bizjak
J. Stefan Institute, Ljubljana
S. Blyth
National Central University, Chung-li
A. Bondar
Budker Institute of Nuclear Physics, Novosibirsk
M. Bračko
High Energy Accelerator Research Organization (KEK), Tsukuba
University of
Maribor, Maribor
J. Stefan Institute, Ljubljana
T. E. Browder
University of Hawaii, Honolulu, Hawaii 96822
M.-C. Chang
Department of Physics, Fu Jen Catholic University, Taipei
A. Chen
National Central University, Chung-li
W. T. Chen
National Central University, Chung-li
B. G. Cheon
Hanyang University, Seoul
I.-S. Cho
Yonsei University, Seoul
S.-K. Choi
Gyeongsang National University, Chinju
Y. Choi
Sungkyunkwan University, Suwon
J. Dalseno
University of Melbourne, School of Physics, Victoria 3010
M. Dash
Virginia Polytechnic Institute and State University, Blacksburg, Virginia 24061
A. Drutskoy
University of Cincinnati, Cincinnati, Ohio 45221
S. Eidelman
Budker Institute of Nuclear Physics, Novosibirsk
S. Fratina
J. Stefan Institute, Ljubljana
N. Gabyshev
Budker Institute of Nuclear Physics, Novosibirsk
B. Golob
University of Ljubljana, Ljubljana
J. Stefan Institute, Ljubljana
H. Ha
Korea University, Seoul
K. Hayasaka
Nagoya University, Nagoya
H. Hayashii
Nara Women’s University, Nara
M. Hazumi
High Energy Accelerator Research Organization (KEK), Tsukuba
D. Heffernan
Osaka University, Osaka
T. Hokuue
Nagoya University, Nagoya
Y. Hoshi
Tohoku Gakuin University, Tagajo
W.-S. Hou
Department of Physics, National Taiwan University, Taipei
T. Iijima
Nagoya University, Nagoya
K. Ikado
Nagoya University, Nagoya
A. Imoto
Nara Women’s University, Nara
K. Inami
Nagoya University, Nagoya
A. Ishikawa
Department of Physics, University of Tokyo, Tokyo
R. Itoh
High Energy Accelerator Research Organization (KEK), Tsukuba
M. Iwasaki
Department of Physics, University of Tokyo, Tokyo
Y. Iwasaki
High Energy Accelerator Research Organization (KEK), Tsukuba
H. Kaji
Nagoya University, Nagoya
J. H. Kang
Yonsei University, Seoul
P. Kapusta
H. Niewodniczanski Institute of Nuclear Physics, Krakow
N. Katayama
High Energy Accelerator Research Organization (KEK), Tsukuba
T. Kawasaki
Niigata University, Niigata
H. Kichimi
High Energy Accelerator Research Organization (KEK), Tsukuba
H. O. Kim
Sungkyunkwan University, Suwon
S. K. Kim
Seoul National University, Seoul
Y. J. Kim
The Graduate University for Advanced Studies, Hayama
S. Korpar
University of Maribor, Maribor
J. Stefan Institute, Ljubljana
P. Križan
University of Ljubljana, Ljubljana
J. Stefan Institute, Ljubljana
P. Krokovny
High Energy Accelerator Research Organization (KEK), Tsukuba
R. Kumar
Panjab University, Chandigarh
C. C. Kuo
National Central University, Chung-li
A. Kuzmin
Budker Institute of Nuclear Physics, Novosibirsk
Y.-J. Kwon
Yonsei University, Seoul
M. J. Lee
Seoul National University, Seoul
S. E. Lee
Seoul National University, Seoul
T. Lesiak
H. Niewodniczanski Institute of Nuclear Physics, Krakow
J. Li
University of Hawaii, Honolulu, Hawaii 96822
A. Limosani
High Energy Accelerator Research Organization (KEK), Tsukuba
S.-W. Lin
Department of Physics, National Taiwan University, Taipei
D. Liventsev
Institute for Theoretical and Experimental Physics, Moscow
J. MacNaughton
Institute of High Energy Physics, Vienna
F. Mandl
Institute of High Energy Physics, Vienna
T. Matsumoto
Tokyo Metropolitan University, Tokyo
A. Matyja
H. Niewodniczanski Institute of Nuclear Physics, Krakow
S. McOnie
University of Sydney, Sydney, New South Wales
T. Medvedeva
Institute for Theoretical and Experimental Physics, Moscow
H. Miyake
Osaka University, Osaka
H. Miyata
Niigata University, Niigata
Y. Miyazaki
Nagoya University, Nagoya
R. Mizuk
Institute for Theoretical and Experimental Physics, Moscow
G. R. Moloney
University of Melbourne, School of Physics, Victoria 3010
Y. Nagasaka
Hiroshima Institute of Technology, Hiroshima
E. Nakano
Osaka City University, Osaka
M. Nakao
High Energy Accelerator Research Organization (KEK), Tsukuba
H. Nakazawa
National Central University, Chung-li
Z. Natkaniec
H. Niewodniczanski Institute of Nuclear Physics, Krakow
S. Nishida
High Energy Accelerator Research Organization (KEK), Tsukuba
O. Nitoh
Tokyo University of Agriculture and Technology, Tokyo
S. Noguchi
Nara Women’s University, Nara
T. Ohshima
Nagoya University, Nagoya
S. Okuno
Kanagawa University, Yokohama
S. L. Olsen
University of Hawaii, Honolulu, Hawaii 96822
S. Ono
Tokyo Institute of Technology, Tokyo
Y. Onuki
RIKEN BNL Research Center, Upton, New York 11973
W. Ostrowicz
H. Niewodniczanski Institute of Nuclear Physics, Krakow
H. Ozaki
High Energy Accelerator Research Organization (KEK), Tsukuba
P. Pakhlov
Institute for Theoretical and Experimental Physics, Moscow
G. Pakhlova
Institute for Theoretical and Experimental Physics, Moscow
C. W. Park
Sungkyunkwan University, Suwon
H. Park
Kyungpook National University, Taegu
K. S. Park
Sungkyunkwan University, Suwon
R. Pestotnik
J. Stefan Institute, Ljubljana
L. E. Piilonen
Virginia Polytechnic Institute and State University, Blacksburg, Virginia 24061
A. Poluektov
Budker Institute of Nuclear Physics, Novosibirsk
H. Sahoo
University of Hawaii, Honolulu, Hawaii 96822
Y. Sakai
High Energy Accelerator Research Organization (KEK), Tsukuba
N. Satoyama
Shinshu University, Nagano
O. Schneider
Swiss Federal Institute of Technology of Lausanne, EPFL, Lausanne
J. Schümann
High Energy Accelerator Research Organization (KEK), Tsukuba
K. Senyo
Nagoya University, Nagoya
M. E. Sevior
University of Melbourne, School of Physics, Victoria 3010
M. Shapkin
Institute of High Energy Physics, Protvino
C. P. Shen
Institute of High Energy Physics, Chinese Academy of Sciences, Beijing
H. Shibuya
Toho University, Funabashi
B. Shwartz
Budker Institute of Nuclear Physics, Novosibirsk
J. B. Singh
Panjab University, Chandigarh
A. Sokolov
Institute of High Energy Physics, Protvino
A. Somov
University of Cincinnati, Cincinnati, Ohio 45221
N. Soni
Panjab University, Chandigarh
S. Stanič
University of Nova Gorica, Nova Gorica
M. Starič
J. Stefan Institute, Ljubljana
H. Stoeck
University of Sydney, Sydney, New South Wales
T. Sumiyoshi
Tokyo Metropolitan University, Tokyo
S. Y. Suzuki
High Energy Accelerator Research Organization (KEK), Tsukuba
F. Takasaki
High Energy Accelerator Research Organization (KEK), Tsukuba
K. Tamai
High Energy Accelerator Research Organization (KEK), Tsukuba
M. Tanaka
High Energy Accelerator Research Organization (KEK), Tsukuba
G. N. Taylor
University of Melbourne, School of Physics, Victoria 3010
Y. Teramoto
Osaka City University, Osaka
X. C. Tian
Peking University, Beijing
I. Tikhomirov
Institute for Theoretical and Experimental Physics, Moscow
T. Tsuboyama
High Energy Accelerator Research Organization (KEK), Tsukuba
T. Tsukamoto
High Energy Accelerator Research Organization (KEK), Tsukuba
K. Ueno
Department of Physics, National Taiwan University, Taipei
T. Uglov
Institute for Theoretical and Experimental Physics, Moscow
Y. Unno
Hanyang University, Seoul
S. Uno
High Energy Accelerator Research Organization (KEK), Tsukuba
P. Urquijo
University of Melbourne, School of Physics, Victoria 3010
Y. Usov
Budker Institute of Nuclear Physics, Novosibirsk
G. Varner
University of Hawaii, Honolulu, Hawaii 96822
K. Vervink
Swiss Federal Institute of Technology of Lausanne, EPFL, Lausanne
S. Villa
Swiss Federal Institute of Technology of Lausanne, EPFL, Lausanne
A. Vinokurova
Budker Institute of Nuclear Physics, Novosibirsk
C. H. Wang
National United University, Miao Li
P. Wang
Institute of High Energy Physics, Chinese Academy of Sciences, Beijing
E. Won
Korea University, Seoul
Q. L. Xie
Institute of High Energy Physics, Chinese Academy of Sciences, Beijing
B. D. Yabsley
University of Sydney, Sydney, New South Wales
A. Yamaguchi
Tohoku University, Sendai
Y. Yamashita
Nippon Dental University, Niigata
C. C. Zhang
Institute of High Energy Physics, Chinese Academy of Sciences, Beijing
Z. P. Zhang
University of Science and Technology of China, Hefei
V. Zhilich
Budker Institute of Nuclear Physics, Novosibirsk
V. Zhulanov
Budker Institute of Nuclear Physics, Novosibirsk
A. Zupanc
J. Stefan Institute, Ljubljana
(April 5, 2007)
Abstract
We report on a high statistics measurement of the total and differential
cross sections of the process
in the invariant mass range
with 85.9 fb-1 of data collected at GeV
and 10.52 GeV with the Belle detector.
A clear signal of the resonance is
observed in addition to the resonance.
An improved 90% confidence level upper limit
is obtained for - and -violating
decay of the meson using the most conservative assumption
about the interference with the background.
The nature of low mass mesons remains poorly understood
in spite of decades of theoretical and experimental effort bib:scalar .
In particular, low mass scalar mesons (below 1 ) are not yet
well established experimentally except for
the and mesons, while the
extensively discussed and () mesons
still remain controversial states bib:PDG .
A factory is well suited for detailed investigations
of low mass mesons through two-photon production, where overwhelming
statistics can be obtained.
Two-photon production of mesons has advantages over
meson production in hadronic processes;
the production rate can be reliably calculated from QED
with as the only unknown parameter.
In addition, a meson can be produced alone without additional hadronic
debris,
and the quantum numbers of the final state are restricted to states of
charge conjugation with forbidden
(Landau-Yang’s theorem bib:Yang ).
In the past, extensive studies of low mass mesons through
scattering
have been made at colliders:
Crystal Ball bib:crysball , Mark II bib:mark2 ,
JADE bib:JADE , TOPAZ bib:TOPAZ ,
MD-1 bib:md1 , CELLO bib:CELLO
and VENUS bib:VENUS ; see Ref. bib:PDG
for a list of the earlier experiments.
Using data from Mark II, Crystal Ball, and CELLO,
Boglione and Pennington (BP) performed an amplitude analysis
of and
cross sections bib:amplitude .
They found two distinct classes of solutions where
one solution has a peak (“peak” solution) and the other has a wiggle
(“dip” solution) in the mass region.
The two solutions give quite different results
for the two-photon width of the and
the size of the S-wave component.
Thus, it is necessary to distinguish them experimentally.
In this paper, we report on a measurement of the cross sections
for the reaction
with high statistics that are more than two orders of
magnitude larger than that of the past experiments.
The analysis is based on data taken with the
Belle detector at the KEKB asymmetric-energy (3.5 GeV on 8 GeV)
collider bib:kekb .
The data sample corresponds to a total integrated luminosity of 85.9 fb-1,
accumulated on the resonance
and 60 MeV below the resonance (8.6 fb-1 of the total).
Since the cross section difference between the two energies is only about
0.3%, we combine both samples bib:lume .
We observe the two-photon process
in the “zero-tag” mode,
where neither the final-state electron nor positron is detected,
and the system has small transverse momentum.
We restrict the virtuality of the incident photons to
be small by imposing a strict requirement on the
transverse-momentum balance of the final-state
hadronic system with respect to the beam axis.
Some of the results reported here are the subject of
a separate paper focusing on the
properties of the meson bib:tmori .
This paper is organized as follows.
A brief description of the detector is given in section II.
The selection criteria are listed in section III.
There is a well known difficulty in discriminating
from in the low momentum region
();
Section IV presents the method of particle identification,
in particular the method of separation that we use.
Evaluation of the detection and trigger efficiencies is described in
section V.
The total and differential cross sections are given
while their systematic errors are estimated in section VI.
In section VII,
the resulting spectrum is fitted to obtain the resonance parameters
of the meson and to check consistency in the
region.
Section VIII summarizes the results.
Appendix A gives a detailed description of the background
subtraction.
Values of the total cross sections are given in Appendix B.
II The Belle Detector
The Belle detector is a large-solid-angle magnetic spectrometer having good
momentum resolution and particle identification capability
in the energy region of interest bib:belle .
Here we briefly describe the Belle detector components.
Charged track coordinates near the collision point are measured by a
3-layer silicon vertex detector (SVD) that surrounds a 2 cm radius
beryllium beam pipe.
Track trajectories are reconstructed in a 50-layer central drift chamber (CDC),
and momentum measurements are made together with the SVD.
An array of 1188 silica-aerogel Cherenkov counters (ACC) provides
separation between kaons and pions for momenta above 1.2 GeV/.
The time-of-flight counter (TOF) system consists
of a barrel of 128 plastic scintillation counters and is
effective for separation for tracks with momenta below 1.2 GeV/.
Low energy kaons and protons are also identified through specific
ionization () measurements in the CDC.
Photon detection and energy measurements of photons and electrons
are provided by an electromagnetic calorimeter (ECL).
It is comprised of an array of 8736 CsI(Tl) crystals all pointed toward
the interaction point,
greatly enhances the electron identification capability provided through
a comparison of energy measured in the ECL and momentum in the CDC.
These detector components are located within a superconducting
solenoid coil that provides a uniform magnetic field of 1.5 T.
An iron flux-return located outside the solenoid coil is instrumented
to detect mesons and to identify muons (KLM).
The axis of the detector is defined to be opposite to the direction
of the positron beam.
These detector components cover a polar angular range between
and .
III Event Selection
Signal candidates are primarily triggered by a two-track trigger
that requires two CDC tracks with associated TOF hits and ECL clusters
with an opening angle greater than .
Exclusive events are selected
by requiring two oppositely charged tracks coming from the interaction
region; each track is required to satisfy cm and cm,
where () is () component of the closest approach to the
nominal collision point.
Here, is the transverse distance from the axis.
The difference of the ’s of the two tracks must satisfy the requirement
.
The event must contain one and only one positively charged track
that satisfies and ,
where and are the transverse component of momentum
and the angle with respect to the -axis.
The scalar sum of the track momenta in each event is required to be less
than ,
and the sum of the ECL energies of the event must be less than
.
Events should not include an extra track with
.
The cosine of the opening angle of the tracks must be greater than
to reject cosmic-ray events.
The sum of transverse momentum vectors of the two tracks
should satisfy
; this requirement
separates exclusive two-track events from quasi-real two-photon collisions.
IV Particle Identification and separation
Electrons and positrons are clearly distinguished from hadrons using
the ratio , where is the energy measured in
the ECL, and is the momentum from the CDC.
Kaon (proton) candidates are identified using normalized kaon
(proton) and pion
likelihood functions ( () and , respectively)
obtained from the particle identification system (combining the
information of the CDC, TOF, ACC and ECL)
with the criterion (),
which gives a typical identification efficiency of 90% with a pion
misidentification probability of 3%.
All charged tracks that are not identified as electrons, kaons or protons are
treated as pions.
We require both tracks to be pions.
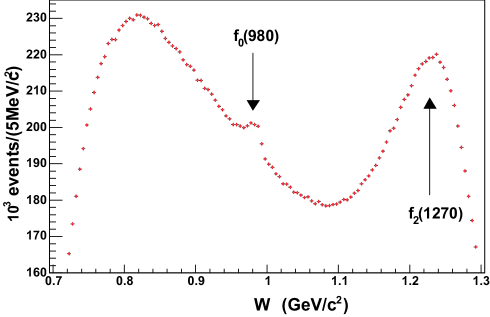
The resulting invariant mass () distribution is shown in
Fig. 1.
The bin size is chosen to be 5 , while the mass resolution
is about 2 according to GEANT-3 bib:geant based Monte Carlo
(MC) simulation.
A clear signal corresponding to the meson is seen along with the
well known resonance.
Figure 1: The invariant mass distribution of unseparated
() events. A clear signal for the can be seen.
The large peak around corresponds to the
resonance. Note the suppressed zero on the vertical scale.
In this measurement, the KLM detector cannot be used for muon identification,
since it is insensitive in the region of interest where the
transverse momenta of tracks are below .
Therefore, we have developed a method
for separating and events statistically using
ECL information; muons deposit energy corresponding to the
ionization loss for minimum ionizing particles,
while pions give a wider energy distribution since they may interact
hadronically in the ECL, which corresponds to approximately one interaction
length of material.
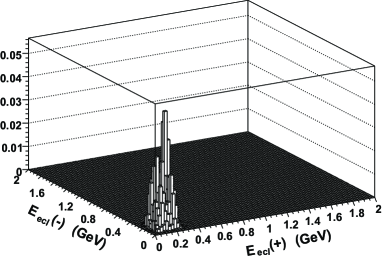
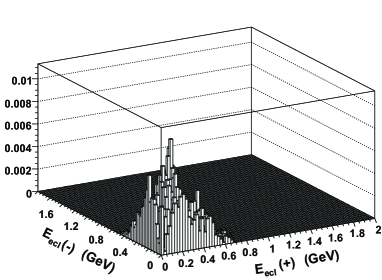
Typical two-dimensional distributions ( vs. )
of the energy deposit in the ECL for and
pairs produced by MC are shown in Figs. 2(a)
and 2(b).
(a)For
(b)For
Figure 2: Typical distributions of the energy deposit ( vs. )
in the ECL. Events are produced using MC simulation in a range
and .
Probability density functions (PDFs) for the distributions of energy deposits
from () pairs
()
are obtained with MC simulation.
Here represents the -th bin of
in 20 and 0.1 steps,
where is the invariant mass of the (or )
pair in each event (the pion mass is assumed in the calculation), and
is the polar angle of the produced meson
(or lepton) in the center-of-mass system of two initial photons.
Note that using this method the effect of muons from pion decays is taken
into account by the pion PDFs.
We obtain , the fraction of in the -th bin
through the equation:
(1)
where is the distribution of data
and is the total number of events in that bin.
The values of ratios obtained must be corrected since the
MC cannot simulate hadronic interactions accurately enough.
By introducing mis-ID probabilities,
and ,
the value for each bin (the bin number is omitted)
can be written as:
(2)
where () is the number of true
() pairs in that bin.
We assume that and
are independent of .
Applying the separation method mentioned above to a sample
of data events positively identified as muons
by the KLM information in the higher energy region,
we find that is statistically
consistent with zero.
The values of in each bin
are determined such that the ratio of the data and MC for
pairs, which is ideally one, gives a straight line in the
spectrum.
The values of vary between 0.08 to
0.13 in bins.
Because they are determined for each bin of ,
the bin-by-bin variation of systematic errors is rather large in the angular
distribution.
After subtracting events, a total of
events remains in the region of and
.
V Detection and Trigger efficiency
The detection (trigger) efficiencies,
() are estimated from a MC simulation.
Events of the process
are generated using TREPS bib:treps .
The detection efficiency is calculated from the MC simulation
as the ratio of the number of detected and generated events in each bin of
(with the bin width, 5 ) and (0.05).
The MC statistics are high enough and do not contribute to systematic
errors.
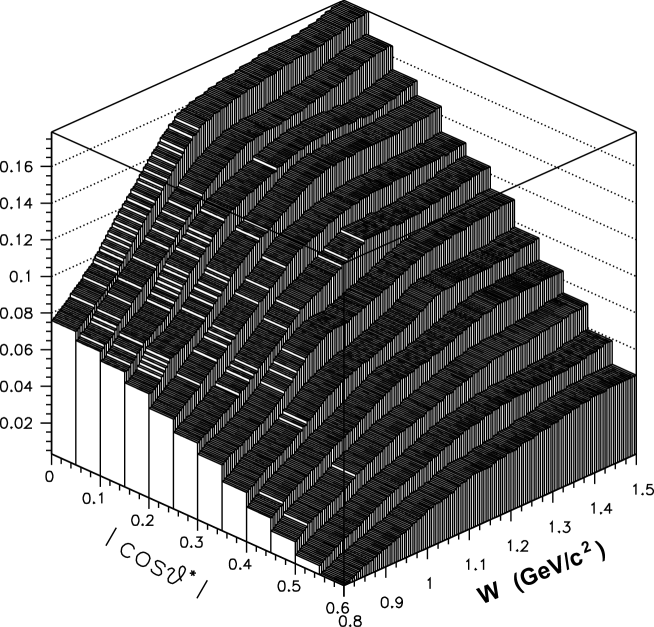
Figure 3: The combined detection and trigger efficiencies
as a function of and .
The trigger efficiencies
are estimated
with the same binning using the trigger simulator.
Since the trigger simulator does not simulate triggers very accurately,
particularly in the low energy region, the efficiency values have to be
corrected.
We calculate the correction factors by comparing the number of
events in data and MC that are triggered by
the two-track trigger.
The resulting factors steeply rise from 0.5 at to 0.8
at and then increase gradually for higher .
The combined detection and trigger efficiencies are shown in
Fig. 3.
The muon-background subtraction and all the correction factors are applied
using smooth functions obtained by parameterizing the results of bin-by-bin
analyses.
VI Cross Sections
In this section, we derive differential and total cross sections
and evaluate systematic errors.
VI.1 Differential Cross Sections
Differential cross sections for
are evaluated by using the following relation:
(3)
where is the number of events
in a - bin, is the two-photon
luminosity function bib:lum_func
and is the integrated luminosity.
Here the and bin sizes are also chosen to be
and 0.05, respectively.
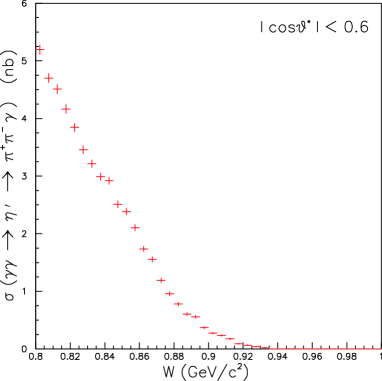
Background from
is subtracted, a detailed account of which is given in
Appendix A.
The contribution of the background to the cross section is about 5% at
0.8 and dies away quickly to zero above 0.9 .
Other backgrounds are negligible.
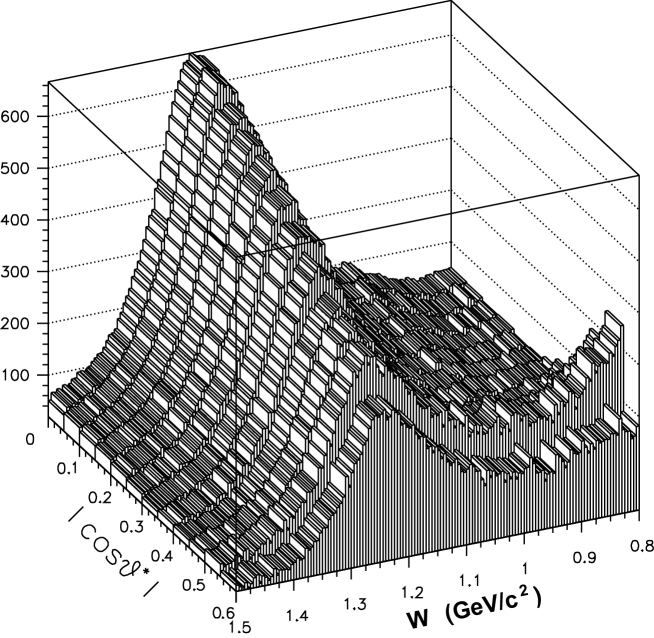
Differential cross sections
are obtained using Eq. (3) for
from 0 to 0.6
and for from 0.8 up to 1.5 .
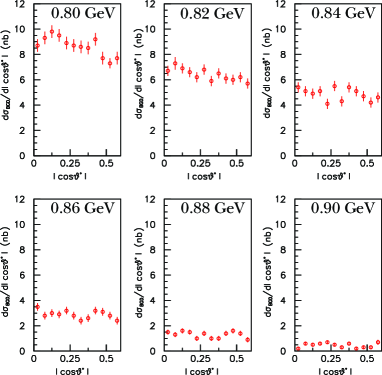
The resulting differential cross sections
are shown in Fig. 4.
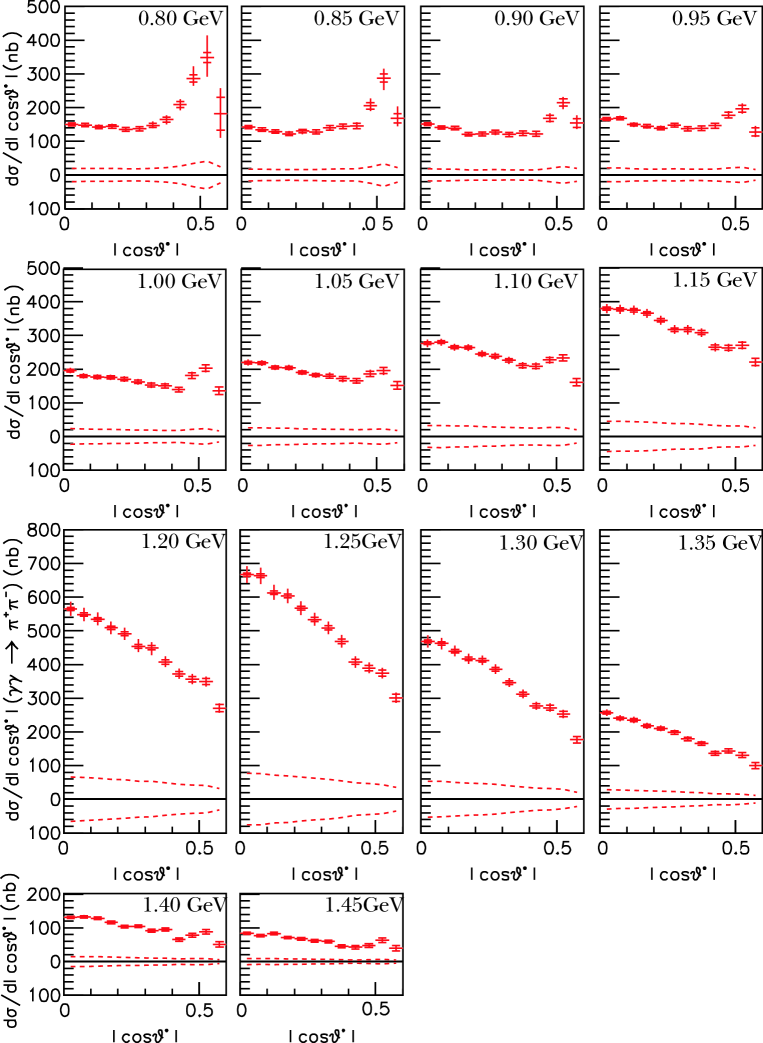
In order to present the cross sections more quantitatively,
some representative ones are also plotted in Fig. 5.
Both statistical and point-by-point errors are shown.
The latter come from the separation method and trigger efficiency
corrections we employ as explained in Sections IV and
V.
A point-by-point systematic error is taken to be one half of the difference
between the corrections in neighboring bins.
The result shows some apparent systematic structure in the region
, particularly for .
As shown below (see Eq. (4)), the differential cross sections
in this region can be described by a second order polynomial in
.
Thus, such structures are not considered to be real;
either the last points are too low or earlier points are too high.
However, we have not identified the cause of the measurement bias.
Figure 4: Differential cross sections
( (nb)).
(The -axis is reversed compared to that of Fig. 3
so as to allow a clearer view of the region in above the
resonance.)Figure 5: Representative differential cross sections
( (nb)).
In the figures, 0.80 GeV means a bin of
, etc.,
and the dashed lines indicate the upper and lower overall systematic errors.
The two short horizontal bars indicate the statistical errors while the
vertical ones include point-by-point systematic errors.
In this region, partial waves (the next one is ) may be
neglected so that only S and D waves are to be considered.
The differential cross section can be expressed as:
(4)
where () denotes the helicity 0 (2) component of the D wave
and are the spherical harmonics:
(5)
Since is not independent of and
(i.e. ), partial waves
cannot be separated from the differential cross
sections alone; additional inputs or assumptions are needed.
The general trend of the angular distribution as a function of is
as follows.
The angular distribution below is rather flat for
, indicating that
the S wave fraction is significant (Fig. 5).
In the region above , the angular dependence becomes steeper
as increases and is the steepest around the mass.
Such behavior is typical of D wave dominance.
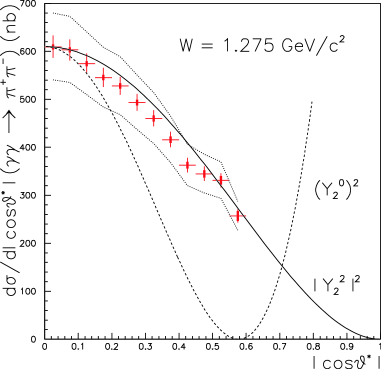
Theoretically, the helicity=2 wave () is expected to be
dominant bib:hel2 .
This is supported by Fig. 6, where
the angular dependence of and is plotted
at the mass.
Figure 6: The differential cross section of
at the mass (1.275 GeV/).
Thick vertical bars show statistical errors and thin ones
include point-by-point errors.
The dotted lines indicate the overall systematic errors.
The solid line shows the angular dependence of
and the dashed one shows that of (both normalized at
).
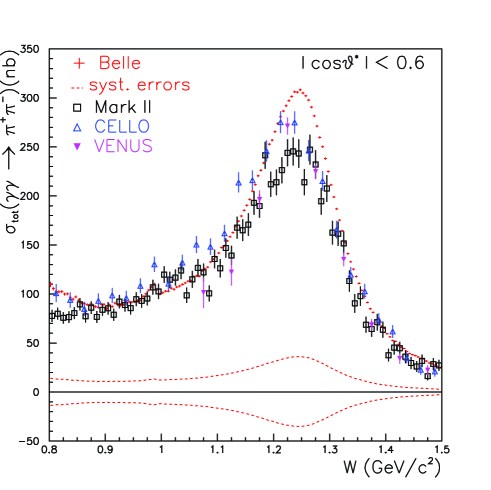
VI.2 Total Cross Section
The total cross section is then obtained by integrating the differential cross
sections over up to 0.6 and
is shown in Fig. 7
together with the results of some past experiments.
A clear peak corresponding to the meson is visible, indicating
that the peak solution of the BP analysis is preferred.
Systematic errors for the total cross section are summarized in
Table 1.
They are dominated by the uncertainty in the separation and that
of the trigger efficiency.
Systematic errors arising from the separation are estimated by
changing the value of in the allowable range
in each angular bin.
Since events are well identified by the KLM for GeV,
the allowable range is determined in this region.
These well identified events are also used in estimating
systematic errors of the trigger efficiency.
Comparing data and MC for events in the region GeV and
extrapolating linearly downward, the systematic errors are found to be 4%
at GeV and 10% at GeV.
The total systematic error is obtained by summing the systematic errors
in quadrature and is also shown in Fig. 7.
Our results are in good agreement with past experiments
except for the mass peak region, where our data points are
about 10 to 15% larger, but still within the systematic errors.
Table 1: Summary of systematic errors
for the cross section.
A range is shown when the uncertainty has dependence.
Parameter
Syst. error (%)
Tracking efficiency
2.4
Trigger efficiency
4 – 10
-separation
0 – 1
-separation
5 – 7
Luminosity function
5
Integrated luminosity
1.4
Total
11.1 – 12.3
Figure 7: The total cross section of
between 0.8 and 1.5 GeV/ for .
The Belle data are represented by crosses with statistical error bars,
the Mark II data are squares,
the CELLO data are the open triangles and the VENUS data are the filled
triangles.
Dashed lines indicate upper and lower systematic uncertainties for
the Belle data.
Numerical values are listed in Appendix B.
We do not show systematic errors for the other experiments; they are of
similar size or larger.
VII Fits to the Cross Sections
The results of the cross section measurements can be used to obtain
the parameters of and resonances, and to search for
other states decaying into .
Some of us plan to perform a full amplitude analysis in the near future
using the present data including the differential cross sections along
with published cross section data of the past.
Thus, we restrict our analysis to a simple level in this paper.
In this section, we summarize the measurement of the parameters of
the discussed in a separate paper bib:tmori ,
perform a simple fit for the resonance as a
consistency check, and search for - and -violating decay of the
meson into a pair.
VII.1 The Resonance
We have to take into account the effect of the channel that opens
within the mass region.
The fitting function for the scalar resonance is
parameterized as follows:
(6)
where
is the amplitude of the
meson bib:norm , which interferes with the helicity-0-background
amplitude with a relative phase , and
is the total background cross section.
The amplitude can be written as
(7)
where the factor 4.8 includes the fiducial angular acceptance
,
is the velocity of the
particle with mass in the two-body final state ,
and is related to the partial width
of the meson via
.
The factor is given as follows bib:denom :
(8)
where for or ,
is the real part of
, which is given by:
(9)
The phase factor is real in the region
and becomes imaginary for .
The mass difference between and is
included by taking .
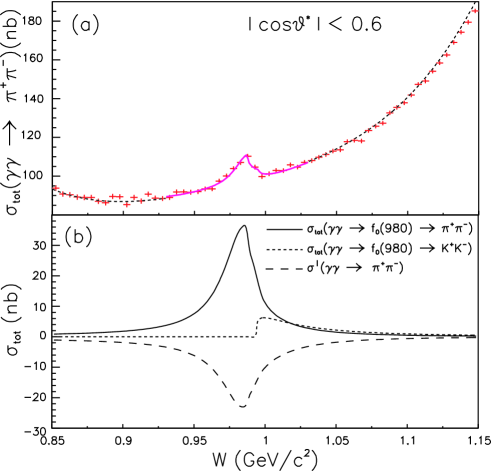
The results of the fit (shown in Fig. 8 and in
Table 2) are discussed
in a separate paper bib:tmori .
Figure 8: Results of the fit: (a) the total cross section (the solid curve)
(b) contributions of the resonance
(
(solid line) and the interference (dashed).
The cross section of
is also shown (dotted) bib:tmori .
For completeness we report here the parameters of the
meson obtained from the fit.
The two-photon width given by the PDG bib:PDG is
, and
the value found by BP is eV.
Our value of the two-photon width is consistent with them within errors.
Table 2: Fitted parameters of the region to
Eq.(6).
parameter
value
error
stat
syst
()
985.6
(GeV)
1.33
(eV)
205
(nb)
3.7
(rad)
1.74
0.90 (15)
VII.2 The Region
From the past experiments bib:crysball ; bib:mark2 ; bib:JADE ; bib:TOPAZ ; bib:md1 ; bib:CELLO ; bib:VENUS ,
it is well known that the position of the resonance peak in
two-photon production is shifted to lower mass because of interference
with non-resonant background bib:f2shift .
In this paper, we give the result of a simple fit made as a consistency check
in the region.
The relativistic Breit-Wigner resonance amplitude for a
spin- resonance of mass is given by
(10)
where is the factor coming from the limited solid angle
().
Hereafter we consider the case (the meson).
The factor is obtained assuming helicity-2
dominance bib:hel2 ;
the angular dependence is assumed to be .
The energy-dependent total width is given by
(11)
where is , , , etc.
The partial width is
parameterized as bib:blat :
(12)
where is the total width at the resonance mass,
, ,
and is an effective interaction radius that varies from 1
to 7 in different hadronic reactions bib:grayer .
For ,
the branching fractions are ,
, and ,
respectively bib:PDG .
For the and the other decay modes,
is used instead of Eq. (12).
The fitting function for the region is taken to be as follows:
(13)
where the contribution other than that of the resonance
is subdivided into the interfering part (helicity=2)
and the non-interfering part (helicity=0).
The fit region is chosen to be around the mass,
i.e. .
The parameters of the meson are fixed to the values from the PDG:
the branching fractions as listed above,
and MeV bib:PDG ,
and the parameter is floated.
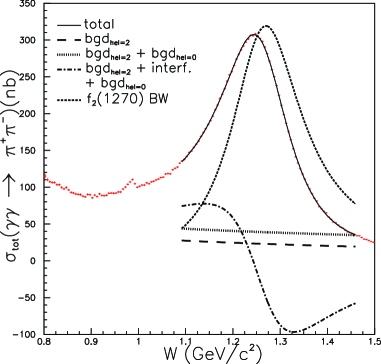
The result of the fit is shown in Fig. 9 and the
obtained parameters are summarized in Table 3, where
errors shown are statistical only.
Since a good fit is obtained with , we omit .
A fit without the non-interfering background gives much worse results
as summarized in Table 3.
We conclude that the consistency check is satisfactory.
Figure 9: Results of the fit of the region
to Eq. (13).
The parameters of the mesons are fixed to the values by the PDG
(with the helicity=0 background).
Table 3: Fitted parameters for the region
to Eq. (13).
The parameters of the meson are fixed to the values by the PDG.
Errors shown are statistical only.
parameter
with hel.=0 bgd
without hel.=0 bgd
(GeV-1)
()
(deg.)
(nb)
0 (fixed)
(nb/)
0 (fixed)
(nb/)
0 (fixed)
0 (fixed)
1.1 (68)
2.1 (70)
VII.3 The branching fraction of the meson
The meson is a pseudoscalar meson and, thus, its coupling
to violates and .
The present upper limit for the branching fraction
is 2% bib:ritten .
The high statistics data of Belle allow for a more sensitive search.
The meson has a small width of
and a mass of .
Thus its contribution to the spectrum
can be represented by a Gaussian function:
(14)
where is the parameter to be determined, and
is the mass resolution determined from MC.
The total cross section in the region
is fitted with a second-order polynomial plus Eq. (14).
The finite bin-size effect is taken into account by integrating the
Gaussian over each bin.
The result is .
The systematic error is found to be negligible, which is estimated by
constraining the mass and the mass resolution within
one standard deviation and by changing the fitting region.
The parameter can be related to the
branching fraction as follows.
The cross section formula to be used is the same as Eq. (6)
except for replacing the amplitude
by Eq. (10) with :
(15)
where keV bib:PDG
is the two-photon width of the meson, and
the latter equation is obtained in a narrow width approximation.
Taking into account an interference effect (for the most conservative case)
and using the relation
,
we obtain:
(16)
where is the cross section of the continuum
component whose amplitude interferes with the
- and -violating decay, and
is the phase angle and
gives the most conservative upper limit of .
To obtain the upper limit for at 90% confidence level (C.L.),
we have to consider two physically possible cases:
is negative or positive, depending on the presence
or absence of an interference effect between amplitudes of
opposite and .
As the reaction would take place via a P wave,
while only even orbital angular momentum waves
can contribute to the ordinary
process,
it is unlikely that these two processes would interfere.
In that case, and is non negative.
On the other hand, if interference is present,
the lowest boundary of
is nbMeV,
where nb is used, i.e.
the largest possible value of that gives the
most conservative limit.
We first obtain , the 90% C.L. upper limit
of from the following relation:
(17)
where is the from the fit with a fixed
and
is the lower physical boundary of .
In the presence (absence) of the interference effect,
the limit is determined
to be nbMeV.
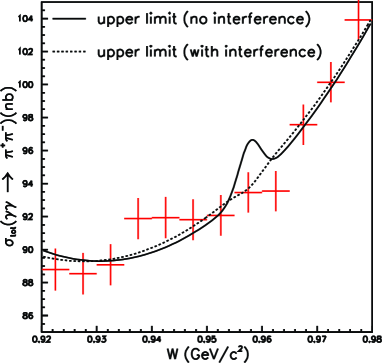
The results are shown in Fig. 10.
We obtain the upper limit of taking
the errors of and
() into account.
Namely, we calculate the contribution to the uncertainty in that
arises from these parameters and combine it with the statistical
error of , ,
reevaluate , and then translate it into a limit for
.
In the case of no interference, we obtain
.
In the other extreme case of maximum interference, we use
nb, and
the limit is at
90% C.L.
The errors in and
are also included but they lead to a negligible change in the upper limits.
Figure 10: Fit result of a Gaussian + second-order polynomial in the
region. The solid (dotted) line is the 90% C.L. upper limit
without (with) interference.
VIII Summary and Conclusion
In summary, we have performed a high statistics measurement of
the cross sections in the
invariant mass region for with the Belle detector
at the KEKB collider.
The total cross section is measured in fine bins of ()
and differential cross sections are given in bins of
and .
We have observed a significant peak corresponding to the
resonance.
Our data clearly select the peak solution of the Boglione-Pennington
amplitude analysis bib:amplitude .
The total cross section is fitted to obtain the parameters of the
meson bib:tmori and to check consistency in the
region.
For a - and -violating decay of the meson,
we set an upper limit without (with) interference between
opposite and amplitudes
at 90% C.L. thereby significantly improving the previous limit of
0.02 bib:PDG .
The angular dependence of the differential cross sections is consistent
with the presence of a significant S wave fraction
for and
with the dominance of the D wave in the mass region.
Acknowledgment
We are indebted to M. Pennington for various enlightening discussions
and useful suggestions.
We thank the KEKB group for the excellent operation of the
accelerator, the KEK cryogenics group for the efficient
operation of the solenoid, and the KEK computer group and
the National Institute of Informatics for valuable computing
and Super-SINET network support. We acknowledge support from
the Ministry of Education, Culture, Sports, Science, and
Technology of Japan and the Japan Society for the Promotion
of Science; the Australian Research Council and the
Australian Department of Education, Science and Training;
the National Science Foundation of China and the Knowledge
Innovation Program of the Chinese Academy of Sciences under
contract No. 10575109 and IHEP-U-503; the Department of
Science and Technology of India;
the BK21 program of the Ministry of Education of Korea,
the CHEP SRC program and Basic Research program
(grant No. R01-2005-000-10089-0) of the Korea Science and
Engineering Foundation, and the Pure Basic Research Group
program of the Korea Research Foundation;
the Polish State Committee for Scientific Research;
the Ministry of Education and Science of the Russian
Federation and the Russian Federal Agency for Atomic Energy;
the Slovenian Research Agency; the Swiss
National Science Foundation; the National Science Council
and the Ministry of Education of Taiwan; and the U.S. Department of Energy.
Appendix A Background subtraction
In this section, we describe in detail how the background from
is subtracted
in the cross section determinations described in Section VI and
Appendix B.
Note that beam-gas background that was important in past experiments is
completely negligible at -factories because of the very high luminosity.
The dominant physics background is due to production
and its subsequent decay into ; the photon
energy at the nominal mass is 0.14 GeV, and a significant fraction
of pairs satisfy selection requirements such as
.
The other physics backgrounds are negligibly small.
The background from can be estimated with
MC at the four-vector level without doing a full detector simulation.
This is because the subtractions are applied to cross sections where
efficiency corrections of the detector and trigger are already included and
because the bin-sizes used are large enough that
the effect of finite detector resolution is negligible.
The process with is simulated using TREPS bib:treps .
The final state is generated
with a matrix element incorporating the dipole transition
feature of the decay and the
pole bib:ritten ; bib:argus :
(18)
where is the pion momentum, is the photon energy
and is the angle between one of the pions and the photon, all
evaluated in the di-pion rest system, and the denominator is the
pole.
The mass dependence of the width is parameterized
as bib:jackson :
(19)
where is the at and is the
nominal width.
Generated pairs are subjected to the cut
and then accumulated into
bins of - with the same bin size as that of the
differential cross sections.
The obtained distribution is related to
the cross section of by using bib:lum_func :
(20)
The resulting background cross sections to be subtracted
are shown in Figs. 11(a) and (b).
(a)Background total cross section
(b)Background differential cross sections at representative
’s ( (nb))
Figure 11: Background total and differential cross sections
()
Appendix B Total cross section
In this appendix, we list the measured values of the total cross section
for the process integrated over
the angular region in the range of
in steps of .
At each energy, the third number in the table is the statistical
and the fourth is the overall systematic error.
stat
syst
stat
syst
stat
syst
stat
syst
nb
nb
nb
nb
nb
nb
nb
nb
nb
nb
nb
nb
0.8025
109.74
2.77
0.8075
105.40
1.80
0.8125
102.85
1.54
0.8175
102.25
1.52
0.8225
102.40
1.48
0.8275
99.89
1.44
0.8325
100.11
1.43
0.8375
96.69
1.41
0.8425
94.74
1.39
0.8475
97.08
1.38
0.8525
93.85
1.37
0.8575
90.78
1.36
0.8625
90.40
1.36
0.8675
89.21
1.35
0.8725
89.02
1.35
0.8775
88.96
1.34
0.8825
87.07
1.33
0.8875
86.25
1.32
0.8925
89.55
1.32
0.8975
89.37
1.31
0.9025
85.27
1.30
0.9075
89.03
1.30
0.9125
87.14
1.28
0.9175
90.73
1.28
0.9225
88.69
1.27
0.9275
88.47
1.26
0.9325
89.00
1.25
0.9375
91.84
1.25
0.9425
91.88
1.25
0.9475
91.74
1.24
0.9525
92.02
1.23
0.9575
93.41
1.22
0.9625
93.48
1.22
0.9675
97.46
1.22
0.9725
100.08
1.22
0.9775
103.87
1.21
0.9825
107.07
1.21
0.9875
110.24
1.21
0.9925
104.68
1.19
0.9975
99.79
1.18
1.0025
101.21
1.17
1.0075
102.91
1.17
1.0125
102.86
1.16
1.0175
105.85
1.16
1.0225
104.71
1.15
1.0275
107.10
1.15
1.0325
108.03
1.14
1.0375
109.75
1.14
1.0425
111.16
1.14
1.0475
112.96
1.14
1.0525
113.58
1.13
1.0575
117.81
1.13
1.0625
118.50
1.13
1.0675
118.14
1.12
1.0725
123.57
1.13
1.0775
125.80
1.12
1.0825
127.32
1.12
1.0875
132.64
1.12
1.0925
135.50
1.12
1.0975
137.82
1.12
1.1025
141.86
1.12
1.1075
147.31
1.12
1.1125
149.05
1.12
1.1175
154.11
1.13
1.1225
158.42
1.13
1.1275
162.55
1.13
1.1325
168.98
1.14
1.1375
174.29
1.14
1.1425
179.45
1.14
1.1475
185.23
1.15
1.1525
190.32
1.15
1.1575
196.50
1.15
1.1625
205.00
1.16
1.1675
211.52
1.17
1.1725
220.50
1.17
1.1775
226.11
1.18
1.1825
233.61
1.18
1.1875
243.91
1.19
1.1925
252.79
1.20
1.1975
256.88
1.20
1.2025
265.45
1.21
1.2075
273.94
1.22
1.2125
280.81
1.23
1.2175
286.54
1.23
1.2225
291.98
1.23
1.2275
297.12
1.24
1.2325
301.35
1.24
1.2375
306.15
1.24
1.2425
305.83
1.24
1.2475
308.21
1.24
1.2525
304.94
1.24
1.2575
302.09
1.23
1.2625
297.81
1.22
1.2675
290.47
1.22
1.2725
281.53
1.20
1.2775
271.20
1.18
1.2825
259.63
1.17
1.2875
250.20
1.15
1.2925
238.08
1.14
1.2975
224.97
1.12
1.3025
211.19
1.10
1.3075
198.86
1.09
1.3125
186.77
1.07
1.3175
175.27
1.06
1.3225
164.29
1.04
1.3275
152.31
1.03
1.3325
141.10
1.01
1.3375
132.89
1.00
1.3425
125.24
0.99
1.3475
117.89
0.98
1.3525
110.82
0.96
1.3575
103.72
0.95
1.3625
97.71
0.94
1.3675
91.35
0.93
1.3725
84.87
0.92
1.3775
81.18
0.92
1.3825
73.44
0.91
1.3875
70.56
0.90
1.3925
67.25
0.90
1.3975
65.05
0.90
1.4025
59.39
0.89
1.4075
56.28
0.88
1.4125
52.53
0.87
1.4175
51.69
0.87
1.4225
48.65
0.87
1.4275
45.78
0.86
1.4325
44.40
0.86
1.4375
41.55
0.85
1.4425
39.18
0.84
1.4475
38.13
0.84
1.4525
37.14
0.85
1.4575
35.84
0.84
1.4625
34.07
0.84
1.4675
33.83
0.84
1.4725
31.64
0.83
1.4775
29.58
0.83
1.4825
29.00
0.83
1.4875
27.52
0.83
1.4925
26.25
0.82
1.4975
25.07
0.83
References
(1) For a review, see, e.g. C. Amsler and
N.A. Trnqvist, Phys. Rep.
389, 61 (2004).
(2) W.-M. Yao et al. (PDG),
J. Phys. G 33, 1 (2006).
(4) H. Marsiske et al. (Crystal Ball Collaboration),
Phys. Rev. D 41, 3324 (1990).
(5) J. Boyer et al. (Mark II Collaboration),
Phys. Rev. D 42, 1350 (1990).
(6)T. Oest et al. (JADE Collaboration),
Z. Phys. C - Particles and Fields 47, 343 (1990).
(7) I. Adachi et al. (TOPAZ Collaboration),
Phys. Lett. B 234, 185 (1990).
(8)A.E. Blinov et al. (MD-1 Collaboration),
Z. Phys. C - Particles and Fields 53, 33 (1992).
(9)H. -J. Behrend et al. (CELLO Collaboration),
Z. Phys. C - Particles and Fields 56, 381 (1992).
(10) F. Yabuki et al. (VENUS Collaboration),
J. Phys. Soc. Jpn 64, 435 (1995).
(11) M. Boglione and M. R. Pennington, Eur. Phys. J.
C 9, 11 (1999); referred to as BP.
(12) S. Kurokawa and E. Kikutani,
Nucl. Instrum. and Meth. A 499, 1 (2003),
and other papers included in this volume.
(13) The total cross section for two-photon production of
is proportional to
in the point-like pion approximation for , where
is the center-of-mass beam energy of an collider
and () is the mass of the
pion (electron); see, e.g. S.J. Brodsky, T. Kinoshita and H. Terazawa,
Phys. Rev. Lett.25, 972 (1970).
The first paper to notice the existence of the two photon process appears to
be L.D. Landau and E.M. Lifshitz, Sov. Phys. Rev.
6, 244 (1934).
(14) T. Mori et al. (Belle Collaboration),
Phys. Rev. D 75, 051101(R) (2007). Note that the fitted curve
in Fig. 2(a) of this published paper had a slight shift due to an error in
plotting, which is corrected in Fig. 8(a) in the present paper.
(15) A. Abashian et al. (Belle Collaboration),
Nucl. Instrum. and Meth. A 479, 117 (2002).
(16) R. Brun et al., CERN DD/EE/84-1 (1987).
(17) S. Uehara, KEK Report 96-11 (1996).
(18) V.M. Budnev et al., Phys. Rep.
15, 181 (1975).
(19) see, e.g. H. Krasemann and J.A.M. Vermaseren, Nucl. Phys.
B 184, 269 (1981).
(20) Note that the normalization of the amplitude is changed
from that of Ref. bib:tmori in order to be consistent with those
for other resonances ( and ).
(21) S.M. Flatt, Phys. Lett. 63B,
224 (1976); N.N. Achasov and G.N. Shestakov, Phys. Rev.
D 72, 013006 (2005).
(22) A. Roussarie et al., (Mark II Collaboration)
Phys. Lett. B 105, 304 (1981).
(23) J.M. Blatt and V.F. Weiskopff,
Theoretical Nuclear Physics
(Wiley, New York, 1952), pp. 359-365 and 386-389.
(24) G. Grayer et al., Nucl. Phys. B 75,
189 (1974);
A. Garmash et al. (Belle Collaboration), Phys. Rev. D 71,
092003 (2005);
B. Aubert et al. (BaBar Collaboration), Phys. Rev. D 72,
052002 (2005).
(25) A. Rittenberg, Ph.D. Thesis, LBL, Univ. of California
(1969), ULRL-18863, Sec. VI.A, Table VIII.
(26) H. Albrecht et al. (ARGUS Collaboration),
Phys. Lett. B 199, 457 (1987).