NGC 4438 and its environment at radio wavelengths
Abstract
We present multi-frequency radio-continuum and Hi observations of NGC 4438, the highly-disturbed, active galaxy in the Virgo cluster, with the Very Large Array (VLA) and the Giant Metrewave Radio Telescope (GMRT). High-resolution observations of the central 1 kpc with the VLA at 4860 and 8460 MHz show the presence of an inverted-spectrum radio nucleus located between the highly asymmetric lobes of radio emission. This demonstrates that these lobes which are seen in radio continuum, H and x-ray wavelengths and are located at 230 and 730 pc from the nucleus arise due to an active galactic nucleus (AGN) rather than a compact nuclear starburst. The low-frequency radio continuum observations made with the GMRT detect the extended emission on the western side of the galaxy whose spectral index is flatter at higher frequencies and suggests that it is a mixture of thermal and non-thermal emission.
The Hi observations show an elongated structure which is displaced by 4.1kpc on the western side of NGC 4438 and has a size of 9.8 kpc and a mass of 1.8108M⊙. The velocity field suggests systematic rotation, consistent with earlier observations. These observations also detect Hi emission from the disk of the galaxy with a mass of 1.2108M⊙. We detect a faint Hi-tail towards the north of NGC 4438 close to a stellar tail seen earlier in deep optical observations. This Hi-tail has a total extent of 50 kpc and a mass of 1.4108 M⊙ if it is at the distance of NGC 4438. The velocity of the Hi tail is 10 km s-1 similar to that of Hi emission from IC 3355, but the possibility that the tail could be foreground Galactic emission cannot be ruled out. We discuss the different structures in the light of different models which have been suggested for this disturbed galaxy, namely ram pressure stripping, tidal and ISM-ISM interactions.
keywords:
galaxies: individual: NGC 4438 – galaxies: individual: IC 3355 – galaxies: nuclei – galaxies: interactions – galaxies: ISM – galaxies: kinematics and dynamics| RA (J2000)b | DEC (J2000)b | Typec | a bd | PAe | if | Vsysg | Dh | q-factori | H ij |
| (h m s) | (∘ ′ ′′) | (′ ′) | ∘ | ∘ | (km s-1) | (Mpc) | deficiency | ||
| 12 27 45.67 | +13 00 31.5 | SA(s)0/a pec | 8.5 3.2 | 29 | 80 | 713 | 17 | 1.83 | 1.0 |
Taken from the NASA Extragalactic Database (NED) unless stated otherwise. Position of the radio nucleus from our high-resolution, VLA A-array image at 8460 MHz. Morphological type. Optical major and minor axes. Position angle (PA) of major axis from Kenney et al. (1995). Inclination angle from Kenney et al. (1995). Heliocentric systemic velocity. Distance of NGC 4438 taken drom Vollmer et al. (2005). For this distance 1′′=82 pc. q-factor: logarithmic ratio of FIR to radio luminosity (Reddy & Yun 2004). H i deficiency parameter from Cayatte et al. (1994).
1 Introduction
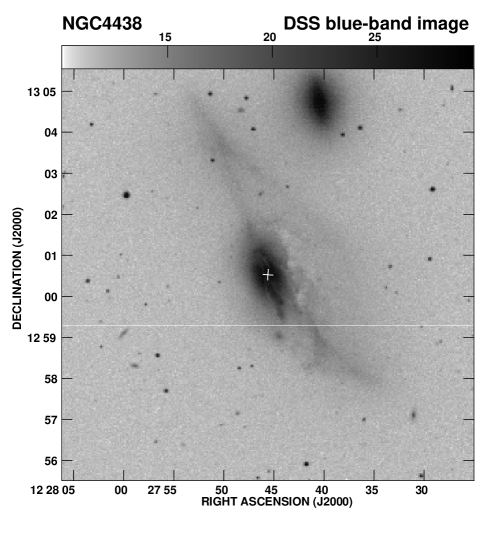
The galaxy, NGC 4438 (VV188, Arp 120), which is located only about 1∘ (300 kpc) from the centre of the Virgo cluster, is highly inclined (80∘) and has a very disturbed disk (Fig. 1) with various components of the interstellar medium (ISM) being visible on the western side of the disk. The basic properties of the galaxy are summarised in Table 1. High-resolution x-ray observations with the Chandra telescope show emission from a 700 pc nuclear region, a 2.3 kpc spherical bulge and a network of filaments extending 410 kpc to the west and south-west of the galaxy (Machacek, Jones & Forman 2004). These regions are well correlated with similar features seen in H (Kenney & Yale 2002; Chemin et al. 2005). Diffuse extended radio emission at 1.4 GHz has been seen extending up to 10 kpc on the western side of the galaxy. Some have suggested that these features on the western side might be due to interactions with the intracluster medium (ICM) of the Virgo cluster since the relative velocity of NGC 4438 is 1000 km s-1. A tidal encounter with the SB0 galaxy NGC 4435 at a projected distance of 4.3 arcmin (20 kpc) is also likely to have affected NGC 4438. Kenney et al. (1995) have suggested that most of the features of the disturbed ISM are likely due to a high-velocity ISM-ISM collision between NGC 4438 and 4435. Numerical simulations suggest that the centres of these two galaxies have passed within 510 kpc of each other 108 yr ago (Vollmer et al. 2005). Radio continuum observations of the nuclear region by Hummel & Saikia (1991) have shown two well-defined lobes of radio emission in this galaxy which is unusual, though not unique, for a spiral galaxy. These lobes are highly asymmetric with the north-western one being much brighter than the south-eastern one. x-ray and H+[Nii] emission are also seen from these two lobes which exhibit a bubble-like structure and similar asymmetry in location, brightness and size at these wavelengths (Kenney & Yale 2002; Machacek et al. 2004).
In this paper, we first present our results of radio continuum observations of the nuclear region and extended emission on the western side of the galaxy (Section 3). We then present the results of H i observations with the GMRT and the VLA D-array (Section 4). This is followed by a brief discussion and a summary of the results (Section 5).
2 Observations and Data analysis
For the continuum data, an observing log for both the GMRT and VLA observations as well as some of the observed parameters of the continuum images are presented in Table 2 which is arranged as follows. Column 1: name of the telescope where we also list the configuration for the VLA observations. In addition to our own data we have also analysed many sets of archival VLA data on this galaxy. Column 2: the frequency of the observations; columns 3 and 4: dates of the observations and the time, t, spent on the source in minutes; columns 5 and 6: the phase calibrator used and its flux density estimated from the observations; columns 7, 8 and 9: major and minor axes of the restoring beam in arcsec and its position angle (PA) in degrees; column 10: the rms noise in the continuum image in units of mJy/beam; columns 11 and 12: the peak brightness and total flux density in units of mJy/beam and mJy for the continuum images. The total error in the flux density is approximately 5% for frequencies higher than 1 GHz and 10% at 617 MHz.
| Telescope | Freq. | Obs. | t | Phase | Scal. | Beam size | rms | Spk | Stot. | ||
|---|---|---|---|---|---|---|---|---|---|---|---|
| MHz | date | min | Calib. | Jy | maj. | min. | PA | mJy | mJy | mJy | |
| ′′ | ′′ | ∘ | /b | /b | |||||||
| (1) | (2) | (3) | (4) | (5) | (6) | (7) | (8) | (9) | (10) | (11) | (12) |
| GMRT | 617 | 2002Jan11 | 300 | 1120+057 | 3.57 | 46 | 23 | 149 | 4 | 151 | 311 |
| VLA-A | 1490 | 1986May24 | 236 | 1252+119 | 0.98 | 1.50 | 1.50 | 0.04 | 19 | 87 | |
| VLA-B | 4860 | 1986Jul20 | 177 | 1252+119 | 0.62 | 1.50 | 1.50 | 0.03 | 7.3 | 33 | |
| VLA-A | 4860 | 1986May24 | 44 | 1252+119 | 0.62 | 0.41 | 0.36 | 114 | 0.04 | 0.5 | 12 |
| VLA-A | 8460 | 1998May13 | 23 | 1236+077 | 0.71 | 0.21 | 0.19 | 176 | 0.03 | 0.4 | 7.8 |
| VLA-AB | 14939 | 1991Dec05 | 13 | 1252+119 | 0.52 | 0.57 | 0.43 | 127 | 0.19 | 1.0 | 8.9 |


The radio continuum observations with the GMRT as well as with the VLA were made in the standard fashion with each source observation interspersed with observations of the phase calibrator. The primary flux density calibrator was 3C286 or 3C147 whose flux densities were estimated on the Baars et al. (1977) scale using the 1999.2 VLA values. The bandwidth of the continuum observations with the GMRT at 617 MHz was 16 MHz, while for the L-band observations it was 8 MHz. The bandwidth for all the VLA continuum observations was 50 MHz. The data analysis was done using the Astronomical Image Processing System (AIPS) of the National Radio Astronomy Observatory (NRAO). Since GMRT data are acquired in the spectral-line mode with 128 spectral channels, gain and bandpass solutions were applied to each channel before combining them. Self-calibration was applied to all the GMRT and VLA data sets. The low-resolution 617-MHz map was made with the 3-D cleaning option in CLEAN using 16 fields. The self calibrated gains were applied to this data set correcting only for phase and rejecting all the failed solutions. For all the VLA data sets two cycles of phase and one cycle of amplitude self calibration were applied except for the VLA A-array 8460-MHz data where only two cycles of phase self calibration were applied.
The information for the Hi observations are presented later in Section 4 (Table 5) where, in addition to the values described previously, we have also listed the spectral resolution in units of km s-1 (column 6), the rms noise in the channel maps in units of mJy/beam (column 10), the rms noise in the spectrum in units of mJy (column 11) and the Hi flux density in units of Jy km s-1 (column 12). The last row corresponds to the VLA-D array data to which a broadscale taper has been applied (see Sect. 4.2).
The analysis of the H i observations was also done in the standard way. 3C286 was the primary flux density and bandpass calibrator. The total bandwidth for the GMRT H i observations was 8 MHz and the spectral resolution was 62.5 kHz. The total bandwidth for the VLA D-array H i observations was 6 MHz and the spectral resolution was 97.7 kHz. Continuum subtraction was done by specifying line-free channels and using the AIPS task UVLIN. The GMRT data were cleaned using the self-calibrated gains from the continuum data analysis. For the VLA data analysis, the bright continuum source M87 was subtracted using UVSUB, before the multi-channel data was continuum subtracted and CLEANed using IMAGR.
3 Radio continuum emission
3.1 A mini double-lobed radio source
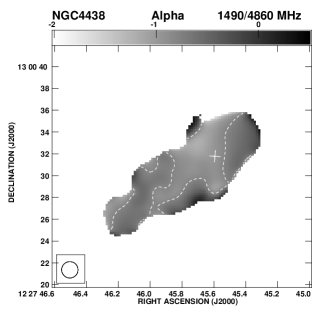
The VLA A-array image at 1490 MHz and the VLA B-array image at 4860 MHz with an angular resolution of 1.5 arcsec (Fig. 2: left and middle panels) show the well-known double-lobed structure of the radio source in the nuclear region (Hummel & Saikia 1991). The double-lobed source has a total extent of 12 arcsec (960 pc), with the western lobe being separated from the nucleus (the latter discussed in Section 3.2) by about 2.9 arcsec (230 pc) compared with 8.9 arcsec (730 pc) for the eastern lobe. The spectral index image made from these scaled-array VLA images by considering only those pixels which are 5 times above the rms noise is also shown in Fig. 2 (right panel). The spectral index, defined as S, varies from 1.5 to 0.5, while the error in the spectral index is . The mean value of spectral index for the western lobe, the central region and the eastern lobe are 0.78, 0.84 and 0.61 respectively, the spectral index being steepest between the lobes.
Given the steepness of , the emission is clearly dominated strongly by synchrotron emission. However, it is important to quantify what, if any, contribution a thermal component might make. The latter would flatten the spectral index from a steeper value, , to the flatter value, , that is observed. In particular, we ask what the thermal contribution would have to be in order to flatten the spectral index by an amount that is significantly outside of our error bar, , in the spectral index map. We use the measured flux densities of the two maps shown in Fig. 2, cut off to the same level as the spectral index map. These values are mJy and mJy, giving an observed total spectral index of . If the true non-thermal spectral index is , then (following Lee et al. 2001) we find that the thermal flux density required to alter the spectral index by this much is mJy. This corresponds to a required average electron density of cm-3 over a region whose equivalent spherical radius is 700 pc. While there may be small regions within the beam in which the density is higher than this (e.g. Kenney & Yale 2002), it is very unlikely that the electron density is this high, on average, over the observed region. Indeed, Machacek et al. (2004) find a mean density of cm-3 for the hot gas component over a roughly equivalent volume. We therefore conclude that the thermal contribution to these maps are negligible and continue with the minimum energy calculations under the assumption that .
3.1.1 The minimum energy parameters
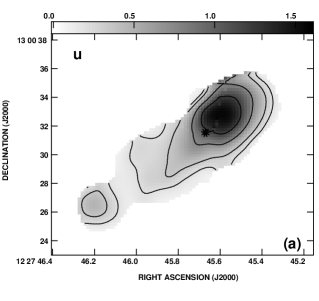
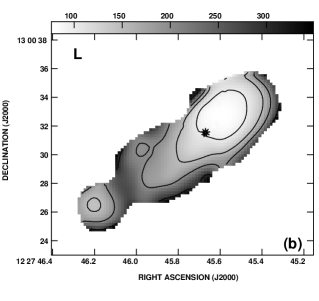
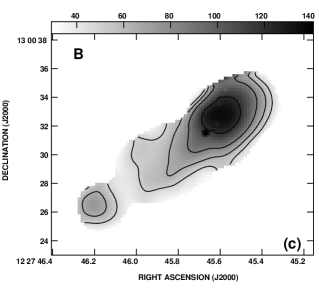
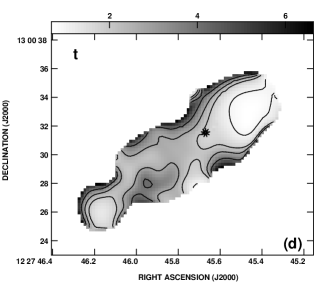
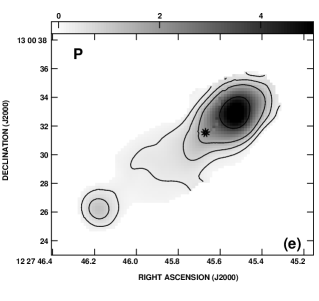
The VLA images, which have the same spatial resolution and similar signal-to-noise (S/N) ratios, along with the spectral index map (Fig. 2) can be used to compute the following minimum energy parameters (see Pacholczyk 1970; Duric 1991): the cosmic ray energy density uCR, the cosmic ray electron diffusion length LD, the magnetic field strength B, and the particle lifetime t. This calculation can be done on a pixel-by-pixel basis assuming a particular geometry, as previously described in Irwin & Saikia (2003).
In the case of the double-lobed source, we use a geometry in which the line-of-sight depth is taken to be the measured average width of the mini double-lobed source, i.e. pc with unity filling factor. The lower- and higher-frequency cut-offs of the spectrum are =107 and =1011 Hz, respectively, and we adopt two different values for the ratio of heavyparticle to electron energy, k=40, and k=100. The results are shown in Fig. 3 (a through d). In Fig. 3e, we also show a map of power, P=U/t, where U is the cosmic ray energy density uCR integrated along a line of sight and t is the particle lifetime. The result is identically P=(1+k)L, where L is the observed luminosity at a point. Thus the map of P closely resembles the map of total flux density but does not match it exactly because the computation of L requires an integration over frequency which is dependent on spectral index, and the spectral index is different at different points in the map. The map of P represents the rate at which cosmic rays must be accelerated in order to maintain equilibrium.
Averages over the maps shown in Fig. 3 are given in Table 3. We have found that changes in the choice of line of sight distance and upper frequency cutoff make relatively small changes in the results in comparison to the choice of k (e.g. Irwin & Saikia 2003). For the large range in adopted value of k, the results, overall, are within a factor of of each other. Note also, that this choice affects only the absolute scale of the maps and not the point-to-point variations. Beck & Krause (2005) have recently proposed adopting a system whereby the particle number ratio, rather than the energy ratio, is used in such calculations. For the mean spectral index of the mini double-lobed source () the magnetic field values using their formalism are within a factor of 2 of ours (using the classical approach). As indicated in the table, the total power in the cosmic ray component is a few times ergs s-1 and the total energy in cosmic rays is ergs.
| Modelb | c | d | e | f | g | h |
|---|---|---|---|---|---|---|
| (eV cm-3) | (pc) | (G) | (Myr) | ( ergs) | ( ergs s-1) | |
| k=40 | 463 | 178 | 68.6 | 2.46 | 8.75 | 1.72 |
| k=100 | 775 | 137 | 88.8 | 1.67 | 14.6 | 4.24 |
See Pacholczyk (1970), Duric (1991) or Irwin & Saikia (2003).
A line of sight distance of pc is adopted. k is the ratio of heavy particle to electron energy. Cosmic ray energy density, averaged over the source. The total cosmic ray plus magnetic field energy density is 7/4 times these values. Average diffusion length. Average magnetic field strength. Average particle lifetime. Total cosmic ray energy integrated over the source volume. Total power, = (1 + k) , where is the luminosity radiated by the electron component (see text).
The estimates of the magnetic field, which determine the radiative lifetime of the particles (see below), are 70 G for k=40. It is of interest to compare this value with other galaxies which have radio bubbles or lobes powered by an AGN. Two of the well-studied galaxies with such features are NC6764 which has a total linear extent of 2.6 kpc (Hota & Saikia 2006) and Circinus which has an extent of 8.1 kpc (Elmouttie et al. 1998). The equipartition fields in these two galaxies for k=40 are 25 and 45 G respectively. The value for NGC 4438 which is more compact is slightly higher.
Of particular interest is the lifetime map (Fig. 3d) since it helps to determine whether or not the particles need to be accelerated in situ. We use lobe locations identified by the well-defined peaks in the power map (Fig. 3e), giving locations for the western lobe of RA = 12h 27m 45.s52 Dec 13∘ 00′ 32.′′9, and for the eastern lobe of RA = 12h 27m 46.s18 Dec 13∘ 00′ 26.′′1. These positions correspond to projected separations from the nucleus of (214 pc) and (758 pc) for the western and eastern lobes respectively. At these positions, the particle lifetimes are, for k = 40, Myr (west) and Myr (east) (somewhat lower if k = 100). Ignoring a possible line-of-sight component to the velocity, the required particle velocity is only km s-1 and km s-1 for the west and east lobes, respectively, if the relativistic particles are supplied by the radio nucleus. These are lower limits, given the possible line-of-sight component to the velocity, but they are sufficiently lower than that in situ acceleration is not required, based on lifetime arguments. It is worth noting that the spectral index is typically flatter, the magnetic field stronger, and the particle lifetimes shorter at locations near the peaks of the two lobes in comparison to regions between the nucleus and lobes. This behaviour is typical of classical double-lobed sources where the peaks of emission are identified with regions where energy from the AGN is deposited.
3.1.2 The eastern and western lobes/shells
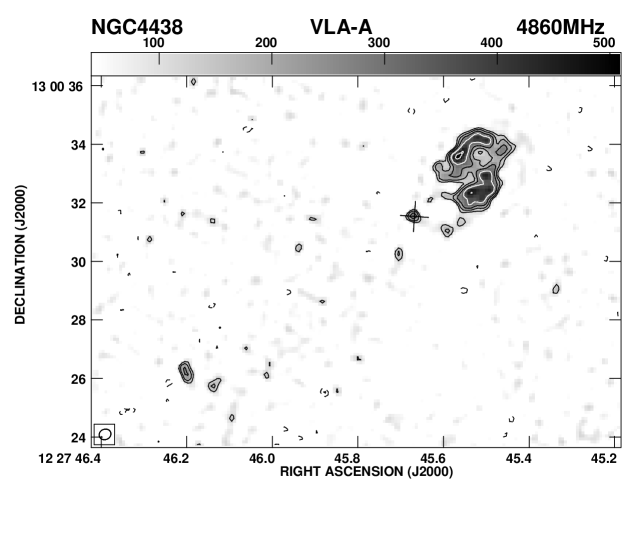
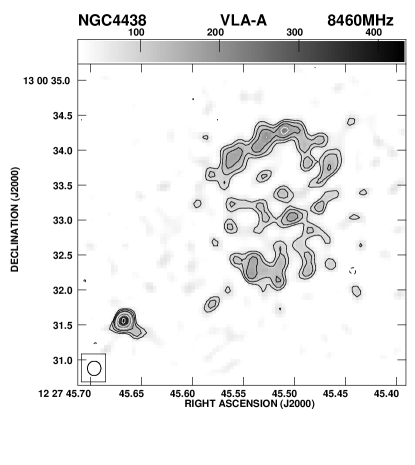
The higher resolution VLA A-array images at 4860 and 8460 MHz, with angular resolutions of 0.38 and 0.19 arcsec, respectively, are shown in Fig. 4. These reveal the prominent shell-like structure in the western lobe, noted earlier by Hummel & Saikia (1991), and also regions of emission from the eastern lobe.
The structure of the western lobe, which is seen more clearly here than in the image of Hummel & Saikia, shows two main ridges of emission on the northern and southern sides with the peak of emission being on the northern ridge rather than the edge of the bubble farthest from the nucleus (Section 3.2). The western shell is also seen clearly in H and x-ray wavelengths (Kenney & Yale 2002; Machacek et al. 2004). The eastern lobe is also known to exhibit a shell-like structure which is seen clearly at H and x-ray wavelengths (Kenney & Yale 2002; Machacek et al. 2004) although, in our high-resolution radio images, emission is seen only from the south-eastern and southern parts of the shell. The eastern shell, with a radius of 0.5 arcsec (40pc), is smaller than the western one whose radius is 1.0 arcsec (80pc).
Although there is a close correspondence between the shells seen at radio and H and x-ray wavelengths there are also significant differences. The eastern shell appears relatively more complete at H and at x-ray wavelengths whereas, as already noted, we have detected radio emission only from parts of the shell. Moreover, in the western lobe, both H and x-ray emission peak close to the nucleus which is rather weak at radio wavelengths.
3.2 The radio nucleus
VLA A-array images at 4860 and 8460 MHz (Fig. 4) show clearly a compact radio source. The position of this source is RA 12h 27m 45.s67, Dec +13∘ 00′ 31.′′54 at 4860 MHz, which agrees well with the position of RA 12h 27m 45.s66, Dec +13∘ 00′ 31.′′53 determined from the 8460-MHz image. These positions also agree with those of the optical and infrared nuclei (Clements 1983; Keel & Wehrle 1993; Falco et al. 1999). The J2000 position of the infrared peak, which is likely to be least affected by extinction, is RA 12h 27m 45.s67, Dec +13∘ 00′ 31.′′54 (Keel & Wehrle 1993) and this value is also consistent with the measurements at optical wavelengths.
The peak flux densities of the compact radio source estimated from our two images are 0.29 mJy/beam at 4860 MHz and 0.43 mJy/beam at 8460 MHz which yields an inverted radio spectrum with a spectral index of 0.69. The spectrum could be even more inverted if there is any contamination of the flux density at 4860 MHz by any extended emission. The highly inverted spectrum of this compact component suggests it to be the nucleus of NGC 4438 (see Section 5.1). It would be interesting to re-observe it for any possible signs of variability. The spectrum in this region appears steep in the low-resolution images (Fig. 2) because it is dominated by the extended bridge emission. The 8460-MHz image (Fig. 4, right panel) shows evidence of a jet-like extension from the nucleus along a PA of 233∘ which is almost orthogonal to the orientation of the mini-double. The nature of this feature is unclear; a more sensitive image to trace its extent would be useful.
3.3 The western extended radio emission
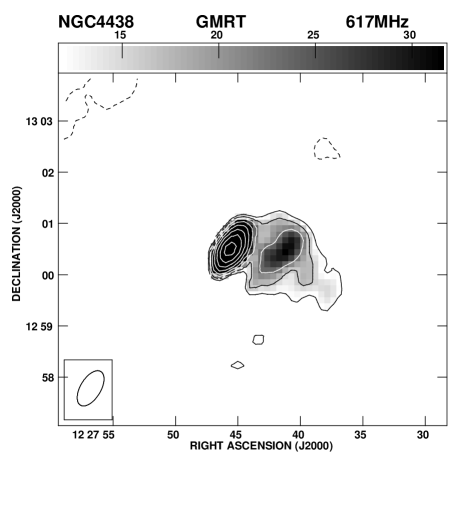
In Fig. 5, we show the extended 617 MHz continuum emission from NGC 4438, observed with the GMRT, over a field of view 400 times larger in area than that shown in Fig. 2. The brightest emission, seen as an unresolved component at the centre of the map, contains the nucleus and the mini-lobe discussed earlier (Fig. 2). The western extended radio emission was initially reported by Allen et al. (1973) and Kotanyi, van Gorkom & Ekers (1983). The peak of the extended emission is about 1 arcmin from the nuclear region and extends over 2 arcmin from the nucleus of NGC 4438, or at least 10 kpc towards the south-west.
The rms noise in Fig. 5 is 4 mJy/beam, which is higher than desirable, due to the presence of the strong radio source M87. This is also possibly responsible for the significant variations in the total flux density values of NGC 4438 which have been reported in the literature (see Table 4). Vollmer, Thierbach & Wielebinski (2004a) have tried to determine systematically the radio continuum spectra of galaxies in the Virgo cluster and quote a spectral index of 0.67 for the total emission from NGC 4438 using a number of measurements between 600 and 10550 MHz.
| Frequency | Stot. | Sdouble | Reference |
|---|---|---|---|
| MHz | mJy | mJy | |
| (1) | (2) | (3) | (4) |
| 610 | 32430 | VTW2004; G2003 | |
| 617 | 31130 | 151a | P |
| 1400 | 15010 | 86b | KE1983 |
| 1420 | 14915 | VTW2004; G2003 | |
| 1490 | 87 | P; HS1991 | |
| 4850 | 979 | NKW1995; VTW2004 | |
| 4850 | 7010 | BWE1991 | |
| 4860 | 33 | P; HS1991 | |
| 8600 | 494 | VTW2004 | |
| 10550 | 444 | NKW1995; VTW2004 |
a Estimated from the peak flux density in our GMRT image.
b Nuclear flux density from KE1983, which corresponds to the
inner double.
References. BWE1991: Becker et al. 1991; G2003: Gavazzi et al. 2003; HS1991: Hummel & Saikia 1991; KE1983: Kotanyi & Ekers 1983; NKW1995: Niklas et al. 1995; P: Present paper; VTW2004: Vollmer et al. 2004a.

Subtracting the flux densities of the nuclear double-lobed source for which we have reliable measurements of the total flux density (Table 4) from the measurements of total flux density we can estimate the spectral index of the western extended emission. Using the measurements of Vollmer et al. for the total flux density gives flux densities of 62 and 64 mJy for the western extended emission at 1400 and 5000 MHz respectively. This yields a flat spectral index of 0 for the extended emission, even flatter than the value of 0.5 reported by Kotanyi et al. (1983). Adopting the value of 70 mJy for the total flux density at 5000 MHz (Becker et al. 1991) gives us a flux density of 37 mJy and a spectral index of 0.4 for the extended emission. The western extended radio emission is visible in the 10550 MHz image of Niklas, Klein & Wielebinski (1995) possibly due to its flat spectrum. Estimating the flux density of the nuclear emission at 10550 MHz by extrapolating it from lower frequencies and subtracting it from the total flux density also yields a similar flat spectral index of 0.4 between 1400 and 10550 MHz.
At low-frequencies the total flux density at 610 MHz (Vollmer et al. 2004a) is consistent with our estimate of 31130 mJy at 617 MHz with an angular resolution of 46′′24′′ arcsec2 along a PA of 149∘. Identifying the peak flux density of 151 mJy in the GMRT image at 617 MHz with the nuclear double gives a flux density of 160 mJy for the extended emission. The peak flux density of 151 mJy is consistent with the extrapolated flux density of 179 mJy at 617 MHz for the nuclear double using our VLA measurements. This yields a spectral index of 1.1 for the extended emission between 600 and 1400 MHz significantly steeper than the high-frequency spectrum (see Fig. 6). This suggests that the low-frequency spectral index is dominated by non-thermal emission, while at high-frequencies contributions from thermal emission become important. This is a demonstration of both thermal and non-thermal radio-emitting material exisiting in the extra-planar gas. It is relevant to note that a flat spectral index of 0.5 for extended extra-planar radio emission may also be due to re-acceleration of particles (e.g. Bell 1978; Duric 1986) as has been suggested for the Virgo cluster galaxy NGC 4522 (Vollmer et al. 2004b). However, the difference in spectral index discussed above suggests that this is not the explanation for NGC 4438.

4 Hi emission
| Tel. | Obs. | t | Phase | Scal | Vel | Beam size | map | spec. | Hi | ||
| date | min | calib. | Jy | res. | maj. | min. | PA | rms | rms | flux | |
| km/s | ′′ | ′′ | ∘ | mJy/b | mJy | Jy km/s | |||||
| (1) | (2) | (3) | (4) | (5) | (6) | (7) | (8) | (9) | (10) | (11) | (12) |
| GMRT | 2002Apr14 | 300 | 1254+116 | 0.79 | 13.2 | 38 | 35 | 178 | 1.2 | 5.8 | 2.9 |
| VLA-D | 1988Jul02 | 330 | 1252+119 | 0.92 | 20.7 | 58 | 48 | 0 | 0.9 | 2.0 | 4.0 |
| 127 | 124 | 84 | 1.2 | 4.6 | 6.5 | ||||||
Hi observations of NGC 4438 have been reported earlier with an angular resolution of 23118 arcsec2 along PA=0∘ using the Westerbork telescope by Kotanyi (1981), and more recently with an angular resolution of 40 arcsec (3.3 kpc) using the VLA-D array by Cayatte et al. (1994) and again with the VLA D-array by Li & van Gorkom (2001). We observed this source with the GMRT with the goal of determining the structure of Hi in emission with higher resolution, and also to detect Hi in absorption towards the central compact source to identify any kinematic effects of the nuclear activity on the Hi gas. Our highest resolution (see Table 5) was slightly higher than obtained in previous observations. To supplement our GMRT observations, we have also analysed VLA D-array archival data to detect and study the disk emission, which has not been seen earlier, with high surface brightness sensitivity. We have also tapered the data to create another data set which emphasizes broadscale structure in order to detect and understand the properties of more extended Hi gas. The phase centre of this archival data set was the centre of NGC 4438, unlike the observations reported by Li & van Gorkom (2001). The VLA results presented here are of higher surface brightness sensitivity than those reported earlier and show several new features which we discuss in this paper.
4.1 GMRT results
We present here the global profile (Fig. 7) and the total-intensity Hi image from the GMRT observations (Fig. 8). These observations clearly show an elongated structure along a PA of 35∘ which is very similar to the PA of 29∘ for the central stellar disk measured from molecular line observations (Kenney et al. 1995). This elongated structure extends for 6.5 kpc along the major axis in our GMRT image. It is roughly parallel to the stellar disk and 4.1 kpc away from its mid plane. Earlier Hi images (e.g. Kotanyi et al. 1983; Cayette et al. 1994; Li & van Gorkom 2001) show the displacement of Hi gas on the western side of the stellar disk but these observations show the elongated structure more clearly. In addition to this elongated structure there are weak blobs of Hi emission towards the south.
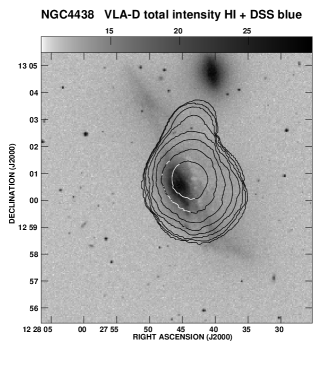
The Hi mass of the elongated feature is 1.5108M⊙, while the total H i mass estimated from the global profile (Fig. 7) obtained from the GMRT observation is 2108M⊙. The global profile exhibits a sharp drop in intensity at 40 km s-1 and a tail of emission on the red-shifted side. Although most of the H i gas appears red-shifted with respect to the systemic velocity of the galaxy (71 km s-1), the blobs towards the south appear blue shifted. The velocity gradient of the elongated structure shows that the north-eastern side is receding with a maximum heliocentric radial velocity of 107 km s-1 while the south-western side is approaching with a minimum radial velocity of 28 km s-1. These velocities are consistent with the Westerbork observations reported by Kotanyi (1981). The middle point of the radial velocity range of the elongated feature from our observations is 40 km s-1. The maximum line width in this elongated Hi emission structure is 40 km s-1. The observed sense of rotation of this feature is similar to that of CO emission seen in the stellar disk of the galaxy (Combes et al. 1988; Kenney et al. 1995; Vollmer et al. 2005), and lies close to the position of the extra-planar CO(1-0) emission along a PA20∘ (Vollmer et al. 2005). The extent of the extra-planar CO emission is very similar to that of the Hi feature seen here, although the peak of the CO emission lies slightly to the north-west while that of the Hi-elongated structure towards the centre of the feature. In this region the DSS blue band image shows the presence of dust plumes which appear very similar in nature to those seen in the Virgo cluster galaxy NGC 4402 (Crowl et al. 2005).
4.2 VLA results
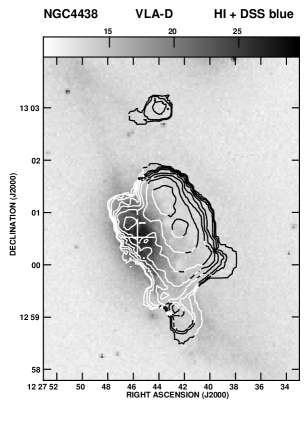
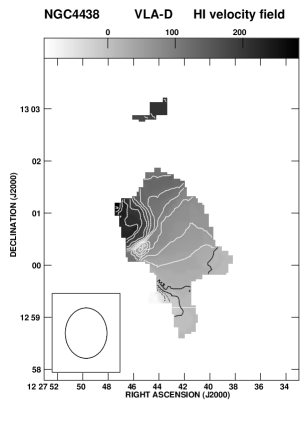
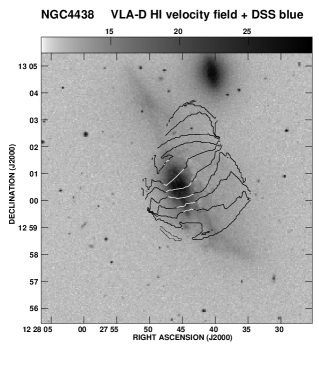
We first present the results of the VLA D-array full-resolution observations with an angular resolution of 5848 arcsec2 along a PA of 0∘. Moment maps were made with a cutoff at 4 and integrated in velocity from 133 to velocity 340 km s-1 (Fig. 9). With a higher surface brightness sensitivity than the GMRT observations, the total-intensity contours of Hi emission show that the elongated feature extends further south with a total size of 2′ (9.8 kpc) along a similar orientation to that of the elongated feature seen in the GMRT observations. There is also Hi emission from the optical disk of the galaxy with the emission having a sharper edge towards the north and extending further towards the south with a similar total extent 2′ (9.8 kpc). There is a clump of Hi emission at the southern end of the disk emission with velocities in the range of 20 to 20 km s-1. The moment 0 map also shows a clump of Hi emission towards the north between NGC 4438 and NGC 4435 with heliocentric velocities ranging from 176 to 217 km s-1.
The velocity field of NGC 4438 in this VLA D-array map is complex. In the central region of the disk within 10 arcsec of the nucleus the isovelocity contours are orthogonal to the central stellar disk with velocities ranging from 40 km s-1 on the southern side to 240 km s-1 on the northern side, yielding a gradient of 10 km s-1 arcsec-1. At larger distances from the nucleus the isovelocity contours along the disk of the galaxy range from 80 near the southern clump to 280 km s-1 on the northern edge giving a velocity gradient of 3 km s-1 arcsec-1. There is a hint of the isovelocity contours exhibiting a C-shaped curve or its reflection towards the north-east and south-west regions of the extra-planar gas, which requires confirmation from observations of higher spatial resolution. If confirmed, this would be reminescent of ‘backward question marks’ shaped isovelocity contours in NGC 4522 (Kenney, van Gorkom & Vollmer 2004) which is at a similar orientation and undergoing interaction with the ICM of the Virgo cluster. The extra-planar gas in NGC 4438 has a smoother velocity field than the disk ranging from 10 on the southern side to 130 km s-1 on the northern side giving a lower velocity gradient of 1 km s-1 arcsec-1 over a similar length scale. It is worth noting that the blue-shifted velocities of 28 km s-1 in the southern side of the elongated feature seen in the GMRT and Westerbork observations is not apparent in the D-array image, suggesting that observations with different resolutions pick up sub structures with different velocities.
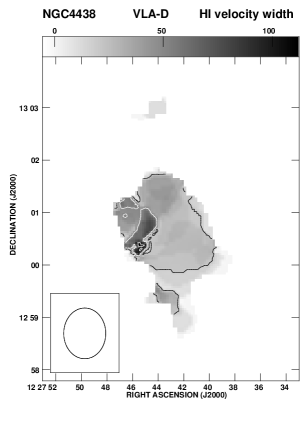
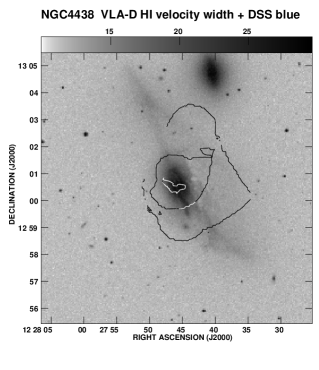
Approximately 15 arcsec south of the nucleus centred at RA 12h 27m 45.s4, Dec 13∘ 00′ 20′′, there is a small region of 1510 arcsec2 along a PA130∘ where the iso-velocity contours are closed and have values ranging from 40 to 80 km s-1. These contours represent gas which is approaching us relative to the gas in its vicinity. The moment 2 map shows that the velocity dispersion in this region is high with values in the range of 90115 km s-1. The moment 2 map also shows that towards the north of this region, the velocity dispersion is typically 5080 km s-1 over a total extent of 3.7 kpc approximately orthogonal to the PA of the disk. For the rest of the galaxy and the extra-planar emission the line widths are in the range of 2050 km s-1 with the line widths being larger on the northern side.
The VLA D-array data were also imaged with a 1k taper (resolution of 125 arcsec) which shows more Hi gas primarily on the western side. The global profile (Fig. 7) superimposed on the one from the GMRT higher resolution observations shows that there is indeed more Hi gas towards the red-shifted side. The VLA spectrum also shows a sharp cut off on the blueward side of the spectrum as seen in the GMRT global profile. The total Hi flux density is 6.5 Jy km s-1 which is consistent with that of Arecibo mesurements by Giovanardi, Krumm & Salpeter (1983) who quote a line flux density of 6.10.6 Jy km s-1. Our VLA mesurements correspond to a total Hi mass of 4.4108 M⊙ which is 2 times larger than that estimated from the GMRT spectrum.
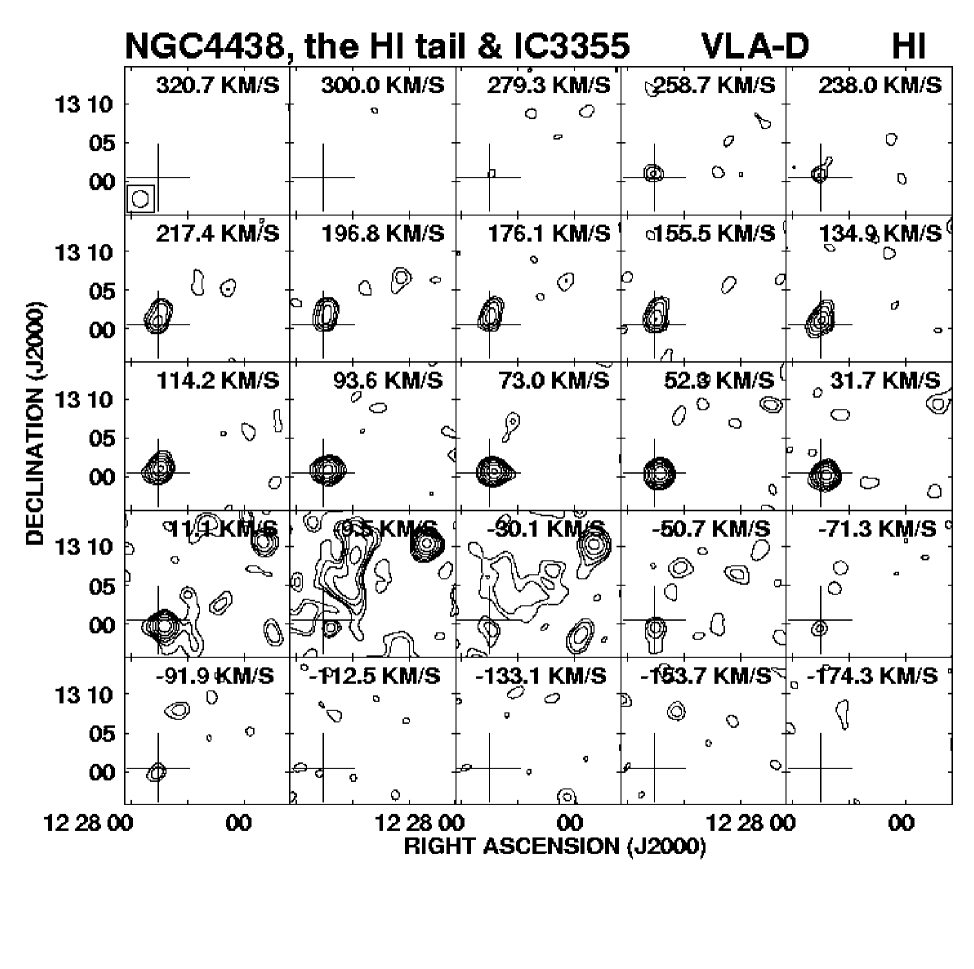
The channel maps obtained with a spatial resolution of 125 arcsec are shown in Fig 10. In addition to the Hi emission associated with NGC 4438 whose nucleus is marked with a cross in the figure, Hi emission is also seen at the position of the irregular galaxy, IC 3355 (see figure caption), and a large cloud of Hi, which we will refer to as the ‘tail’, is detected which is most prominent in the velocity channel at 9.5 km s-1. These features will be discussed more fully in the next two sections.
Moment maps of NGC 4438 were made of the tapered VLA data with a cutoff at 4 and integrated in velocity from 71 to 238 km s-1 (Fig. 11). The Hi total-intensity image with an angular resolution of 127124 arcsec2 looks resolved with an extension towards the north. The northern clump seen in the full-resolution D-array image is coincident with this extension. In the tapered image the disk emission, the extra-planar elongated structure and the southern and northern clumps appear blended with more diffuse Hi gas.
The velocity contours in the southern side of the disk are approximately parallel to each other along a PA of 80∘ while those on the northern side are oriented along a PA of 45∘. The velocity in the disk ranges from 20 to 140 km s-1 with a velocity gradient of 0.9 km s-1 arcsec-1. The extra-planar gas, including the northern extension, has velocities ranging from 20 to 190 km s-1 yielding an average velocity gradient of 0.5 km s-1 arcsec-1. At this resolution the Hi gas in the disk as well as the extended emission on the western side are rotating about a heliocentric velocity of 110 km s-1 about an axis which is at a PA of 48∘. There is some hint that the isovelocity contours of the extra-planar gas seen in this tapered image appear to curve inwards about this axis at larger distances from the disk, while in the full-resolution image they may diverge closer to the interface between the disk and the extra-planar gas, reminescent of the ‘backward question mark’ in the Virgo cluster galaxy, NGC 4522, which has been affected by ram-pressure stripping (Kenney, van Gorkom & Vollmer 2004). Some evidence of similar diverging iso-velocity contours can be seen in the galaxy NGC 2820, which is affected by ram pressure stripping due to the intra-group medium (Kantharia et al. 2005). It may be relevant to study the velocity structures in the wakes of ram-pressure stripped gas with features similar to a von-Karman vortex street (e.g. Fig. 8 of Roediger, Brüggen & Hoeft 2006) to understand the above-mentioned iso-velocity contours. The moment 2 map shows that the width of the Hi line changes from 20 km s-1 in the outer regions to 87 km s-1 near the centre of the galaxy.
It is also of interest to compare the Hi velocity field with those obtained at other wavelengths, although one must bear in mind that the Hi observations are of much coarser resolution than at other wavebands. The velocities of CO and H emission along PAs of 29∘ and 27∘ respectively, and H gas along a PA of 29∘, all passing through the nucleus of the galaxy, have been presented by Kenney et al. (1995) and Chemin et al. (2005) respectively. The optical observations having a seeing of 1.52 arcsec, the CO observations having an angular resolution of 6 arcsec while the Hi images have angular resolutions of 50 and 120 arcsec for the full-resolution and tapered images respectively. As noted by Kenney et al. the CO and H velocities are symmetric and in good agreement within a galactocentric radius of 10 arcsec. Beyond this distance, the velocities become asymmetric with the CO velocities on the north-eastern side increasing to 240 km s-1 at 20 arcsec from the nucleus while the H velocities increase to 275 km s-1 at 40 arcsec from the nucleus. On the south-western side the CO extends to 15 arcsec with a minimum blue-shifted velocity of 105 km s-1 but the H gas seen by Kenney et al. extends up to 130 arcsec with a nearly constant velocity of 20 km s-1. The velocities obtained by Chemin et al. (2005) are very similar to those of Kenney et al. on the north-eastern side, but goes to significantly higher blue-shifts of 150 km s-1 approximately 15 arcsec south-west of the nucleus. The Hi velocity field with a full-resolution of 53 arcsec (Fig. 9) exhibits a similar pattern with velocities ranging from 50 km s-1 on the south-western side to 260 km s-1 on the north-eastern side 70 arcsec from the nucleus.
4.2.1 IC 3355
IC 3355 (VV 511, DDO 124, VCC 0945) is an irregular galaxy (Fig. 12) located 82 kpc from NGC4438. This galaxy is listed in the atlas of interacting galaxies by Vorontsov-Vel’Yaminov (1977) who also note the presence in its optical tail of ‘3 diffuse companions in a blue haze’. The B-band image shows a number of compact star-forming regions towards the eastern side of the galaxy. Spectroscopic observations at both radio and optical wavelengths listed in NED, the HyperLeda (http://leda.univ-lyon1.fr; Paturel et al. 2003) and GOLDmine (http://goldmine.mib.infn.it; Gavazzi et al. 2003) data bases and available information in the literature show the presence of two systems, one with a heliocentric velocity of 10 km s-1 and the other at a heliocentric velocity of 162 km s-1 (de Vaucouleurs, de Vaucouleurs & Nieto 1979; Sulentic 1980; Haynes & Giovanelli 1986; Hoffman et al. 1987; Cayatte et al. 1990; Huchra, Geller & Corwin 1995; Gavazzi et al. 2004). At radio wavelengths Haynes & Giovanelli (1986) report the detection of a weak feature at 162 km s-1 and note that the ‘spectrum in severely blended with local Hi emission’. Our spectrum does not show any feature at 162 km s-1 (Fig. 12), and this velocity is perhaps incorrect. Hoffman et al. (1987) and Cayatte et al. (1990) have reported the detection of Hi emission at a heliocentric velocity of 9 and 12 km s-1 respectively.

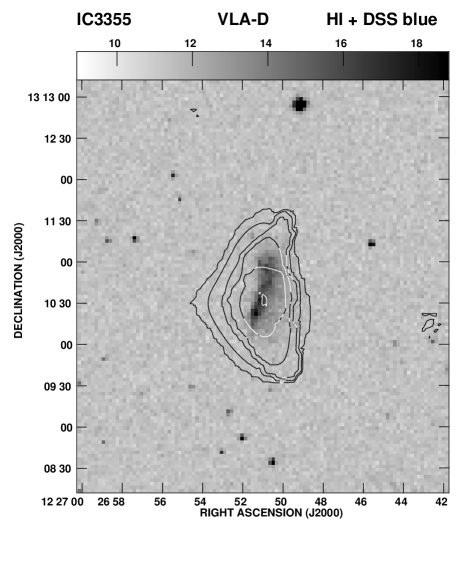
The channel maps (Fig. 10) from the VLA D-array data clearly show the detection of Hi emission at the position of this galaxy, as noted in Sect. 4.2. The HI emission is centered at a position of RA 12h 26m 51.s1, Dec +13∘ 10′ 33′′, which is coincident with the position of the optical galaxy: RA 12h 26m 51.s13, Dec +13∘ 10′ 32.′′6 (Yasuda, Ohamura & Fukugita 1995). In Fig. 10, Hi emission is detected in the channels with velocities of 11.1, 9.5 and 30.1 km s-1, but no emission is detected in the channels with velocities of 176.1 and 155.5 km s-1, which are closest to the velocity system at 162 km s-1.
At this resolution of 125 arcsec the primary beam corrected total Hi flux density is 5.47 Jy km s-1 estimated from the global profile (Fig. 12, upper panel) and corresponds to a total mass of 3.72108 M⊙ for IC 3355. Note that this is almost as high as the Hi mass of NGC 4438, itself (4.4108 M⊙, Sect. 4.2), further emphasizing that the latter galaxy has been heavily stripped of its gas. A full-resolution VLA D-array image of IC 3355 (Fig 12, lower panel) shows the emission to be elongated approximately in the north-south direction, similar to that of the galaxy and consistent with the structure reported by Cayatte et al.(1990) with an angular resolution of 2117 arcsec2 along a PA of 75∘ obtained by combining VLA C and Darray data. The western side of the Hi gas a sharp gradient but with the emission on the northern and southern extremeties bending marginally towards the west. The image presented by Li & van Gorkom (2001) detects extended emission on the western side which is not seen in either our image or that of Cayatte et al., possibly due to lower sensitivity. The detailed structure of the Hi gas is possibly due to a combination of ram pressure and tidal interactions since IC 3355 along with NGC 4438, are both likely to be part of the M86 sub-cluster, which appears to be merging with the M87 part of the cluster (see Kotanyi & Ekers 1983; Elmegreen et al. 2000; Schindler et al. 1999).
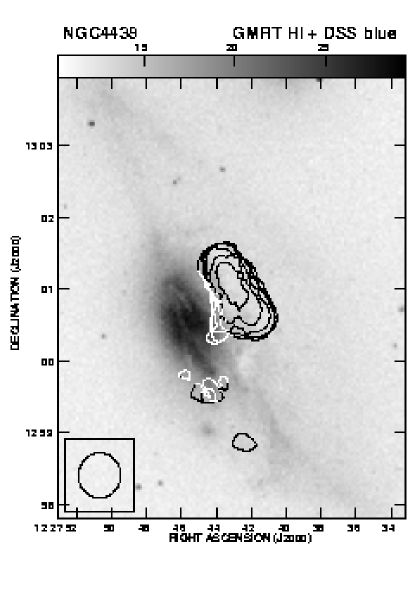
4.2.2 An Hi-tail
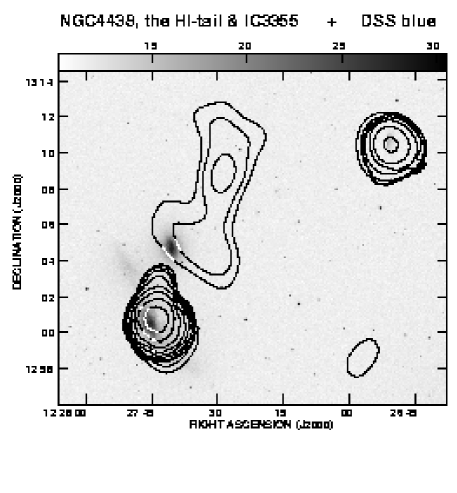
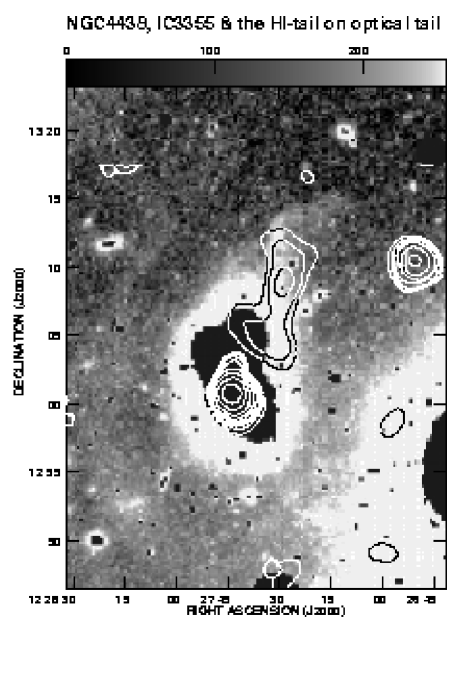
The channel maps at 9.5 and 30.1 km s-1 show extended diffuse emission which is seen most prominently at 9.5 km s-1 in Fig. 10. The global profile of the Hi tail is shown in Fig. 13 while the moment 0 image showing the Hi emission extending for 10 arcmin is presented in Fig. 14. It is of interest to note that the Hi emission from the galaxy IC 3355 is also strongest in the velocity channel of 9.5 km s-1 which is close to its optical velocity of km s-1, suggesting that the tail of Hi emission may be of extragalactic origin, although the possibility of it being Galactic foreground emission cannot be ruled out. If extragalactic, the tail is unlikely to be associated with the other companion galaxy, NGC 4435, which has a radial velocity of 801 km s-1. In fact, the latter galaxy, although close in projection to NGC 4438, is likely physically farther away from NGC 4438, given the large (V =730 km s-1) velocity difference between these two galaxies.
Deep optical images of the Virgo cluster (Phillips & Malin 1982; Katsiyannis et al. 1998) show a faint stellar tail extending towards the north of NGC 4438. Deeper observations trace the optical tail to a surface brightness of 28 mag arcsec-2 where it bends abruptly by 90∘ to the west (Mihos et al. 2005). The ‘knee’ structure of the optical tail is expected in close and slow encounters in a cluster (cf. Mihos et al. 2005) and is unlikely to be caused by the interaction between NGC 4438 and 4435, and could be significantly older than 100 Myr. The superposition of our Hi image on the deep optical image of Mihos et al. is shown in the bottom panel of Fig. 14. The Hi tail we have imaged is close in position and orientation to a significant part of the optical tail pointing northwards with the Hi extending till the bend in the optical tail. The northern tip of the tail is close to the edge of the half-power point of the primary beam; it would be useful to image the entire field to determine whether the Hi tail follows the optical one beyond the bend. This could also provide insights towards understanding whether the tail might be of extragalactic origin.
Extragalactic Hi tails could be debris of tidal interaction, ram pressure stripped gas or intergalactic Hi in the cluster medium (see Bekki, Koribalski & Kilborn 2005). The tail of Hi emission in NGC 4388 extends for 110125 kpc and has a dynamical time scale of 100 Myr (Oosterloo & van Gorkom 2005). The line flux of the NGC4438 Hi tail in the velocity channel of 9.5 km s-1 is 2 Jy km s-1 yielding a mass of 1.36108 M⊙ if it is at the distance of the Virgo cluser, which is about 30 per cent of the Hi mass of NGC 4438 or 36 per cent of the Hi mass of IC 3355. For comparison the mass of the Hi tail in NGC4388 is 3.4108 M⊙ (Oosterloo & van Gorkom 2005).

5 Discussion
5.1 The radio-continuum emission
Our detection of an inverted-spectrum nuclear component suggests that the small double-lobed radio source with a scale size of 1 kpc is due to an AGN rather than a starburst, consistent with earlier suggestions from x-ray observations (Machacek et al. 2004). Although optically thick thermal emission from compact sources with sizes of 510 pc and electron densities of a few thousand cm-3 can have an inverted spectrum at cm wavelenghts, as seen in the compact star clusters in He 2-10 (Kobulnicky & Johnson 1999), the star formation rate in the nucleus of NGC4438 is modest (0.050.1 M⊙ yr-1) and estimates of the electron density in the nuclear region are small, 10 cm-3 (e.g. Kenney et al. 1995; Machacek et al. 2004). From a compilation of the structures of nearby galaxies with a starburst and/or an AGN, Hota & Saikia (2006) have suggested that such bubble- or lobe-like radio structures are more likely to be seen in sources with an AGN rather than a starburst.
One of the most striking aspects of the structure on scales of 1 kpc is the radio lobes and that the western lobe is clearly seen as a shell-like structure. The shell-like structures are also seen in H and x-ray wavelengths on opposite sides of the nucleus and are closely related to the radio structure. The H and x-ray emission possibly arise in regions where the bubbles of synchrotron-emitting plasma interact with the surrounding ISM.
The radio lobes are very asymmetrically located with the ratio of separations of the eastern lobe from the nucleus to that of the western one being 3, while the corresponding flux density ratio is 0.60 and 0.57 at 1.4 and 5 GHz respectively. A higher density on the western side where the ISM of NGC 4438 appears displaced could provide a viable explanation of the asymmetry in location relative to the nucleus (cf. Kenney & Yale 2002). The lobe on the denser side is also expected to be more luminous due to a higher efficiency of conversion of beam energy into radio emission, and better confinement of the radio lobe (cf. Eilek & Shore 1989; Jeyakumar et al. 2005). However, this simple scenario does not explain why the western lobe, which is closer to the nucleus and brighter, is also larger in size by a factor of 2.
A possible solution to this inconsistency comes from the results of numerical simulations of propagation of jets. Hydrodynamic simulations of light, large-scale jets in a decreasing density profile show that the jet bow shock undergoes two phases, first a nearly spherical one and secondly the well-known cigar-shaped one (Krause 2002; Krause & Camenzind 2002; Carvalho & O’Dea 2002). The shell-like structure of the western lobe is suggestive of the first phase of the development of the bow-shock. In this scenario, the western jet has not yet entered the cigar phase, and deposits its radio-emitting plasma in a bigger part of the bubble, almost filling the region within the bounds of the bow shock. On the other hand, the eastern jet appears to be in the cigar phase and should therefore have a fairly regular backflow around it, which flows back into the central parts diffusing and mixing with the shocked external gas. A similar explanation has been suggested for the more distant radio galaxy with a starburst, 3C459, which exhibits a similar asymmetry in the location and structure of the lobes (Thomasson, Saikia & Muxlow 2003).
For a galaxy moving with a velocity of 1000 km s-1 through the Virgo cluster, ram pressure could also affect the observed structure of the source. Using plausible values from Combes et al. (1988) and Vollmer et al. (2005) the ram pressure is approximately few times 10-11 dynes cm-2. For comparison the pressure in the eastern and western lobes are 10-10 dynes cm-2, which corresponds to a cosmic ray energy density of 200 eV cm-3 (see Fig. 3a). This is significantly larger than the ram pressure, while the pressure in the interlobe region is comparable to that of ram pressure. The lobes of emission are unlikely to be significantly affected by ram pressure due to the motion of the galaxy.
The extended emission displaced to the western side of the disk of the galaxy has a spectral index of 1.1 between 600 and 1400 MHz significantly steeper than the high-frequency spectrum which is likely to be between 0 and 0.4. This suggests that the low-frequency spectral index is dominated by non-thermal emission, while at high-frequencies contributions from thermal emission become important. This extended emission is unlikely to be due to the AGN. It is also interesting to note that radio emission has not been detected from the disk of the galaxy; the extended emission possibly represents plasma which has been displaced from the disk along with other components of the ISM.
5.2 The Hi gas
The GMRT and VLA observations show the structure of Hi emission from both the disk and extra-planar gas associated with NGC 4438. Hi emission has also been detected from IC 3355 as well as a ‘tail’ of Hi gas extending for 10′ between NGC 4438 and IC 3355.
The extra-planar Hi gas in NGC 4438 has an approximately linear structure with a total size of 9.8 kpc and displaced from the disk by 4.1 kpc. The elongated Hi structure overlaps with the CO extra-planar emission but has a larger length than the CO feature which has been reproduced in simulations involving both tidal interactions and ram pressure stripping by the ICM of the Virgo cluster with ISM-ISM interactions between NGC 4438 and NGC 4435 playing a relatively minor role (Vollmer et al. 2005). There is a hint that the isovelocity contours in the extra-planar gas appear to initally diverge while at larger heights they curve inwards. These features, which require confirmation from higher spatial resolution observations with adequate surface-brightness sensitivity, are reminescent of the galaxy NGC 4522 also in the Virgo cluster, which has been interpreted to be due to ram-pressure stripping. The VLA D-array full-resolution image shows a region of closed velocity contours where the gas appears to deviate from the overall rotation and approaches us. A similar feature is also seen in the H observations at a similar location but with a much higher approaching velocity (Chemin et al. 2005). There is an x-ray source at this location and it is tempting to speculate that the outflowing gas may be related to energy released from the x-ray source. The high velocity dispersion of the Hi gas in this location would be consistent with such an interpretation.
The faint Hi-tail we detect towards the north of NGC 4438 is close to a stellar tail seen earlier in deep optical observations. The velocity of the Hi tail is 10 km s-1 similar to that of Hi emission from IC 3355. Although these aspects suggest that the tail may be in the Virgo cluster, the possibility that it may be a Galactic feature cannot be ruled out. If it is at a distance similar to that of NGC 4438, the Hi-tail has a total extent of 50 kpc and a mass of 1.4108 M⊙. It is relevant to note that in NGC 4388 which has an Hi tail which extends for 110 kpc (Oosterloo & van Gorkom 2005), there is no evidence of optical light along the length of the tail except for faint streamers close to the disk. Although such Hi tails could be debris of tidal interaction, ram pressure stripped gas or intergalactic Hi in the Virgo cluster medium (see Bekki, Koribalski & Kilborn 2005), the presence of optical emission light would suggest that it is likely to be due to tidal interactions. It would be interesting to make deep Hi observations of NGC 4438 to image this tail beyond the ‘knee’ of the optical tail and also find counterparts of the other faint optical tails and arc-like structures listed by Mihos et al. (2005).
6 Conclusions
We have made the most extensive radio continuum and Hi observations of the Virgo Cluster galaxy, NGC 4438, and its environment over a variety of spatial resolutions using the GMRT and the VLA. We have presented new data as well as archival data which have been imaged using improved data-reduction parameters, revealing new features related to this galaxy. The radio continuum data span spatial resolutions of 0.2 to 33 arcsec and the Hi data span spatial resolutions from 35 to 125 arcsec.
From our high-resolution, radio-continuum data, it is clear that the galaxy harbours an AGN whose position agrees with the optical and IR nucleus and which has an inverted radio spectrum. This confirms ealier speculations, based on x-ray data, that an AGN is present and is consistent with the presence of radio lobes in the galaxy which are more likely to be associated with an AGN rather than a starburst (Hota & Saikia 2006).
We have presented the clearest view of the mini-double-lobed radio source in NGC 4438 and presented the first maps of the minimum energy parameters in the radio lobes. Note that this is one of the few spiral galaxies known that contains a clear double-lobed radio source. The western lobe extends to 230 pc from the nucleus and the eastern lobe to 730 pc from the nucleus. The lobes break up into shells at higher resolution, visible in x-ray and H observations as well. In our radio data, the western shell is clearly delineated.
At lower resolution, a large radio continuum extension is visible, from the 617 MHz GMRT data, on the south-western side of the galaxy. This feature extends as far as 10 kpc from the nucleus of the galaxy. An analysis of the spectral index of this feature suggests that in addition to the largely non-thermal emission it may contain a contribution from thermal gas.
The Hi observations show emission from the disk of the galaxy for the first time as well as the detailed velocity structure of the disk and extraplanar gas. The extraplanar gas appears displaced to the west of NGC 4438 by 4.1 kpc and has a mass of M⊙ which is 1.5 times higher than the mass in the disk. The extraplanar gas appears to be in regular rotation and may be rotating more slowly than the gas in the disk. The extraplanar gas appears to be rotating about a velocity of 110 km s-1, which is redshifted compared with the systemic velocity of the galaxy. The velocity structure is possibly affected by ram pressure and is reminescent of the classic ram pressure stripped galaxy NGC4522 in the Virgo cluster.
Our observations also reveal a large tail of Hi extending north of NGC 4438. Its velocity is very similar to that of the irregular companion galaxy IC 3355. Also the Hi tail is close to that of a faint optical tail seen in deep images, suggesting that the tail may be in the Virgo cluster although the possibility that it might be Galactic emission cannot be ruled out. If it is located close to NGC 4438, its mass is M⊙, it has a total size of 50 kpc and extends for 75 kpc from NGC 4438. The possible association of starlight suggests that it may have formed tidally due to interactions with one of the galaxies in the M86 merging sub-cluster.
Acknowledgments
We thank our reviewer, Jeff Kenney, for his comments and criticisms which have
helped to improve both the scientific content and presentation of the paper.
AH thanks the Kanwal Rekhi Career Development Scholarship for partial financial support.
We thank the staffs of GMRT and VLA for making these observations and the VLA staff
for maintaining an excellent archive.
The GMRT is a national facility operated by the National Centre for Radio Astrophysics
of the Tata Institute of Fundamental Research. The VLA is a operated
by Associated Universities, Inc. under contract with the National Science
Foundation. This research has made use of the NASA/IPAC extragalactic database
(NED) which is operated by the Jet Propulsion Laboratory, Caltech, under
contract with the National Aeronautics and Space Administration.
We acknowledge the usage of the HyperLeda (http://leda.univ-lyon1.fr) and
GOLDmine (http://goldmine.mib.infn.it) data bases.
JAI wishes to acknowledge a grant from the Natural Sciences and Engineering Research
Council of Canada.
References
- [] Allen R.J., Ekers R.D., Burke B.F., Miley G.K., 1973, Nature, 241, 260
- [] Baars J.W.M., Genzel R., Pauliny-Toth I.I.K, Witzel A., 1977, A&A, 61, 99
- [] Beck R., Krause M., 2005, Astron. Nach., 326, 414
- [] Becker R.H., White R.L., Edwards A.L., 1991, ApJS, 75, 1
- [] Bekki K.; Koribalski B.S., Kilborn V.A., 2005, MNRAS, 363, L21
- [] Bell A.R., 1978, MNRAS, 182, 147
- [] Boselli A., et al., 2005, ApJ, 623, L13
- [] Carvalho J.C., O’Dea C.P., 2002, ApJS, 141, 371
- [] Cayatte V., van Gorkom J. H., Balkowski C., Kotanyi C., 1990, AJ, 100, 604
- [] Cayatte V., Kotanyi C., Balkowski C., van Gorkom J. H., 1994, AJ, 107, 1003
- [] Chemin L., et al., 2005, A&A, 436, 469
- [] Clements E.D., 1983, MNRAS, 204, 811
- [] Combes F., Dupraz C., Casoli F., Pagani L., 1988, A&A, 203, L9
- [] Crowl H.H., Kenney J.D.P., van Gorkom J.H., Vollmer B., 2005, AJ, 130, 65
- [] de Vaucouleurs G., de Vaucouleurs A., Nieto J.-L., 1979, AJ, 84, 1811
- [] Duric N., 1986, ApJ, 304, 111
- [] Duric N., 1991, in Duric N., Crane P., eds, ASP Conf. Ser Vol. 18, The Interpretation of Modern Synthesis Observations of Spiral Galaxies. ASP., San Francisco, p. 17
- [] Duric N., Irwin J., Bloemen H., 1998, A&A, 331, 428
- [] Eilek J.A., Shore S.N., 1989, ApJ, 342, 187
- [] Elmegreen D.M., Elmegreen B.G., Chromey F.R., Fine M.S., 2000, AJ, 120, 733
- [] Elmouttie M., Haynes R.F., Jones K.L., Sadler E.M., Ehle M., 1998, MNRAS, 297, 1202
- [] Falco E.E., et al., 1999, PASP, 111, 438
- [] Gavazzi G., Boselli A., Donati A., Franzetti P., Scodeggio M., 2003, A&A, 400, 451
- [] Gavazzi G., Zaccardo A., Sanvito G., Boselli A., Bonfanti C., 2004, A&A, 417, 499
- [] Giovanardi C., Krumm N., Salpeter E.E., 1983, AJ, 88, 1719
- [] Haynes M.P., Giovanelli R., 1986, ApJ, 306, 466
- [] Hoffman G.L., Helou G., Salpeter E.E., Glosson, J., Sandage A., 1987, ApJS, 63, 247
- [] Hota A., Saikia D.J., 2005, MNRAS, 356, 998
- [] Hota A., Saikia D.J., 2006, MNRAS, 371, 945
- [] Huchra J.P., Geller M.J., Corwin H.G. Jr., 1995, ApJS, 99, 391
- [] Hummel E., Saikia D.J., 1991, A&A, 249, 43
- [] Irwin J.A., 1991, in The Interpretation of Modern Synthesis Observations of Spiral Galaxies; ASP Conf. Proc., 18, 591
- [] Irwin J.A., Saikia D.J., 2003, MNRAS, 346, 977
- [] Jeyakumar S., Wiita P.J., Saikia D.J., Hooda J.S., 2005, A&A, 432, 823
- [] Kantharia N.G., Ananthakrishnan S., Nityananda R., Hota A., 2005, A&A, 435, 483
- [] Katsiyannis A.C., Kemp S.N., Berry D.S., Meaburn J., 1998, A&AS, 132, 387
- [] Keel W.C., Wehrle A.E., 1993, AJ, 106, 236
- [] Kenney J.D.P., Rubin V.C., Planesas P., Young J.S., 1995, ApJ, 438, 135
- [] Kenney J.D.P., Yale E.E., 2002, ApJ, 567, 865
- [] Kenney J.D.P., van Gorkom J.H., Vollmer B., 2004, AJ, 127, 3361
- [] Kobulnicky H.A., Johnson K.E., 1999, ApJ, 527, 154
- [] Kotanyi C., 1981, PhD Thesis, Rijksuniversiteit, Groningen
- [] Kotanyi C., van Gorkom J.H., Ekers R.D., 1983, ApJ, 273, L7
- [] Kotanyi C.G., Ekers R.D., 1983, A&A, 122, 267
- [] Krause M., 2002, A&A, 386, L1
- [] Krause M., Camenzind M., 2002, in Collin S., Combes F., Shlosman I., Active galactic nuclei: from central engine to host galaxy, ASP conference series, 290, 42
- [] Lee, S.-W., Irwin J.A., Dettmar R.-J., Cunningham C.T., Golla G., Wang Q.D., 2001, A&A, 377, 759
- [] Li Y., van Gorkom J.H., 2001, in Gas and Galaxy Evolution, eds J.E. Hibbard, M. Rupen and J.H. van Gorkom, ASP Conf. Proc., 240, 637
- [] Machacek M. E., Jones C., Forman W.R., 2004, ApJ, 610, 183
- [] Mihos J.C., Harding P., Feldmeier J., Morrison H., 2005, ApJ, 631, L41
- [] Niklas S., Klein U., Wielebinski R., 1995, A&A, 293, 56
- [] Oosterloo T., van Gorkom J., 2005, A&A, 437, L19
- [] Pacholczyk A.G., 1970, Radio Astrophysics, W.H. Freeman, San Francisco
- [] Paturel G., Theureau G., Bottinelli L., Gouguenheim L., Coudreau-Durand N., Hallet N., Petit C., 2003, A&A, 412, 57
- [] Phillips M.M., Malin D.F., 1982, MNRAS, 199, 905
- [] Reddy N.A., Yun M.S., 2004, ApJ, 600, 695
- [] Schindler S., Binggeli B., Böhringer H., 1999, A&A, 343, 420
- [] Roediger E., Brüggen M., Hoeft M., 2006, MNRAS, 371, 609
- [] Stone J.L. Jr., Wilson A.S., Ward M.J., 1988, ApJ, 330, 105
- [] Sulentic J.W., 1980, ApJ, 241, 67
- [] Thomasson P., Saikia D.J., Muxlow T.W.B., 2003, MNRAS, 341, 91
- [] Vollmer B., Thierbach M., Wielebinski R., 2004a, A&A, 418, 1
- [] Vollmer B., Beck R., Kenney J.D.P., van Gorkom J.H., 2004b, AJ, 127, 3375
- [] Vollmer B., Braine J., Combes F., Sofue Y., 2005, A&A, 441, 473
- [] Vollmer B., Soida M., Otmianowska-Mazur K., Kenney J.D.P., van Gorkom J.H., Beck R., 2006, A&A, 453, 883
- [] Vorontsov-Vel’Yaminov B.A., 1977, A&AS, 28, 1
- [] Yasuda N., Okamura S., Fukugita M., 1995, ApJS, 96, 359