1]INAF/IASF-Bologna, via Gobetti 101, 40129 Bologna, Italy (dicocco, bianchin @iasfbo.inaf.it) 2]Service d’Astrophysique – SAp-CEA, Saclay, France 3]INAF/IASF-Roma, Via Fosso del Cavaliere, 00100 Roma, Italy
IBIS/PICsIT Status
Abstract
We report about the status of the PICsIT layer of the imager IBIS. The instrument has been tested in both Spectral Imaging and Spectral Timing Mode. PICsIT Single Events, Multiple and ISGRI data of the Crab are simultaneously fitted to a power law model and fit parameters are compared with the standard values. We present a joint fit of SPI, ISGRI, PICsIT data of the long GRB041219, that was seen by the PICsIT instrument in both Spectral Imaging and Spectral Timing acquisition modes. This allowed us to generate a preliminary version of the instrumental response matrices for the PICsIT Spectral Timing mode.
keywords:
gamma-ray telescopes - imaging detectors - PICsIT1 PICsIT Outline
PICsIT (Pixellated Imaging CsI Telescope) is the high-energy detector (-) of the imager IBIS on board of the INTEGRAL satellite. The instrument provides fine imaging, good sensitivity and moderate energy resolution over a wide energy interval in the hard X/gamma-ray domain. PICsIT is composed by CsI(Tl) crystals organised in 16 semi-modules, with independent electronic units. The imager collects the shadowgram cast by the IBIS coded mask, covering a FOV= (zero response) sampled in (see [1] for more details).
Data are on-board equalised and pre-processed by means of the LUT (Look Up Tables) according to the event type and the detector operational mode. A valid PICsIT event is every signal that is not in coincidence with ISGRI events (Compton events), Calibration events or VETO strobes. PICsIT detects and stores separately two types of event: Single and Multiple Events. Single Events are made of detections in one single pixel, produced by energy deposits above the detector low threshold. The energy range for single events is . Multiple (Double) Events are generated by a photon energy deposit of across two or more pixels. Due to the electronic separation of semi-modules Multiple Events across semi-modules are treated as two separate Single Events (see [2]).
Data acquisition and preprocessing follow two operational modes: Photon-by-Photon Mode (PPM) and Standard Mode (SM). In PPM the instrument reveals the complete photon information: event position, time delay between consecutive events and energy in channels for both Singles and Multiples. Because of the satellite telemetry restrictions the acquisition in PPM is activated only for Calibration purposes and during Slews (). Moreover in PPM the energy of the transmitted data is limited to , again because of tight telemetry budget. During pointings, PICsIT is switched in its nominal operational mode, the SM, which is composed by two complementary Submodes: Spectral Imaging (SI) and Spectral Timing (ST). In SI the full spatial information on pixels is kept but events are on-board integrated over and stored in 256 energy channels. Conversely, ST mode allows a time binning from to , up to energy bins, but no spatial resolution. From Revolution (2006 May 24) the conversion table for ST (containing Singles and Multiples together) has been updated. Time binning is in energy bands: , , , , , , , .
More information on the status of the detector can be found at the IBIS/PICsIT web page in Bologna111http://www.iasfbo.inaf.it/index.php?option= com_content&task=view&id=42&Itemid=49
2 The Crab spectrum in Spectral Imaging Mode

We tested the spectral capabilities of the IBIS/PICsIT layer on a joint fit of PICsIT and ISGRI data of the Crab. Spectral extraction can follow two methods: the first one is to run up to level SPE the pipeline of the Offline Scientific Analysis (OSA)222http://isdc.unige.ch/?Soft+download, whose algorithms for IBIS are described in [3]. However, because of the generally low signal/background ratio of sources in PICsIT operational energy range, this procedure works well with the integration of shadowgrams before spectral extraction. This is possible only in staring mode acquisition, while during scientific pointings the satellite usually takes a set of acquisitions (Science Windows - ScWs) following a dither pattern. Improvements on this method are under development, but to date the most stable procedure is spectral extraction through the imaging pipeline. The scientific analysis software is run up to level IMA, when shadowgrams are deconvolved and images are obtained for each ScW. Subsequently the total mosaic of the whole data set is obtained by the varmosaic tool in HEASoft v.6.1.1. Counts and errors in each energy bin are then derived from the intensity and significance maps.
It is important to remind that the low Signal to Noise Ratio (SNR) requires long exposure time. For this reason our data set covers all the Crab observations available up to date, from February 2003 to May 2005 (Revolutions 39, 40, 41, 42, 45, 170, 239, 300, 365 and 422). Revolutions 102 and 103 have been neglected since the detector underwent high temperature fluctuations () that strongly affected imaging performances. Data have been downloaded from the ISDC data archive333http://isdc.unige.ch/index.cgi?Data+browse and we selected Observations in which PICsIT was in Standard operational Mode and where both Single and Multiple Events were collected. Data sample has been cleaned from ScWs where problems of different nature have been recognised: ScWs with exposure lower than , with missing calibration files, with badly downloaded histograms and so on.
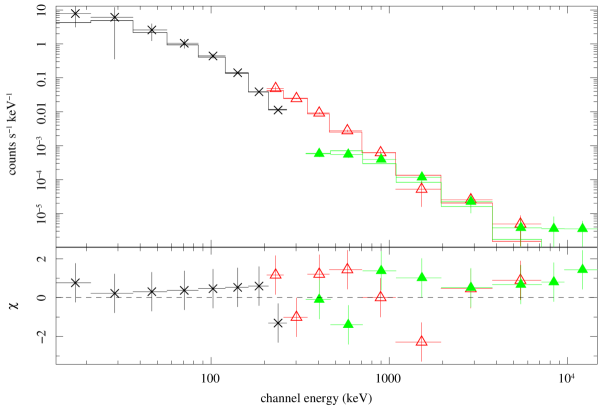
PICsIT data analysis was carried out by means of OSA 6, running the pipeline on the 8 standard energy bins for single and multiple events [4]. The total mosaic of data set has been produced, with an effective exposure of . The long total exposure enhances the SNR and allows a full energy range investigation of the source spectrum. We included in the spectral analysis also data with very low values of the SNR since the Crab is a known source and we are mainly interested in analysing fit problems. For Single and Multiple events we used the newly released spectral responses (RMF/ARF), included in OSA 6 (see Fig.1).
From the same data set we extracted the ISGRI spectrum running the OSA 5.1 pipeline up to level SPE. We used XSPEC v.11.3.2 to perform a joint fit of PICsIT Single, PICsIT Multiple and ISGRI data using a standard unabsorbed power law model (Fig.2). A systematic error of is added to ISGRI data and a systematic error is considered only in the first bin for PICsIT Single Events, which is strongly affected by cosmic rays induced events [5]. The best-fit model ( for dof, Prob.) is a power-law with photon index and normalisation at keV ph cm-2 s-1 keV-1. We obtain a good accordance with the “standard” values and ph cm-2 s-1 keV-1 by [6]. A more recent analysis by [7], based on the observation of several satellites in the keV energy range, gave similar results (, ph cm-2 s-1 keV-1). In the range the model flux is ph cm-2 s-1, which is still in accordance with the expected value ph cm-2 s-1 by [6], due to the large error affecting the normalization parameter. The intercalibration coefficients for PICsIT single events () and for multiples () are sensibly low as compared with ISGRI (fixed to as reference parameter). This problem requires a future deeper investigation on the response matrix for both PICsIT single and multiple events.
3 Calibration of Spectral Timing Mode
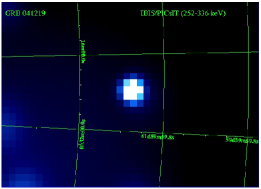
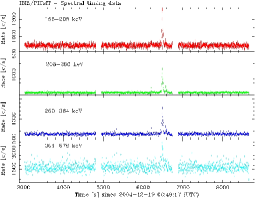
In Spectral Timing Mode, PICsIT single and multiple events are not individually treated. Therefore data acquired in this mode can be straightforwardly used to build lightcurves of the whole detector plane but spectral extraction needs a proper response matrix. To date, no RMF and ARF are available and a source dependent calibration of the Spectral Timing Mode could be attempted when there are simultaneous detections in both Spectral Timing and Spectral Imaging Mode. This occurred during the long GRB041219 ( s, see Fig. 3) and we used this observation to generate a preliminary version of the spectral response for ST mode data. We perform a simultaneous fit with ISGRI and SPI data in order to better determine model parameters and to check the new ST matrix. Note that when the GRB occurred the ST was set to time resolution and 4 energy bands (, , , ).
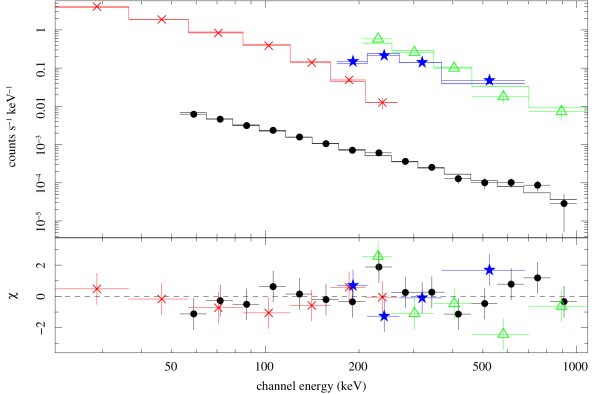
We extracted the spectrum of GRB041219 for ISGRI, SPI, PICsIT Single Events acquired in Spectral Imaging and PICsIT Spectral Timing. For ISGRI and SPI we run the standard OSA 5.1 pipeline up to level SPE, while for PICsIT SI we followed the procedure described above, deriving counts and errors from the image step. For PICsIT ST we extracted source plus background counts from the lightcurves of the ScW where the GRB occurred, while the background to be subtracted was extracted by using the ScWs before and after the event (see Fig. 3, right panel).
Using XSPEC we fitted data to an unabsorbed power law (Fig. 4). A first fit provides a rather poor . Most of the problems are due to different systematic effects (cosmic-rays induced events in the low energy bins of PICsIT, the saturation of ISGRI during the GRB, other effects in SPI, etc…) and, therefore, for this preliminary analysis, we decided to assign an overall value of for systematics.
The best-fit model ( for dof with Prob. ) has photon index and normalisation at keV ph cm-2 s-1 keV-1. In this case the reference for the intercalibration constant is SPI, since ISGRI is saturated by the high level counts of the source. This is also shown in the low value of the intercalibration constant, that is . The best-fit intercalibration for PICsIT single events in SI is and for PICsIT ST is .
We would like to underline that these are preliminary results and studies on the instrumental response of PICsIT in ST mode are currently on going.
4 Conclusions and Summary
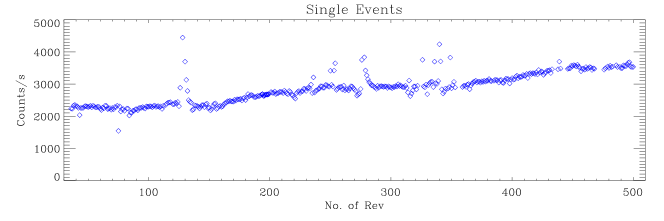
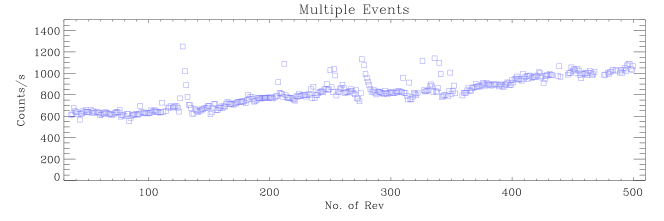
In this work we report the status of the IBIS/PICsIT instrument on board of the INTEGRAL satellite. After the launchof the satellite, a contiunuous monitoring of PICsIT was activated. Results obtained to date (e.g. Fig. 5) confirm the functional stability of instrument hardware. The number of dead pixels remained constant since the very beginning of the mission, for a total of 52 killed pixels. The average gain is in agreement with the value of keV/ch, obtained from in-flight calibrations ([8], [9]). The background level shows a low but continuous increase, likely to be due to solar activity (see Fig. 5).
PICsIT spectral capabilities have been verified using all the available observations of the Crab. The results of a joint fit of PICsIT and ISGRI data are in reasonably good agreement with the expected values. We focused on the possibility of full range analysis with long exposure data set and the need of future more detailed investigation of the instrument response. We present the first spectral analysis of PICsIT Spectral Timing data for long GRB041219, that was detected in both acquisition modes.
Up to date PICsIT has revealed four compact object: two pulsars (Crab and PSR B1509-58) and two galactic black holes (Cygnus X-1 and XTE J1550-564444A recent study of the 2003 outburst of this Galactic Black Hole, including PICsIT data, has been presented in [10].). Moreover, since the Spectral Timing mode is particularly effective in detecting powerful impulsive emissions, the list of GRBs is continuously updated and now contains 47 events. An updated PICsIT source catalogue can be found in the instrument web page555http://www.iasfbo.inaf.it/index.php?option= com_content&task=view&id=42&Itemid=49.
References
- [1] Di Cocco G., Caroli E., Celesti E., et al. 2003, A&A, 411, L189
- [2] Bird A. J., Barlow E. J, Bazzano A. et al., 2003, A&A, 411, L159
- [3] Goldwurm A., David P., Foschini L., et al., 2003, A&A, 411, L223
- [4] Foschini L., Malaguti G., Goldwurm A., et al., 2005, IBIS/PICsIT Instrument Specific Software Scientific Validation Report - Version 5.1, available at http://isdc.unige.ch/?Support +documents
- [5] Segreto A., Labanti C., Bazzano A., et al. 2003, A&A, 411, L215
- [6] Toor A., Seward F. D., 1974, AJ, 79, 995
- [7] Kirsch M.G.F., Briel U.G., Burrows D., et al., 2005, Proceedings of the SPIE, 5898, 22
- [8] Malaguti G., Bazzano A., Bird A. J. et al. 2003, A&A, 411, L173
- [9] Di Cocco G., Malaguti G., Foschini L., Vitale V., Schiavone F., 2005, Internal Report IASF/BO, n.437/2005
- [10] Bianchin V., Foschini L., Sambruna R.M., et al., 2006, Proceedings of the VI Microquasar Workshop, PoS(MQW6)072 available at http://pos.sis sa.it/cgi-bin/reader/conf.cgi?confid= 33#session-13