Extinction Corrected Star Formation Rates Empirically Derived from UltravioletOptical Colors
Abstract
Using a sample of galaxies from the Sloan Digital Sky Survey spectroscopic catalog with measured star-formation rates (SFRs) and ultraviolet (UV) photometry from the GALEX Medium Imaging Survey, we derived empirical linear correlations between the SFR to UV luminosity ratio and the UVoptical colors of blue sequence galaxies. The relations provide a simple prescription to correct UV data for dust attenuation that best reconciles the SFRs derived from UV and emission line data. The method breaks down for the red sequence population as well as for very blue galaxies such as the local “supercompact” UV luminous galaxies and the majority of high redshift Lyman Break Galaxies which form a low attenuation sequence of their own.
1 Introduction
Although directly tracing young massive stars, the ultraviolet (UV; Å) luminosity of a galaxy is not a straightforward measure of its current star-formation rate (SFR), nor is in fact any other observable related to new born stars. In particular, the galaxy’s dust content and past star-formation history (SFH) have a significant influence on the interpretation of the observed UV flux in terms of current star production. A large, sometimes dominant fraction of the UV emission may be obscured by dust and reprocessed at far infrared (FIR) wavelengths. The UV spectral slope is commonly used to estimate this fraction (Meurer et al., 1999) but it is strongly affected by the SFH (Kong et al., 2004). Also because UV emitting stars live long enough for successive generations to coexist, the SFH over the past few hundred Myrs must be known to translate the dust corrected UV flux into a more instantaneous SFR, such as derived from the galaxy’s H emission. In the case of a constant SFR and in the absence of dust, the UV luminosity to SFR ratio reaches a plateau after yrs (e.g. Kennicutt 1998), but a strong starburst will cause the UV luminosity to scale differently with the SFR. Interpreting the UV emission of early-type galaxies is also less straightforward due to contamination by older stars (Ree et al., 2007).
Dust obscuration and SFH may be estimated with the help of additional data (e.g. the Balmer decrement or far-infrared emission for the dust, the Balmer break for the SFH) and of theoretical assumptions. However such additional information is not always available or in fact acquirable, in particular at high redshifts where SFRs are generally derived from UV and/or infrared (IR) photometry with rather large uncertainties. New near-IR spectrographs on 8-10m telescopes are now making it possible to detect H emission and/or continuum breaks at (van Dokkum et al., 2005; Erb et al., 2006b; Kriek et al., 2006a, b) but the technique is still limited to prominent features. Detecting H at implies a SFR greater than a few M⊙ yr-1 (Erb et al., 2006b), which is not representative of the whole population (Kriek et al., 2006b). Optical images which pick up the rest-frame UV at remain the easiest data to obtain.
Here we use medium deep UV photometry from the Galaxy Evolution Explorer (GALEX) and the wealth of additional data provided by the Sloan Digital Sky Survey (SDSS) to derive simple empirical relations between the observed UV luminosity and the SFR of local star-forming galaxies. SFRs were derived for tens of thousands of SDSS galaxies using their emission lines and state-of-the-art models including a consistent treatment of the dust from the UV to the far-IR (Brinchmann et al., 2004). We assume these SFRs to be the best possible estimates at the present time, given the quality of the spectro-photometric data and the tested reliability of the models, and present an empirical method to recover them from the UV luminosity of galaxies using their UVoptical colors. We compare our relations with existing methods, in particular attenuation estimates based on the slope of the UV continuum which are commonly used, and investigate their limitations both locally and at high redshift.
The data are summarized in Section 2. In Section 3 we review the relation between the UV luminosity and the SFR of star-forming galaxies as well as several published methods for estimating their UV attenuation. In Section 4 we present simple empirical color relations that best reconcile the UV data with the SFR estimates based on emission line measurements, and discuss their limitations. Our conclusions are presented in Section 5. Throughout the paper we assumed a flat CDM cosmology with , and , and a Kroupa IMF (Kroupa, 2001).
2 Data and derived physical quantities
We select galaxies from the Sloan Digital Sky Survey (SDSS) spectroscopic catalog (Data Release 4; Adelman-McCarthy 2006) with NUV and FUV photometry from the GALEX Medium Imaging Survey (Internal Release 1.1; Martin et al. 2005, Morissey et al. 2005, 2007). The UV filters have effective wavelengths of 1528 and 2271 Å respectively. The Medium Imaging Survey (MIS) has a 5 detection limit of 22.7 (AB magnitude) in both filters for a typical exposure. This magnitude limit corresponds to a cut in magnitude error of in the NUV band and in the FUV band (Bianchi et al. 2007, their Fig. 2). Our primary sample consists of 23400 SDSS galaxies with , , measured H emission, aperture corrections less than 1.3 dex (defined as the ratio of the total SFR to the SFR estimated within the fiber; see below), and GALEX coverage in the NUV band. Adding FUV coverage reduces the sample to 17500 galaxies due to occasional failures of the GALEX FUV detector. Galaxies flagged as AGNs in the SDSS MPA/JHU DR4 value-added catalogs111http://www.mpa-garching.mpg.de/SDSS/ have been excluded.
The physical properties of SDSS galaxies were analyzed in detail by Kauffmann et al. (2003a, b); Tremonti et al. (2004) and Brinchmann et al. (2004) (hereafter B04) among others. In particular, the full likelihood distributions of their SFRs were derived by fitting all strong emission lines simultaneously using the Charlot & Longhetti (2001) models, following the methodology of Charlot et al. (2002) (B04). Dust is accounted for with the Charlot & Fall (2000) multicomponent model which provides a consistent treatment of the attenuation of both continuum and emission line photons. The dust attenuation is based on the H/H ratio to first order but is really constrained by all the lines. B04 also devised a method for estimating the SFR of early-type galaxies with no detectable H emission from their 4000Å break index but we excluded those from our sample. We use the medians of the SFR distributions and consider these values, noted (for emission lines following B04), to be the best currently available estimates of the SFR given the quality of the data and the technique used to derived them. Uncertainties are discussed in detail in the original paper.
Other quantities such as 4000Å break indices and stellar masses (Kauffmann et al., 2003a) are also available from the SDSS MPA/JHU DR4 value added catalogs1. The stellar mass is defined as the total mass of stars formed over the lifetime of the galaxy. The 4000Å break index – Dn(4000) – is defined as the ratio of the average flux density Fν in the narrow bands 38503950Å and 40004100Å following Balogh et al. (1998). It is a relatively dust insensitive measure of a galaxy’s SFH, equivalent to the ratio of the SFR averaged over the last years to the SFR averaged over years (Johnson et al., 2007). The Dn(4000) distribution is strongly bimodal around Dn(4000), dividing galaxies into the well known ‘red sequence’ of early-type, old star dominated galaxies (Dn(4000)) and the ‘blue cloud’ of late-type galaxies with recent star formation (Dn(4000)) (Kauffmann et al., 2003a; Strateva et al., 2001). In the following we refer to these 2 populations as simply red and blue galaxies.
Our final 2 samples consist of the 20800 galaxies in the primary sample (89%) that have been detected by GALEX in the NUV band (SDSS+NUV sample), and of the 14900 galaxies in the primary sample with additional FUV coverage (85%) that have been detected both in the NUV and FUV bands (SDSS+NUV+FUV sample). In the following we use the larger, SDSS+NUV only sample whenever FUV fluxes are not explicitly needed. These samples are strongly biased against red sequence galaxies but complete for blue galaxies: of Dn(4000) galaxies are detected in the NUV band (and in the FUV band when both are available) against of Dn(4000) galaxies ( in both UV bands when both are available). The average magnitude error is 0.03 in the NUV band and 0.07 in the FUV band for the blue population; 0.08 in the NUV band and 0.16 in the FUV band for the red population.
We derive absolute magnitudes in all the bands from the redshift and the Galactic extinction-corrected SDSS+GALEX photometry using the kcorrect v4_1 software of Blanton & Roweis (2007). In order to minimize the uncertainties on the -corrections, the magnitudes are -corrected to the mean redshift of the SDSS sample () and are noted where or for the GALEX FUV and NUV bands, , , and for the SDSS bands. The -correction at redshift is by definition in all bands for all galaxies and deviates from this value towards both ends of the redshift range (). In the UV bands, this deviation is less than 0.1 magnitude for 95% of the galaxies.
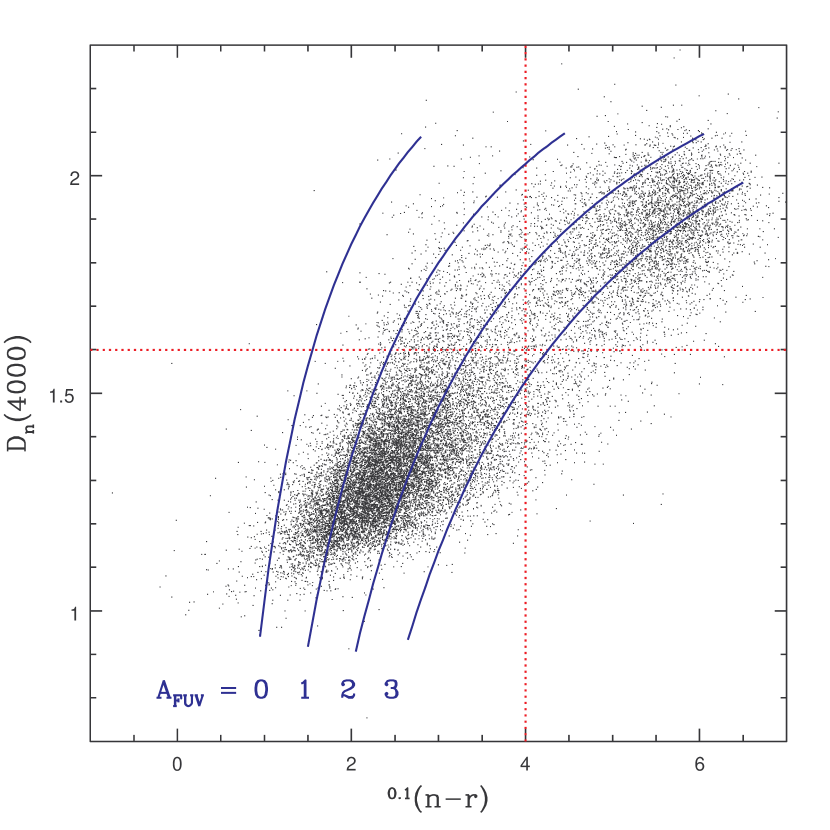
Figure 1 shows the distribution of the SDSS+NUV sample in the vs Dn(4000) plane. The color distribution is strongly bimodal (Wyder et al. 2007) with defining roughly the same boundaries as Dn(4000) between the red and blue populations. Galaxies with and Dn(4000) (the ‘blue cloud’) represent 70% of the sample (81% of the SDSS+NUV+FUV sample); galaxies with and Dn(4000) (the ‘red sequence’) represent 22% of the sample (10% of the SDSS+NUV+FUV sample). The solid lines are polynomial fits to the dust/color/SFH relation derived by Johnson et al. (2007) (see Section 3) for given values of the FUV attenuation as marked in the figure. The fits are good for galaxies with Dn(4000) but less reliable for red sequence galaxies (see Johnson et al. 2007 for details). The model illustrates how broad band colors depend on both the SFH and the amount of dust attenuation.
3 Deriving a Star Formation Rate from an Ultraviolet flux
3.1 Calibration
The SFR measured from the UV emission is usually written as:
| (1) |
where converges to for a constant SFR. Scaled to a Kroupa IMF, the most commonly used factor is log (Kennicutt, 1998). It assumes that the UV spectrum is nearly flat in over the wavelength range 1500-2800 Å. Using the Bruzual & Charlot (2003) stellar population synthesis models with similar assumptions (solar metallicity, a constant SFH and a Kroupa IMF), S. Salim (private communication) derived slightly higher factors for the GALEX filters: log and log. They are little sensitive to metallicity and to the SFH provided the SFR has been nearly constant in the last years. Very young starburst galaxies would significantly deviate from a constant SFR model and require a higher value of , while the UV emission of early-type galaxies is contaminated by older stars. For an optically selected sample with a mix of SFHs and metallicities similar to the SDSS/GALEX sample defined in the previous section (the average metallicity of which is ), Samir et al. (2007) suggest using their median conversion factor log. We assume this calibration for both UV bands in the following.
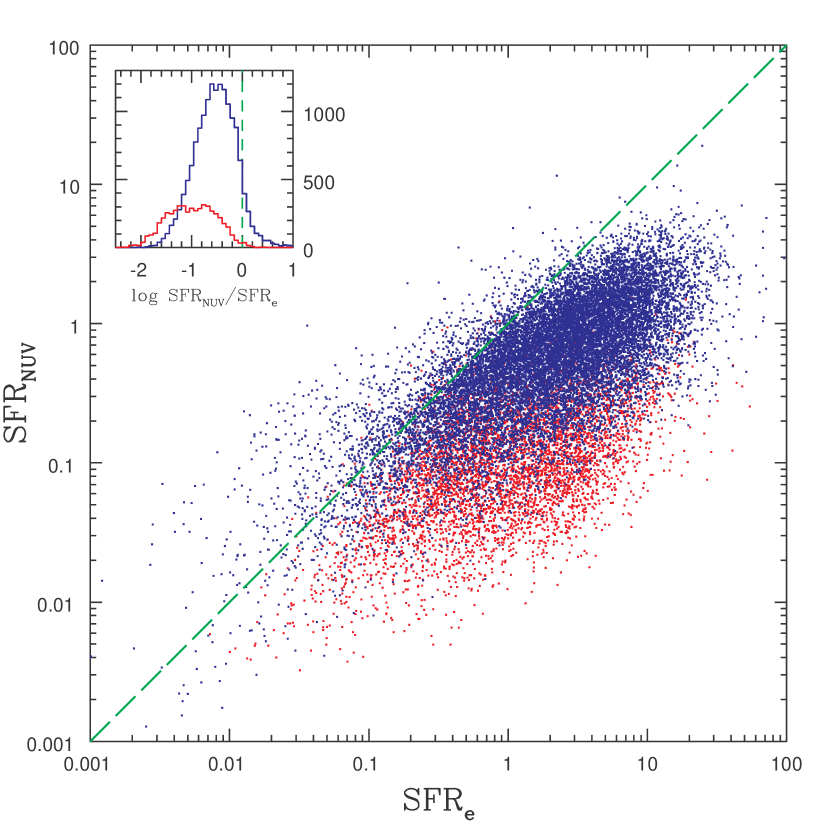
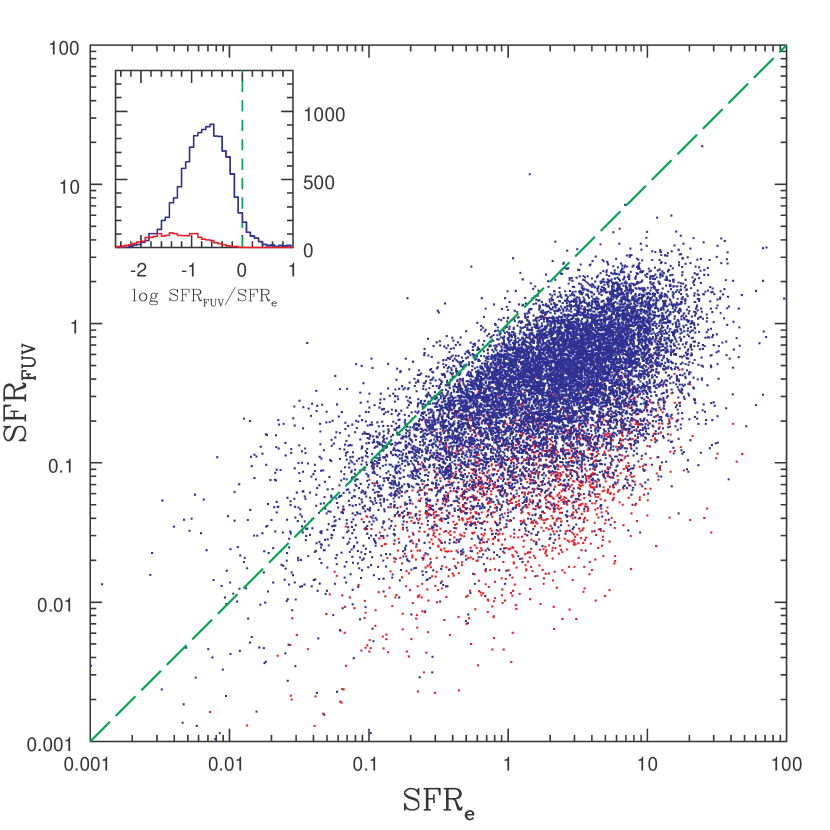
Figure 2 shows against for the NUV and FUV bands (left and right panel respectively), assuming no dust correction for the UV luminosities. The dashed green line denotes equality of SFR. Blue and red dots distinguish between blue and red galaxies defined as having and respectively. The histograms in inset show the distribution of the to ratios for the blue and red populations. As expected from uncorrected luminosities, underestimates the ‘true’ SFR, including for the red population although part of their UV luminosity is unrelated to the current SFR. The scatter is large in both bands, indicating a large range of UV attenuations for a given SFR or a given UV luminosity. There is also a clear trend with in the sense that galaxies with higher SFR tend to require a larger dust correction, as was first observed by Wang & Heckman (1996).
3.2 Dust attenuation estimates
The fraction of UV flux emitted by new born stars and absorbed by dust in the galaxy is reradiated at infrared (IR) wavelengths (Buat, 1992). Assuming a standard extinction law and that the dust is heated by intrinsically young stellar populations, the FUV attenuation can be approximated by:
| (2) |
where IRX is the ratio of the IR to UV luminosities (the so called infrared excess) and corrects for the fraction of IR luminosity heated by older stars and by light bluer than the FUV band (Meurer et al., 1999). Other relations were derived that yield very similar results (e.g. Buat et al. 2005). UV reddening as measured by the slope of the UV continuum () or a UV color, correlates with IRX in starburst galaxies, as expected from a foreground screen of dust (Witt et al., 1992; Calzetti et al., 1994). Thus or UV colors are often used to estimate . The IRX/ correlation was recently revisited and corrected by several authors for more ‘normal’ star-forming galaxies using GALEX data (Seibert et al. 2005, Cortese et al. 2006, Salim et al. 2007, Johnson et al. 2007). Seibert et al. (2005) (hereafter Se05) found that the starburst relation systematically overestimates the FUV attenuation of more quiet galaxy types by 0.58 mag, albeit with a large scatter. They derived the following empirical relation from a diverse sample of galaxies with UV photometry from GALEX and FIR photometry from the Infrared Astronomical Satellite (IRAS):
| (3) |
where and are the apparent magnitudes in the FUV and NUV bands respectively. The 0.1 magnitude offset corrects for a change in calibration between the GALEX photometry used by Se05 (the internal data release IR0.2) and that used in the present paper (IR1.1) (Seibert et al., in preparation).
Salim et al. (2007) (hereafter Sa07) derived a yet shallower relation between the attenuation and the UV color of normal blue galaxies using a different technique and the much larger GALEX/SDSS sample we are using here. They obtained the SFR and FUV attenuations, among other physical properties, by fitting the UV and optical photometry to an extensive library of model SEDs for which dust attenuation was computed from the same Charlot & Fall (2000) model used by B04. While B04 obtained their SFRs and attenuations from optical emission lines (the H line and the Balmer decrement to first approximation), Sa07’s are essentially constrained by the UV fluxes and the UV colors respectively. The agreement is generally good between the two approaches but discrepancies remain, in particular between the attenuations as we’ll discuss further below. Sa07 derived the following simple prescription from their extensive modeling for galaxies with and :
| (4) |
where the 0 subscript refers to rest-frame colors -corrected to . The small () fraction of galaxies with and are assigned a constant attenuation of 2.96.
Longer baseline colors such as UVoptical colors carry mixed but separable information about the SFH and IRX. Using a sample of galaxies with UV through IR photometry from GALEX, SDSS and Spitzer, Johnson et al. (2006, 2007) (hereafter J07) showed that given the SFH of a galaxy (they used Dn(4000)), IRX could be more accurately inferred from UVoptical colors than from UV colors. Assuming Eq. 2 with , they derived the following relation for galaxies with Dn(4000):
| (5) |
where and .
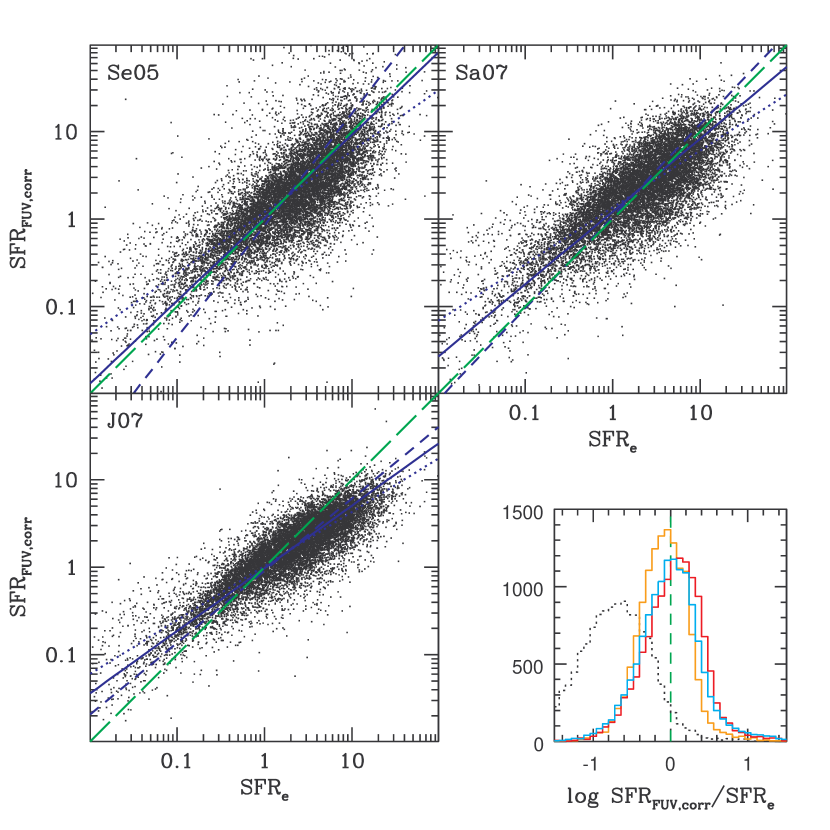
We note the SFR derived from the UV luminosity corrected for dust attenuation using one of the above equations. Figure 3 shows against for the blue galaxies () using Eq. 3 (Se05), 4 (Sa07) and 5 (J07) as indicated. In each panel the dotted, dashed and solid blue lines show the ordinary least-square (OLS) regression of the Y axis on the X axis, the OLS regression of the X axis on the Y axis and the bisector of those 2 lines respectively (Isobe et al., 1990). We choose the bisectors as the ‘best-fit’ lines, here and in the rest of the paper. The best-fit slopes, variances, correlation coefficients and residual scatters are listed in Table 1 for the 3 attenuation models (first 3 lines). The histograms show the distributions of the ratios compared to the distribution of the uncorrected to ratios. The averages of the distributions are also listed in Table 1. All 3 methods provide a very good average correction with a reduced scatter compared to the uncorrected , especially so for the J07 correction. However a residual trend with remains in the sense that galaxies with the highest and lowest SFR tend to be under and over-corrected respectively. This indicates that the models do not quite sufficiently scale with the SFR to straighten up the uncorrected correlation in Fig. 2. The trend is minimal for the Se05 correction for which the scatter is largest and most pronounced for the J07 correction for which the scatter is otherwise best reduced. This trend with is the same as that noted by Sa07 as a trend with mass (their Fig. 8) and by J07 as a trend with and Dn(4000) (their Fig. 12 and 13). Indeed mass and to a lesser extent colors and Dn(4000) correlate with . The reason for it remains unclear but Sa07 concluded that the most likely interpretation in the framework of their modeling was that attenuations were less well constrained by the UV data than by the emission lines at the two ends of the distribution. In the case of J07, the parametric relation between IRX, Dn(4000) and is a good fit to blue galaxies, more so than between IRX and UV color (see J07 for a detailed discussion). Therefore it is perhaps the relation between IRX and that is not totally adequate. We return to this point in the next section.
4 Reconciling UV and emission line Star Formation Rates
4.1 Empirical color corrections
Assuming as we do that is the current best dust-corrected SFR estimate and that our choice of is adequate, the UV attenuation (FUV or NUV) can be directly measured as:
| (6) |
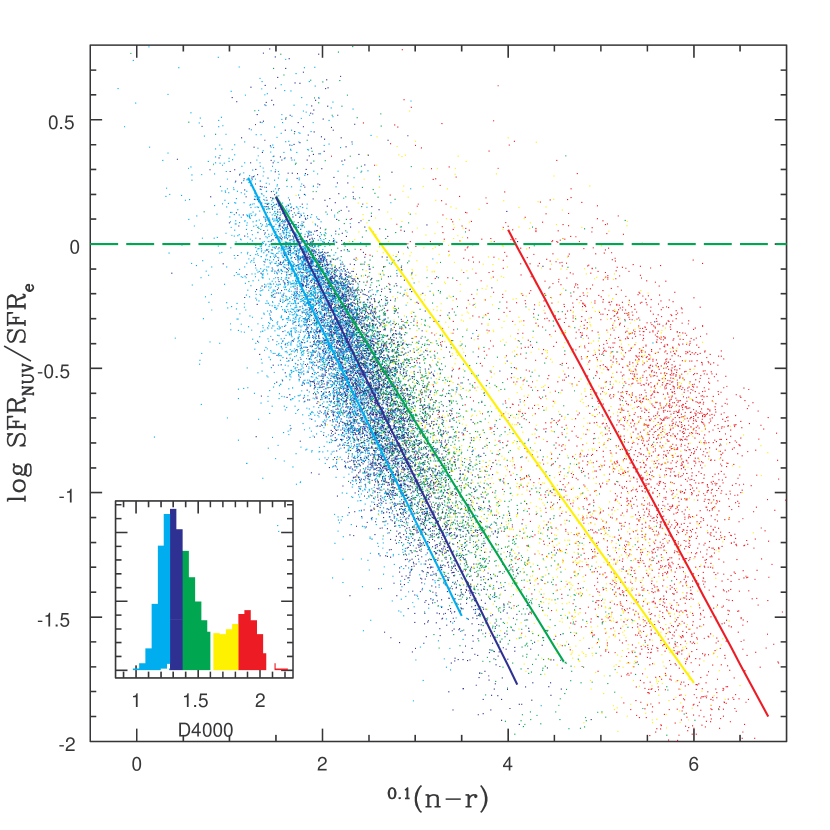
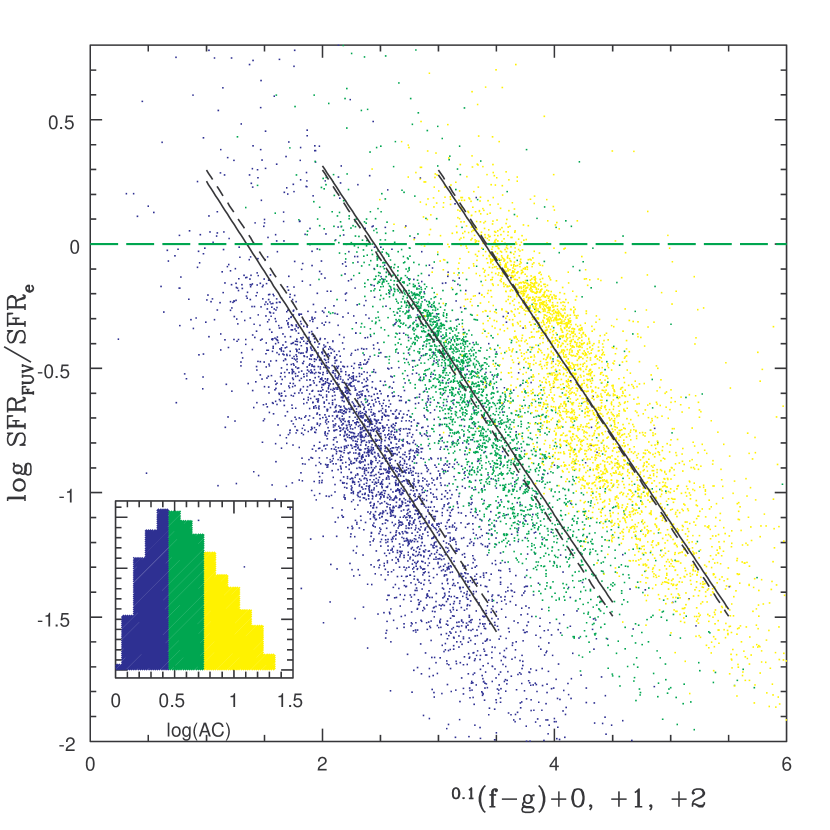
We now revisit the color dependence of these known attenuations. Figure 4, left panel, shows the to ratios as a function of for the SDSS+NUV sample. The solid lines show the OLS bisector for each Dn(4000) bin as shown in inset. The 3 bins making up the blue sequence (Dn(4000)) add up to form a single tight correlation while the 2 bins with Dn(4000) form a scattered cloud. For galaxies with Dn(4000) and , the bisector fit is:
| (7) |
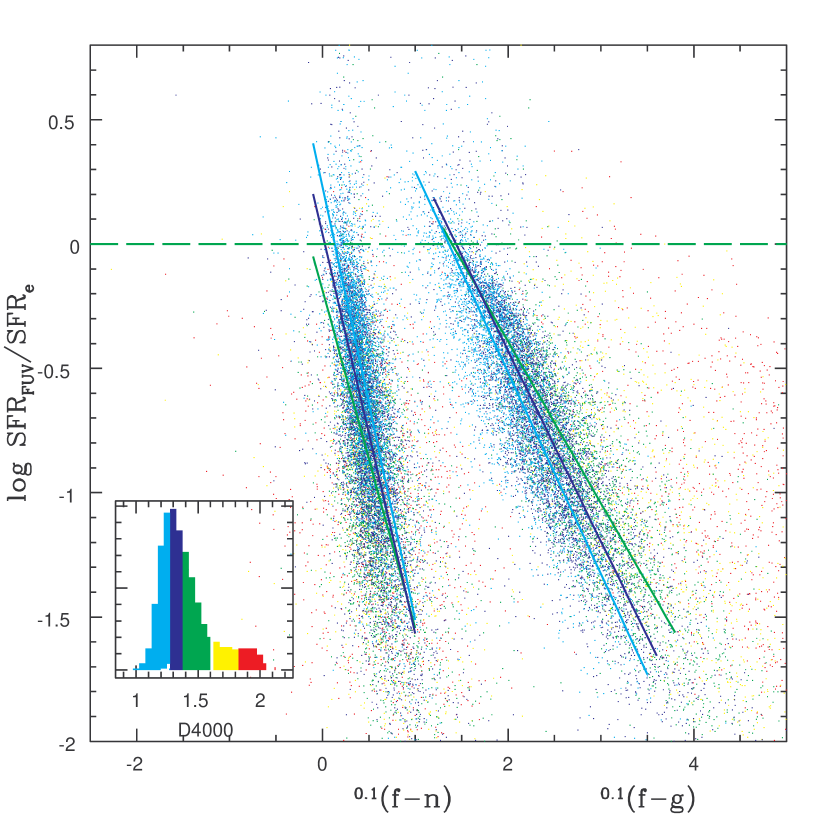
with a linear correlation coefficient and . The SDSS+NUV sample allows us to see the impact of the SFH on the attenuation/color relation. It is bimodal to first order: attenuation is linearly dependent on color for blue sequence galaxies and practically independent of it for red sequence galaxies. Similar correlations are found when using FUV luminosities and/or other UVoptical colors. Using the FUV luminosity and yields:
| (8) |
The correlation is tighter than Eq. 7 (, ). On the other hand results in a poorer and more scattered correlation (, ):
| (9) |
The last two correlations are shown in the right panel of Fig. 4. The latter correlation is similar to that proposed by Cortese et al. (2006) (their Fig. 10) using log as a function of for a small sample of star-forming galaxies in the COMA cluster. It is consistent with Eq. 3 (Se05) but a much steeper function of UV color than Eq. 4 (Sa07). However all 3 equations as well as Eq. 8 converge for the majority of galaxies around the peak of the color distribution () and yield similar average values in good agreement with the measured average attenuation (). Equation 5 (J07) yields a slightly lower average attenuation of 1.6. Discrepancies between these corrections are largest for the reddest and bluest galaxies.
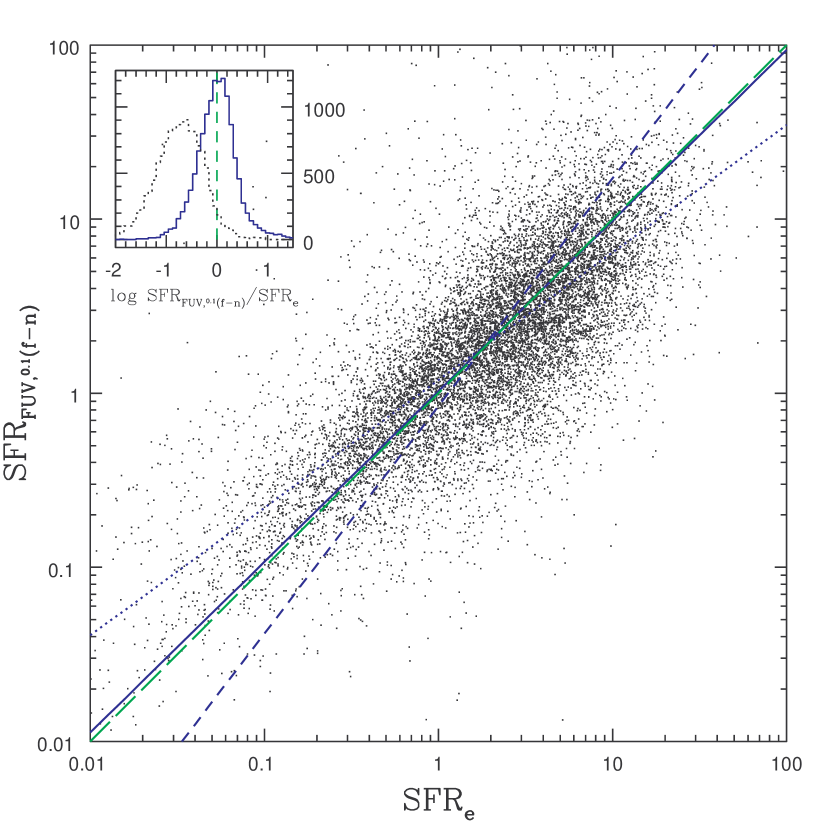
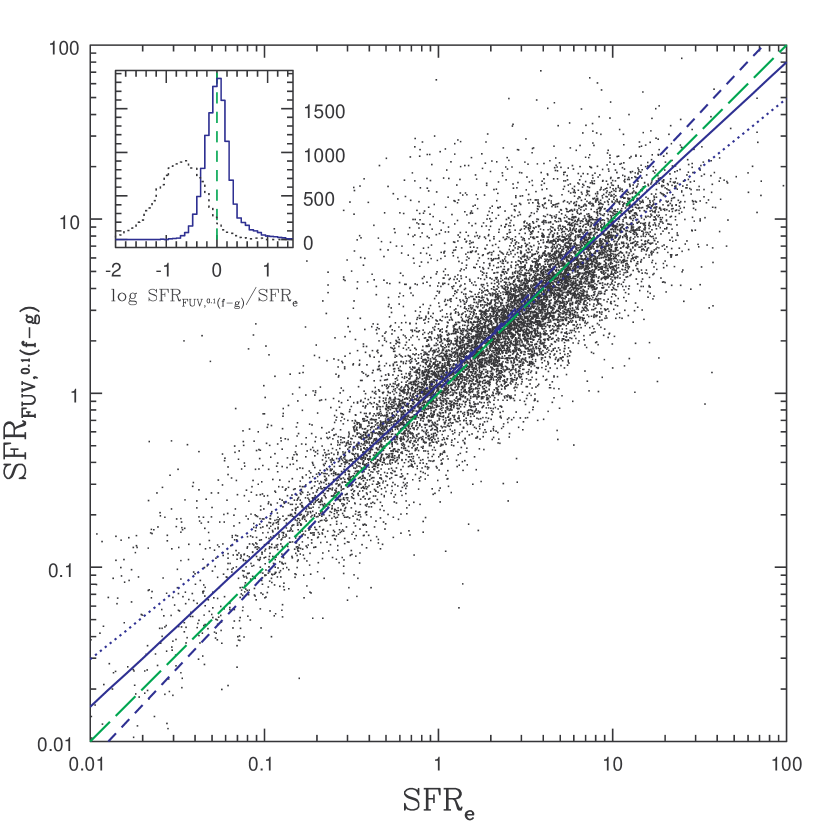
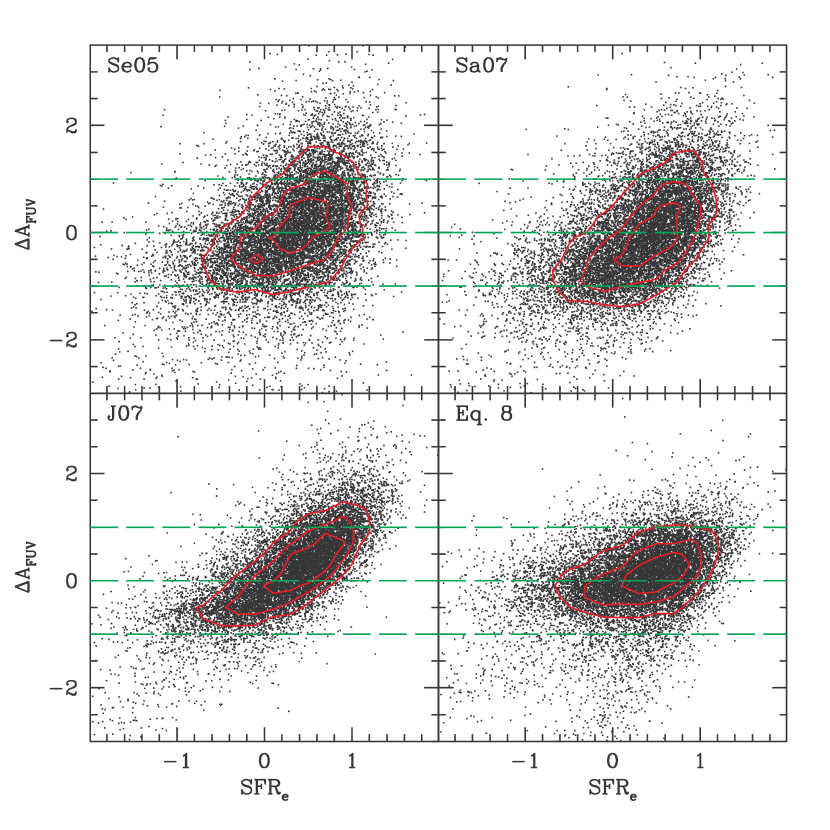
We note the FUV based SFRs corrected using one of the functions of color derived in this section. Figure 5 shows against using (left panel) and (right panel) for the blue population. The correlation is very close to equality in both cases, as expected since the corrections were designed to minimize , and the scatter is best reduced using , as expected as well from the higher correlation coefficient in Eq. 8. However a small residual trend with remains in this case, which means that the SFR dependence of the attenuation is not completely accounted for by the color dependence () would be better fitted by a linear function of color plus a linear function of ). The trend practically disappears when using but the correlation is less significant, as in the case of Se05. The parameters of the fits are listed in Table 1 for comparison with the corrections presented in the previous section. There is a small trade-off between the scatter and the trend with (the lower the rms, the more the slope deviates from unity) except for the empirical correction for which the combination of trend and scatter is best reduced ( and ). Figure 6 shows the difference between the measured attenuation (Eq. 6) and the 4 parametric estimates (Se05, Sa07, J07 and Eq. 8) as a function of (). The red curves are isodensity contours. The dashed green lines mark , 0 and 1. All 4 methods converge with around the peak of the SFR distribution ( ) and as noted above provide good average corrections but Eq. 8 minimizes for the majority of the galaxies as well as the dependence with . Although the improvement is by no means dramatic, it provides an estimate of the FUV attenuation which best recovers the SFR derived from emission lines at an equivalent or lower ‘cost’, since at least one optical photometric measurement and the redshift are required for -corrections in all cases.
4.2 Discussion
As aperture corrections are an important source of uncertainty in deriving total SFRs from the SDSS fiber spectra, we check that the above correlations are not affected by aperture effects. We define the aperture correction (AC) as the ratio of the total SFR () to the SFR estimated within the fiber (B04) and split the blue sample into 3 bins of increasing aperture correction. Figure 7 shows the to ratios as a function of for the 3 bins (shown in inset), shifted by a constant as indicated for clarity. The solid lines show the bisector fits in each bin and the dashed lines show Eq. 8 shifted by the appropriate amount for comparison. No significant difference is seen in the correlation itself as a function of aperture correction, but galaxies with (yielding a negative FUV attenuation) have systematically high aperture corrections (and low redshift). It is likely that in these large nearby galaxies, the fiber missed off-centered regions of enhanced star-formation and that was underestimated.
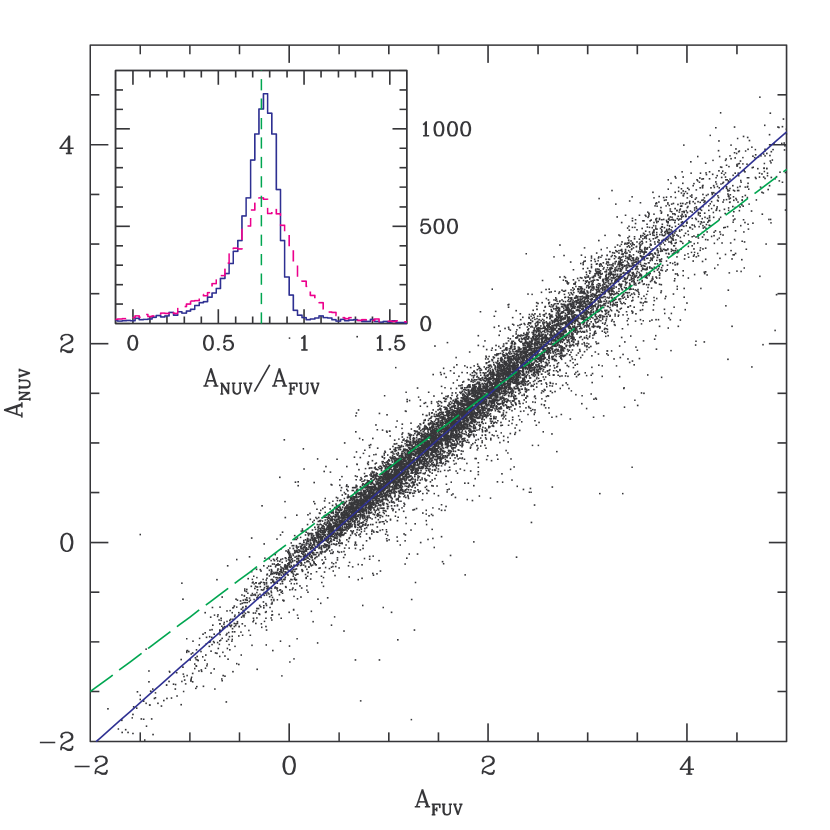
Another source of uncertainty may lie in the definition of the UV attenuation (Eq. 6). Allowing to vary, the to ratio would no longer be a measure of attenuation alone but a combination of and : log. B04 showed that the conversion factor from H luminosity to SFR () decreases with mass (and metallicity), spanning nearly 0.4 dex in the range of mass (and metallicity) spanned by the SDSS sample. This is interpreted as massive/metal rich galaxies producing less H than low mass, metal poor galaxies for the same SFR. However is much less sensitive to metallicity than H, consequently is expected to be a nearly direct measure of UV attenuation except perhaps for galaxies with very low UV attenuation and metallicity. In any case the dex variation in required to straighten up the trend seen in Fig. 6, most notably for the J07 dust correction, is definitely ruled out. Let’s note that Eq. 8 can be used to recover from the observed UV luminosity whatever the interpretation of the ratio provided is assumed in Eq. 1. Figure 8 shows the relation between and as defined in Eq. 6. The solid blue line is the best linear fit; the dashed green line at is the ratio expected from a absorption curve (Charlot & Fall, 2000). The distribution of the to ratios is shown in inset as a solid histogram, and that of the to ratios as a dotted histogram. The median ratio for the measured quantities is 0.74 (0.75 for the fits), in excellent agreement with the prediction. The GALEX data are therefore consistent with the attenuated UV fluxes predicted by the dust model used to derive from independent emission line measurements.
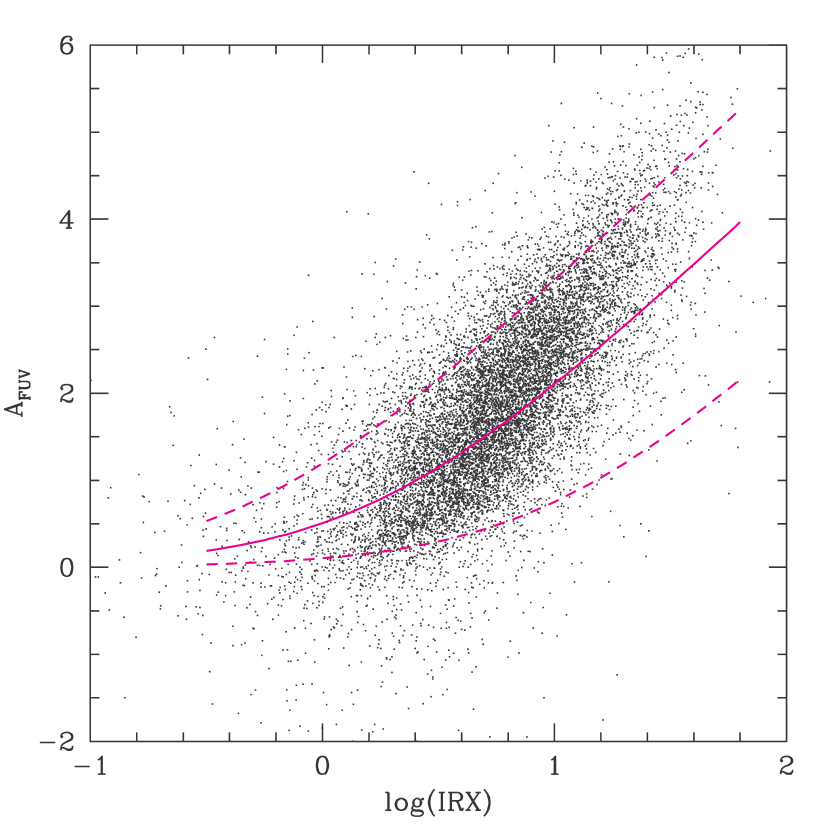
As noted in the previous section, the relation between IRX and may be responsible for the discrepancy between and (Eq. 5). Figure 9 shows the relation between (Eq. 6) and IRX derived from Dn(4000) and (Eq. 2 and 5). The solid line is the relation used by J07 to relate the two quantities (Eq. 2 with ). While it is appropriate for the average galaxy, it becomes discrepant at the blue and red ends (or for the least and most massive/star-forming galaxies). There is also a large range of attenuations for a given IRX. A color (or SFR) dependent parameter accounting for the fraction of IR flux due to new born stars (as opposed to preexisting older stars) would remedy some of the discrepancy. A blue galaxy would have little dust attenuation, little FIR emission for a given UV flux (a small IRX) and its little FIR emission would seem to have little to do with the new born stars (small ). At the other end, a red (star-forming) galaxy would be a dusty galaxy with a high SFR and its large FIR emission (large IRX) would be entirely due to the heating of dust by its new stars (large ). A parameter as large as 2 (meaning that the obscured UV emission would have to be twice the observed FIR emission) is actually necessary to reach the upper enveloppe of the IRX/ distribution. This might be accounted for by the uncertainty in the IR flux estimate, or by a large fraction of obscured UV photons being reprocessed at wavelengths other than IR. J07 modeled the contribution of new born stars to IRX as a function of galaxy color and arrived at the opposite conclusion: red galaxies have a higher contribution of older stars to their IR emission than blue galaxies and should therefore required a lower , making the trend between the corrected UV luminosity and even more pronounced. The validity of at low and high mass may of course be questionned but it seems that the estimate of the IR flux and the interpretation of IRX in terms of FUV attenuation currently involve more uncertainties than the interpretation of the optical data.
4.3 Limitations: the oldest and youngest galaxies
The color corrections do not apply to red sequence galaxies in the local sample. Dust attenuation estimates based on correlations between IRX and colors do not apply well to early-type galaxies either, both the UV and IR SEDs of such galaxies being much less directly related to the emission of young stars than those of late-type galaxies (J07). This isn’t a drastic limitation to the various methods since red sequence galaxies contribute little to the overall SFR in the local Universe, and even less as redshift increases. But we would like to know whether the above correlations between attenuation and UV–optical color apply to star-forming galaxies at higher redshift, where rest-frame UV fluxes are generally corrected using the IRX/ correlation of local starburst galaxies (Meurer et al., 1999).
Although no spectroscopic data exist at high redshift that allow the same emission line fitting technique as the SDSS spectra, we can use the unique sample of Erb et al. (2006b) who were able to acquire H flux measurements for 114 UV selected galaxies at , for which optical and NIR photometry is also available. They defined as in Eq. 1 and , using the and values of Kennicutt (1998) converted to a Chabrier (2003) IMF 222To do so, Erb et al. multiplied the Kennicutt factors (computed for a Salpeter IMF) by 1.8, however a conversion factor of 1.58 between the Salpeter and Chabrier IMFs is more appropriate (S. Salim, private communication). We corrected their SFRs accordingly and multiplied them by 0.94 to account for the small difference between the Chabrier and Kroupa IMFs.. A factor of two aperture correction was also applied to the H luminosities. Dust corrections were derived from the best-fit values of obtained from fitting SED models to the multiband photometry and using the extinction law of Calzetti et al. (2000) (see Erb et al. (2006b) for details). The authors assumed that the color excess of the nebular emission lines was equal to that of the UV continuum, rather than 2.5 times larger as proposed by Calzetti et al. (2000), as it yielded the best agreement between the UV and H SFRs after dust correction. The corrected are at most 3 times the uncorrected values and less than twice for most of the sample.
As high redshift galaxies have lower metallicities than local galaxies on average, a higher value of might be justified for this sample. However as both the range of masses and the range of metallicities span by the galaxies remain within those of the SDSS sample despite evolution in the mass/metallicity relation (Erb et al., 2006a), is not expected to be larger than the value predicted for the least massive/most metal poor galaxies in the local sample, i.e. a factor of 1.5 higher than the Kennicutt value used by Erb et al. (B04, their Fig. 7). We assume the uncorrected values of divided by 1.5 to be lower limits to the SFR and use the dust corrected values as upper limits. We computed the absolute magnitudes of the galaxies in the GALEX and SDSS bands from their optical and NIR photometry using kcorrect v4_1 (Blanton & Roweis, 2007).
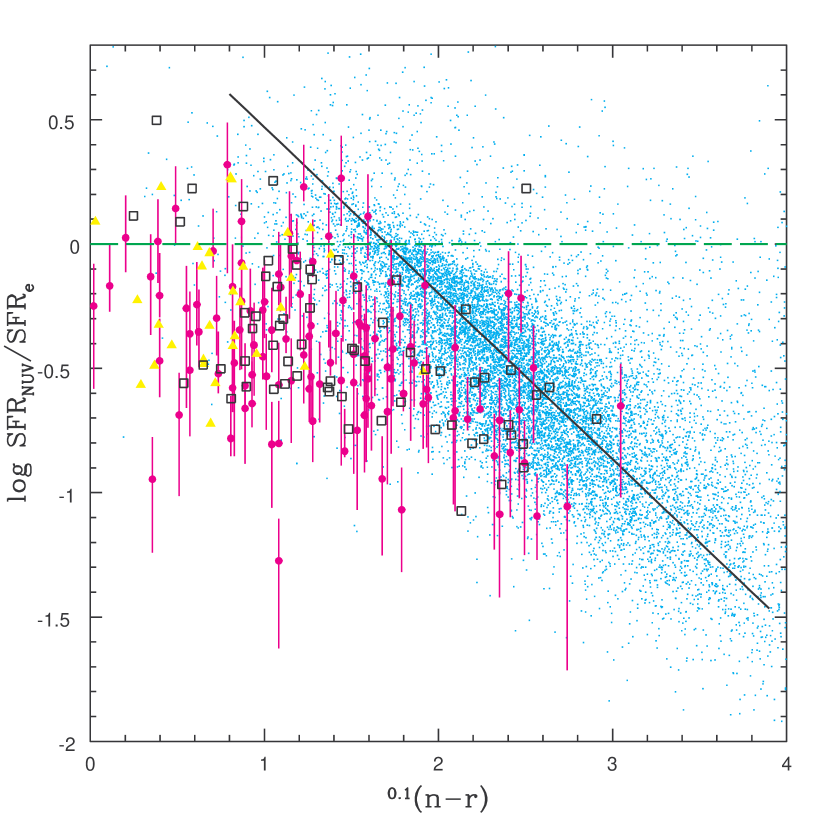
Figure 10 shows as a function of assuming for the high redshift sample and for all galaxies as before. The pink circles are the uncorrected values of . The upper and lower limits are defined as above. The local blue population is plotted in blue with the correlation derived in the previous section (Eq. 7). It is clear that the majority of LBGs which have extremely blue colors do not follow the same correlation as the local galaxies, but the reddest ones () may still be consistent with the local correlation or show a similar trend with color with only a small blue shift. The bluest LBGs cluster blueward of the local correlation in a region of low UV attenuation.
Also overplotted is a sample of 97 compact UV Luminous Galaxies (UVLGs) drawn from the present sample and from a cross-match between the SDSS and the larger, shallower GALEX All Sky Imaging Survey (Hoopes et al., 2006). from B04 are available for all of them. UVLGs (Heckman et al., 2005; Hoopes et al., 2006) are locally rare galaxies defined as having FUV luminosities typical of LBGs: , corresponding to at (Steidel et al., 1999) but to at (Wyder et al., 2005). While low surface brightness UVLGs are simply extra large versions of normal spiral galaxies, high surface brightness UVLGs with were found to consist primarily of compact starburst systems. Among these, the “supercompact” UVLGs with bear a remarkable resemblance to high redshift LBGs for a wide range of physical properties (mass, SFR, metallicity). They are thought to be their closest analogs in the Local Universe (Hoopes et al., 2006). Compact and supercompact UVLGs are represented in Fig. 10 with open squares and filled triangles respectively. Both categories occupy the same region of the plot as the high redshift sample. The supercompact UVLGs are unusually blue () among the local galaxies and like the bluest LBGs, lie the furthest away from the bulk of the local population. The extreme blue colors are an indication of strong recent star-formation (as well as low attenuation). As noted by Kennicutt (1998), the calibration in Eq. 1 might be significantly higher for strong starburst galaxies such as these. A higher would lower their to ratio proportionally and further separate them from the main population. Therefore very blue galaxies with very recent star-formation, both locally and at high redshift, form a distinct cluster of their own blueward of the attenuation/color relation of the blue sequence. This locus adds to the blue shift of the attenuation/color relation with Dn(4000) seen in Fig. 4 (left panel) as those galaxies would have Dn(4000) indices lower than our lowest bin. The reddest of the compact UVLGs and of the LBGs cover a wider range of attenuations which seem to correlate with colors in the same way as local galaxies only shifted to bluer colors.
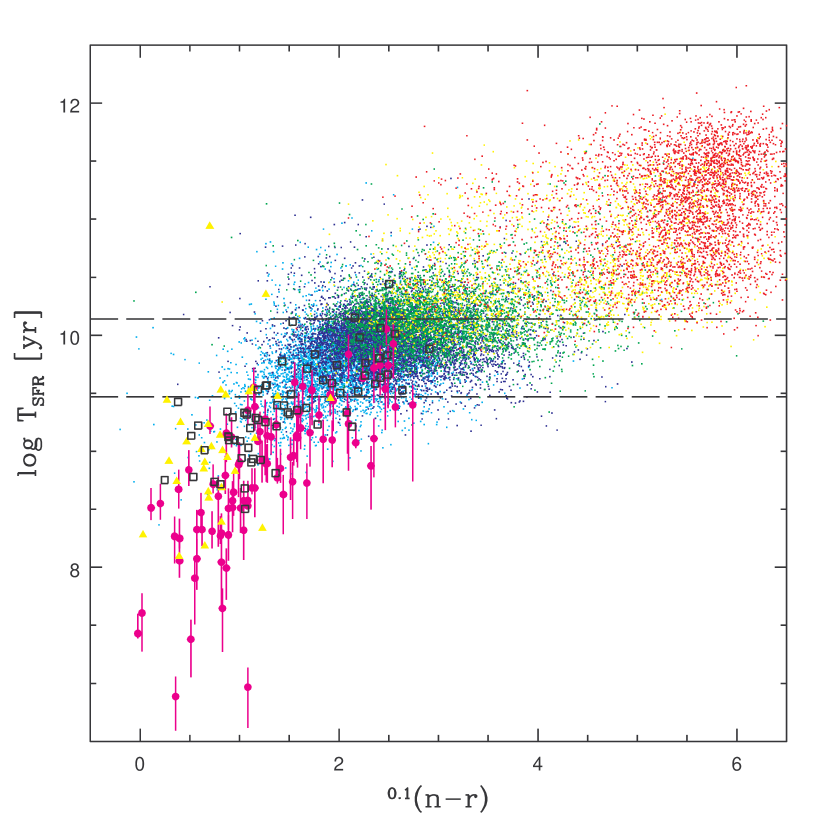
Dn(4000) estimates are not available for the high redshift sample and only available for a fraction of the UVLGs but we can use the inverse of the specific SFR – – as a common SFR time-scale for the local and high redshift samples. Stellar masses were estimated for most of the sample (Erb et al., 2006c). Masses for the GALEX/SDSS sample are from Kauffmann et al. (2003a). A third of the UVLGs have mass estimates from this catalog; for the remaining 2/3 we use the values derived by Hoopes et al. (2006) via SED fitting following Salim et al. (2005). The agreement between the mass estimates of Kauffmann et al. (2003a) and Salim et al. (2005) for the GALEX/SDDS sample is good with a rms of 0.12. As above, we use for the local sample including the UVLGs and for the galaxies. Figure 11 shows as a function of . The SDSS galaxies are color coded in bins of Dn(4000) as shown in the inset of Fig. 4 (this highlights the relation between Dn(4000) and ). The LBGs are represented by filled circles, the compact UVLGs by open squares and the supercompact UVGLs by filled triangles. The two horizontal lines correspond to the age of the Universe at and 2 (13.8 Gyrs and 3 respectively). Roughly, galaxies with larger than the age of the Universe at their redshift (e.g. nearly all local galaxies with Dn(4000) and a few LBGs) have had larger SFR in the past. Inversely, galaxies with shorter than the age of the Universe at their redshift (most LBGs and nearly all the compact UVLGs) must be forming stars more intensely than in the past.
Figure 11 is an analog of Fig. 1 with the addition of an ‘ultrablue’ sequence at and Gyrs consisting of young compact starburst galaxies. The /color correlations derived in the previous section hold for galaxies with rather uneventful SFHs (3 Gyrs Gyrs). They are a majority today but may not be when the Universe was only 3 Gyrs old, although many LBGs look very much like local blue sequence galaxies. Furthermore a dominant fraction of the stellar mass at is found in redder galaxies which are largely absent from UV surveys (Rudnick et al., 2006; van Dokkum et al., 2006; Marchesini et al., 2007). Kriek et al. (2006b) showed that almost half of their sample of NIR selected galaxies at have low SFRs and Gyr (from their Fig. 2). These galaxies are redder than LBGs and would lie in the same part of the plot as the local population.
Although we can’t conclude on the use of the local /color correlation at high redshift, we may expect it to hold for most galaxies to at least intermediate redshifts or to be slightly shifted to the left as only ‘mild evolution’ of the blue sequence was reported between and 1 (no change in the number density and colors only mag bluer; Blanton 2006 ). The luminosity density from UVLGs was found to undergo dramatic evolution between and 1, reaching of the total FUV luminosity density at (Schiminovich et al., 2005), but this includes all UVLGs, i.e. mostly very large but otherwise ordinary spiral galaxies. Compact and supercompact UVLGs are very rare in the local Universe. Although their evolution with redshift is yet unknown, they are unlikely to dominate the galaxy population at .
5 Conclusions
Using a large sample of galaxies from the Sloan Digital Sky Survey spectroscopic catalog with measured SFRs and UV photometry from the GALEX Medium Imaging Survey, we derived empirical linear correlations between the UV attenuation measured by the SFR to observed UV luminosity ratio, and the UVoptical colors of blue sequence galaxies (). The SFRs were derived from a detailed modelling of the emission lines in the optical spectra (Brinchmann et al., 2004) and were considered best estimates. The attenuation/color relation provides a simple prescription to correct UV measurements for dust attenuation in the absence of SDSS quality data. We found or confirmed that other UV attenuation estimates (Seibert et al. 2005, Salim et al. 2007, Johnson et al. 2007) tend to over (under) correct the UV luminosity of galaxies with the lowest (highest) emission line SFRs or mass. Using a sample of LBGs (Erb et al., 2006b) at with measured H emission as well as a sample of local compact UV luminous galaxies with LBG like properties (Hoopes et al., 2006), we found that extremely blue galaxies at both low and high redshift escaped the attenuation/color relation of the blue sequence to form a low attenuation sequence of their own. As such galaxies are very rare locally and the blue sequence does not evolve much from to 1 (Blanton, 2006; Willmer et al., 2006), we expect our attenuation correction to remain adequate for the majority of galaxies to at least intermediate redshifts.
References
- Adelman-McCarthy et al. (2006) Adelman-McCarthy, J. K., Agüeros, M. A., Allam, S. S., Anderson, K. S. J., Anderson, S. F., Annis, J., Bahcall, N. A., Baldry, I. K., Barentine, J. C., Berlind, A., Bernardi, M., Blanton, M. R., Boroski, W. N., Brewington, H. J., Brinchmann, J., Brinkmann, J., Brunner, R. J., Budavári, T., Carey, L. N., Carr, M. A., Castander, F. J., Connolly, A. J., Csabai, I., Czarapata, P. C., Dalcanton, J. J., Doi, M., Dong, F., Eisenstein, D. J., Evans, M. L., Fan, X., Finkbeiner, D. P., Friedman, S. D., Frieman, J. A., Fukugita, M., Gillespie, B., Glazebrook, K., Gray, J., Grebel, E. K., Gunn, J. E., Gurbani, V. K., de Haas, E., Hall, P. B., Harris, F. H., Harvanek, M., Hawley, S. L., Hayes, J., Hendry, J. S., Hennessy, G. S., Hindsley, R. B., Hirata, C. M., Hogan, C. J., Hogg, D. W., Holmgren, D. J., Holtzman, J. A., Ichikawa, S.-i., Ivezić, Ž., Jester, S., Johnston, D. E., Jorgensen, A. M., Jurić, M., Kent, S. M., Kleinman, S. J., Knapp, G. R., Kniazev, A. Y., Kron, R. G., Krzesinski, J., Kuropatkin, N., Lamb, D. Q., Lampeitl, H., Lee, B. C., Leger, R. F., Lin, H., Long, D. C., Loveday, J., Lupton, R. H., Margon, B., Martínez-Delgado, D., Mandelbaum, R., Matsubara, T., McGehee, P. M., McKay, T. A., Meiksin, A., Munn, J. A., Nakajima, R., Nash, T., Neilsen, Jr., E. H., Newberg, H. J., Newman, P. R., Nichol, R. C., Nicinski, T., Nieto-Santisteban, M., Nitta, A., O’Mullane, W., Okamura, S., Owen, R., Padmanabhan, N., Pauls, G., Peoples, J. J., Pier, J. R., Pope, A. C., Pourbaix, D., Quinn, T. R., Richards, G. T., Richmond, M. W., Rockosi, C. M., Schlegel, D. J., Schneider, D. P., Schroeder, J., Scranton, R., Seljak, U., Sheldon, E., Shimasaku, K., Smith, J. A., Smolčić, V., Snedden, S. A., Stoughton, C., Strauss, M. A., SubbaRao, M., Szalay, A. S., Szapudi, I., Szkody, P., Tegmark, M., Thakar, A. R., Tucker, D. L., Uomoto, A., Vanden Berk, D. E., Vandenberg, J., Vogeley, M. S., Voges, W., Vogt, N. P., Walkowicz, L. M., Weinberg, D. H., West, A. A., White, S. D. M., Xu, Y., Yanny, B., Yocum, D. R., York, D. G., Zehavi, I., Zibetti, S., & Zucker, D. B. 2006, ApJS, 162, 38
- Balogh et al. (1998) Balogh, M. L., Schade, D., Morris, S. L., Yee, H. K. C., Carlberg, R. G., & Ellingson, E. 1998, ApJ, 504, L75+
- Bianchi et al. (2006) Bianchi, L., Rodriguez-Merino, L., Viton, M., Laget, M., Efremova, B., Herald, J., Conti, A., Shiao, B., Gil de Paz, A., Salim, S., Thakar, A., Friedman, P. G., Rey, S. C., Thilker, D., Barlow, T. A., Budavari, T., Donas, J., Forster, K., Heckman, T. M., Lee, Y.-W., Madore, B. F., Martin, D. C., Milliard, B., Morrissey, P., Neff, S. G., Rich, R. M., Schiminovich, D., Seibert, M., Small, T., Szalay, A. S., Wyder, T. K., Welsh, B. Y., & Yi, S. K. 2006, ArXiv Astrophysics e-prints
- Blanton (2006) Blanton, M. R. 2006, ApJ, 648, 268
- Blanton & Roweis (2007) Blanton, M. R. & Roweis, S. 2007, AJ, 133, 734
- Brinchmann et al. (2004) Brinchmann, J., Charlot, S., White, S. D. M., Tremonti, C., Kauffmann, G., Heckman, T., & Brinkmann, J. 2004, MNRAS, 351, 1151
- Bruzual & Charlot (2003) Bruzual, G. & Charlot, S. 2003, MNRAS, 344, 1000
- Buat (1992) Buat, V. 1992, A&A, 264, 444
- Buat et al. (2005) Buat, V., Iglesias-Páramo, J., Seibert, M., Burgarella, D., Charlot, S., Martin, D. C., Xu, C. K., Heckman, T. M., Boissier, S., Boselli, A., Barlow, T., Bianchi, L., Byun, Y.-I., Donas, J., Forster, K., Friedman, P. G., Jelinski, P., Lee, Y.-W., Madore, B. F., Malina, R., Milliard, B., Morissey, P., Neff, S., Rich, M., Schiminovitch, D., Siegmund, O., Small, T., Szalay, A. S., Welsh, B., & Wyder, T. K. 2005, ApJ, 619, L51
- Calzetti et al. (2000) Calzetti, D., Armus, L., Bohlin, R. C., Kinney, A. L., Koornneef, J., & Storchi-Bergmann, T. 2000, ApJ, 533, 682
- Calzetti et al. (1994) Calzetti, D., Kinney, A. L., & Storchi-Bergmann, T. 1994, ApJ, 429, 582
- Chabrier (2003) Chabrier, G. 2003, PASP, 115, 763
- Charlot & Fall (2000) Charlot, S. & Fall, S. M. 2000, ApJ, 539, 718
- Charlot et al. (2002) Charlot, S., Kauffmann, G., Longhetti, M., Tresse, L., White, S. D. M., Maddox, S. J., & Fall, S. M. 2002, MNRAS, 330, 876
- Charlot & Longhetti (2001) Charlot, S. & Longhetti, M. 2001, MNRAS, 323, 887
- Cortese et al. (2006) Cortese, L., Boselli, A., Buat, V., Gavazzi, G., Boissier, S., Gil de Paz, A., Seibert, M., Madore, B. F., & Martin, D. C. 2006, ApJ, 637, 242
- Erb et al. (2006a) Erb, D. K., Shapley, A. E., Pettini, M., Steidel, C. C., Reddy, N. A., & Adelberger, K. L. 2006a, ApJ, 644, 813
- Erb et al. (2006b) Erb, D. K., Steidel, C. C., Shapley, A. E., Pettini, M., Reddy, N. A., & Adelberger, K. L. 2006b, ApJ, 647, 128
- Erb et al. (2006c) —. 2006c, ApJ, 646, 107
- Heckman et al. (2005) Heckman, T. M., Hoopes, C. G., Seibert, M., Martin, D. C., Salim, S., Rich, R. M., Kauffmann, G., Charlot, S., Barlow, T. A., Bianchi, L., Byun, Y.-I., Donas, J., Forster, K., Friedman, P. G., Jelinsky, P. N., Lee, Y.-W., Madore, B. F., Malina, R. F., Milliard, B., Morrissey, P. F., Neff, S. G., Schiminovich, D., Siegmund, O. H. W., Small, T., Szalay, A. S., Welsh, B. Y., & Wyder, T. K. 2005, ApJ, 619, L35
- Hoopes et al. (2006) Hoopes, C., Heckman, T., S., S., Seibert, M., Tremonti, C. A., Schiminovich, D., Rich, R., Martin, D., Charlot, S., Kauffmann, G., Forster, K., Friedman, P., Morrissey, P., Neff, S., Small, T., Wyder, T., Bianchi, L., Donas, J., Lee, Y.-W., Madore, B., Milliard, B., Szalay, A., Welsh, B., & Yi, S. 2006, Accepted for the GALEX special issue of ApJS
- Isobe et al. (1990) Isobe, T., Feigelson, E. D., Akritas, M. G., & Babu, G. J. 1990, ApJ, 364, 104
- Johnson et al. (2006) Johnson, B. D., Schiminovich, D., Seibert, M., Treyer, M. A., Charlot, S., Heckman, T. M., Martin, D. C., Salim, S., Kauffmann, G., Bianchi, L., Donas, J., Friedman, P. G., Lee, Y.-W., Madore, B. F., Milliard, B., Morrissey, P., Neff, S. G., Rich, R. M., Szalay, A. S., Forster, K., Barlow, T. A., Conrow, T., Small, T., & Wyder, T. K. 2006, ApJ, 644, L109
- Johnson et al. (2007) Johnson et al. 2007, ApjS, Submitted
- Kauffmann et al. (2003a) Kauffmann, G., Heckman, T. M., White, S. D. M., Charlot, S., Tremonti, C., Brinchmann, J., Bruzual, G., Peng, E. W., Seibert, M., Bernardi, M., Blanton, M., Brinkmann, J., Castander, F., Csábai, I., Fukugita, M., Ivezic, Z., Munn, J. A., Nichol, R. C., Padmanabhan, N., Thakar, A. R., Weinberg, D. H., & York, D. 2003a, MNRAS, 341, 33
- Kauffmann et al. (2003b) Kauffmann, G., Heckman, T. M., White, S. D. M., Charlot, S., Tremonti, C., Peng, E. W., Seibert, M., Brinkmann, J., Nichol, R. C., SubbaRao, M., & York, D. 2003b, MNRAS, 341, 54
- Kennicutt (1998) Kennicutt, Jr., R. C. 1998, ApJ, 498, 541
- Kong et al. (2004) Kong, X., Charlot, S., Brinchmann, J., & Fall, S. M. 2004, MNRAS, 349, 769
- Kriek et al. (2006a) Kriek, M., van Dokkum, P. G., Franx, M., Förster Schreiber, N. M., Gawiser, E., Illingworth, G. D., Labbé, I., Marchesini, D., Quadri, R., Rix, H.-W., Rudnick, G., Toft, S., van der Werf, P., & Wuyts, S. 2006a, ApJ, 645, 44
- Kriek et al. (2006b) Kriek, M., van Dokkum, P. G., Franx, M., Quadri, R., Gawiser, E., Herrera, D., Illingworth, G. D., Labbé, I., Lira, P., Marchesini, D., Rix, H.-W., Rudnick, G., Taylor, E. N., Toft, S., Urry, C. M., & Wuyts, S. 2006b, ApJ, 649, L71
- Kroupa (2001) Kroupa, P. 2001, MNRAS, 322, 231
- Marchesini et al. (2007) Marchesini, D., van Dokkum, P., Quadri, R., Rudnick, G., Franx, M., Lira, P., Wuyts, S., Gawiser, E., Christlein, D., & Toft, S. 2007, ApJ, 656, 42
- Martin et al. (2005) Martin, D. C., Fanson, J., Schiminovich, D., Morrissey, P., Friedman, P. G., Barlow, T. A., Conrow, T., Grange, R., Jelinsky, P. N., Milliard, B., Siegmund, O. H. W., Bianchi, L., Byun, Y.-I., Donas, J., Forster, K., Heckman, T. M., Lee, Y.-W., Madore, B. F., Malina, R. F., Neff, S. G., Rich, R. M., Small, T., Surber, F., Szalay, A. S., Welsh, B., & Wyder, T. K. 2005, ApJ, 619, L1
- Meurer et al. (1999) Meurer, G. R., Heckman, T. M., & Calzetti, D. 1999, ApJ, 521, 64
- Ree et al. (2007) Ree, C. H., Lee, Y.-W., Yi, S. K., Yoon, S.-J., Rich, R. M., Deharveng, J.-M., Sohn, Y.-J., Kaviraj, S., Rhee, J., Sheen, Y.-K., Schawinski, K., Rey, S.-C., Boselli, A., Rhee, J., Donas, J., Seibert, M., Wyder, T. K., Barlow, T. A., Bianchi, L., Forster, K., Friedman, P. G., Heckman, T. M., Madore, B. F., Martin, D. C., Milliard, B., Morrissey, P., Neff, S. G., Schiminovich, D., Small, T., Szalay, A. S., & Welsh, B. Y. 2007, ArXiv Astrophysics e-prints
- Rudnick et al. (2006) Rudnick, G., Labbé, I., Förster Schreiber, N. M., Wuyts, S., Franx, M., Finlator, K., Kriek, M., Moorwood, A., Rix, H.-W., Röttgering, H., Trujillo, I., van der Wel, A., van der Werf, P., & van Dokkum, P. G. 2006, ApJ, 650, 624
- Salim et al. (2005) Salim, S., Charlot, S., Rich, R. M., Kauffmann, G., Heckman, T. M., Barlow, T. A., Bianchi, L., Byun, Y.-I., Donas, J., Forster, K., Friedman, P. G., Jelinsky, P. N., Lee, Y.-W., Madore, B. F., Malina, R. F., Martin, D. C., Milliard, B., Morrissey, P., Neff, S. G., Schiminovich, D., Seibert, M., Siegmund, O. H. W., Small, T., Szalay, A. S., Welsh, B. Y., & Wyder, T. K. 2005, ApJ, 619, L39
- Salim et al. (2007) Salim et al. 2007, ApjS, Submitted
- Schiminovich et al. (2005) Schiminovich, D., Ilbert, O., Arnouts, S., Milliard, B., Tresse, L., Le Fèvre, O., Treyer, M., Wyder, T. K., Budavári, T., Zucca, E., Zamorani, G., Martin, D. C., Adami, C., Arnaboldi, M., Bardelli, S., Barlow, T., Bianchi, L., Bolzonella, M., Bottini, D., Byun, Y.-I., Cappi, A., Contini, T., Charlot, S., Donas, J., Forster, K., Foucaud, S., Franzetti, P., Friedman, P. G., Garilli, B., Gavignaud, I., Guzzo, L., Heckman, T. M., Hoopes, C., Iovino, A., Jelinsky, P., Le Brun, V., Lee, Y.-W., Maccagni, D., Madore, B. F., Malina, R., Marano, B., Marinoni, C., McCracken, H. J., Mazure, A., Meneux, B., Morrissey, P., Neff, S., Paltani, S., Pellò, R., Picat, J. P., Pollo, A., Pozzetti, L., Radovich, M., Rich, R. M., Scaramella, R., Scodeggio, M., Seibert, M., Siegmund, O., Small, T., Szalay, A. S., Vettolani, G., Welsh, B., Xu, C. K., & Zanichelli, A. 2005, ApJ, 619, L47
- Seibert et al. (2005) Seibert, M., Martin, D. C., Heckman, T. M., Buat, V., Hoopes, C., Barlow, T., Bianchi, L., Byun, Y.-I., Donas, J., Forster, K., Friedman, P. G., Jelinsky, P., Lee, Y.-W., Madore, B. F., Malina, R., Milliard, B., Morrissey, P., Neff, S., Rich, R. M., Schiminovich, D., Siegmund, O., Small, T., Szalay, A. S., Welsh, B., & Wyder, T. K. 2005, ApJ, 619, L55
- Steidel et al. (1999) Steidel, C. C., Adelberger, K. L., Giavalisco, M., Dickinson, M., & Pettini, M. 1999, ApJ, 519, 1
- Strateva et al. (2001) Strateva, I., Ivezić, Ž., Knapp, G. R., Narayanan, V. K., Strauss, M. A., Gunn, J. E., Lupton, R. H., Schlegel, D., Bahcall, N. A., Brinkmann, J., Brunner, R. J., Budavári, T., Csabai, I., Castander, F. J., Doi, M., Fukugita, M., Győry, Z., Hamabe, M., Hennessy, G., Ichikawa, T., Kunszt, P. Z., Lamb, D. Q., McKay, T. A., Okamura, S., Racusin, J., Sekiguchi, M., Schneider, D. P., Shimasaku, K., & York, D. 2001, AJ, 122, 1861
- Tremonti et al. (2004) Tremonti, C. A., Heckman, T. M., Kauffmann, G., Brinchmann, J., Charlot, S., White, S. D. M., Seibert, M., Peng, E. W., Schlegel, D. J., Uomoto, A., Fukugita, M., & Brinkmann, J. 2004, ApJ, 613, 898
- van Dokkum et al. (2005) van Dokkum, P. G., Kriek, M., Rodgers, B., Franx, M., & Puxley, P. 2005, ApJ, 622, L13
- van Dokkum et al. (2006) van Dokkum, P. G., Quadri, R., Marchesini, D., Rudnick, G., Franx, M., Gawiser, E., Herrera, D., Wuyts, S., Lira, P., Labbé, I., Maza, J., Illingworth, G. D., Förster Schreiber, N. M., Kriek, M., Rix, H.-W., Taylor, E. N., Toft, S., Webb, T., & Yi, S. K. 2006, ApJ, 638, L59
- Wang & Heckman (1996) Wang, B. & Heckman, T. M. 1996, ApJ, 457, 645
- Willmer et al. (2006) Willmer, C. N. A., Faber, S. M., Koo, D. C., Weiner, B. J., Newman, J. A., Coil, A. L., Connolly, A. J., Conroy, C., Cooper, M. C., Davis, M., Finkbeiner, D. P., Gerke, B. F., Guhathakurta, P., Harker, J., Kaiser, N., Kassin, S., Konidaris, N. P., Lin, L., Luppino, G., Madgwick, D. S., Noeske, K. G., Phillips, A. C., & Yan, R. 2006, ApJ, 647, 853
- Witt et al. (1992) Witt, A. N., Thronson, Jr., H. A., & Capuano, Jr., J. M. 1992, ApJ, 393, 611
- Wyder et al. (2005) Wyder, T. K., Treyer, M. A., Milliard, B., Schiminovich, D., Arnouts, S., Budavári, T., Barlow, T. A., Bianchi, L., Byun, Y.-I., Donas, J., Forster, K., Friedman, P. G., Heckman, T. M., Jelinsky, P. N., Lee, Y.-W., Madore, B. F., Malina, R. F., Martin, D. C., Morrissey, P., Neff, S. G., Rich, R. M., Siegmund, O. H. W., Small, T., Szalay, A. S., & Welsh, B. Y. 2005, ApJ, 619, L15
| Model | slope | Var() | rms | ||
|---|---|---|---|---|---|
| Se05 | 0.9498 | 5.181e-05 | 0.7392 | 0.4209 | 0.0012 |
| Sa07 | 0.8314 | 2.23e-05 | 0.7866 | 0.3328 | 0.0421 |
| J07 | 0.7171 | 1.242e-05 | 0.8658 | 0.2278 | -0.0847 |
| Eq. 9 | 0.9799 | 5.14e-05 | 0.7487 | 0.4266 | 0.0061 |
| Eq. 8 | 0.9258 | 1.915e-05 | 0.8705 | 0.2893 |