WEBT and XMM-Newton observations of 3C 454.3 during the post-outburst phase
Abstract
Context. The quasar-type blazar 3C 454.3 was observed to undergo an unprecedented optical outburst in spring 2005, affecting the source brightness from the near-IR to the X-ray frequencies. This was first followed by a millimetric and then by a radio outburst, which peaked in February 2006.
Aims. In this paper we report on follow-up observations to study the multiwavelength emission in the post-outburst phase.
Methods. Radio, near-infrared, and optical monitoring was performed by the Whole Earth Blazar Telescope (WEBT) collaboration in the 2006–2007 observing season. XMM-Newton observations on July 2–3 and December 18–19, 2006 added information on the X-ray and UV states of the source.
Results. The source was in a faint state. The radio flux at the higher frequencies showed a fast decreasing trend, which represents the tail of the big radio outburst. It was followed by a quiescent state, common at all radio frequencies. In contrast, moderate activity characterized the near-IR and optical light curves, with a progressive increase of the variability amplitude with increasing wavelength. We ascribe this redder-when-brighter behaviour to the presence of a “little blue bump” due to line emission from the broad line region, which is clearly visible in the source spectral energy distribution (SED) during faint states. Moreover, the data from the XMM-Newton Optical Monitor reveal a rise of the SED in the ultraviolet, suggesting the existence of a “big blue bump” due to thermal emission from the accretion disc. The X-ray spectra are well fitted with a power-law model with photoelectric absorption, possibly larger than the Galactic one. However, the comparison with previous X-ray observations would imply that the amount of absorbing matter is variable. Alternatively, the intrinsic X-ray spectrum presents a curvature, which may depend on the X-ray brightness. In this case, two scenarios are possible. i) There is no extra absorption, and the X-ray spectrum hardens at low energies, the hardening being more evident in bright states. ii) There is a constant amount of extra absorption, likely in the quasar environment, and the X-ray spectrum softens at low energies, at least in faint X-ray states. This softening might be the result of a flux contribution by the high-frequency tail of the big blue bump.
Key Words.:
galaxies: active – galaxies: quasars: general – galaxies: quasars: individual: 3C 454.31 Introduction
In May 2005 the flat-spectrum radio quasar 3C 454.3 was observed in an unprecedented bright optical state. This triggered observations by high-energy satellites (Chandra, see Villata et al. 2006; INTEGRAL, see Pian et al. 2006; Swift, see Giommi et al. 2006), which found an exceptionally high flux also in the X-ray band. A multiwavelength (radio-to-optical) monitoring campaign was organized by the Whole Earth Blazar Telescope (WEBT)111http://www.to.astro.it/blazars/webt/ to follow in detail the behaviour of the low-energy emission. Past data were also collected, both published and unpublished ones, so that this behaviour was traced back to summer 1966. The main results were published by Villata et al. (2006): the different behaviour shown by the optical and radio historical light curves was interpreted as due to the fact that the corresponding jet emitting regions are separated and misaligned. In this picture, the inner region, which is responsible for the optical radiation, became more aligned with the line of sight during the 2004–2005 outburst. This produced an increase of the Doppler factor and a consequent enhancement of the flux. Moreover, the analysis of the colour-index behaviour during the outburst, generally redder-when-brighter, led Villata et al. (2006) to suggest the presence of a luminous accretion disc.
The WEBT continued to monitor the source also in the post-outburst period, in particular in order to detect a possible correlated event in the radio bands. Indeed, a huge mm outburst was observed to peak in June–July 2005. At the high radio frequencies (43 to GHz), a long-lasting outburst developed, reaching the maximum flux levels in late February 2006. The event was seen progressively delayed and fainter going towards lower frequencies, disappearing below 8 GHz. These data were presented and discussed by Villata et al. (2007). According to their interpretation, the radio peak observed in late February 2006 is not the delayed radio counterpart of the spring 2005 optical peak, but it is instead connected to a minor optical flare detected in October–November 2005. This interpretation combines an intrinsic variability mechanism (disturbances travelling down the jet) with a differential change of the emitting regions viewing angles, due to the motion of the curved jet.
Monitoring of the source by the WEBT continued and was complemented, in July and December 2006, by two pointings of the XMM-Newton satellite to study the high-energy emission in the post-outburst phase. In this paper we present the results of this new observing effort on 3C 454.3. A third XMM-Newton pointing was performed in May 2007 and its results will be reported in a further paper, where the multifrequency historical behaviour of the source will be reconstructed and analysed.
This paper is organised as follows: the radio-to-optical observations by the WEBT are presented in Sect. 2, while Sect. 3 reports on the results of the XMM-Newton pointings. The broad-band spectral energy distributions (SEDs) of the source at various epochs are analysed in Sect. 4. Conclusions are drawn in Sect. 5.
| Observatory | Tel. size | Bands |
| Radio | ||
| SAO RAS (RATAN-600), Russia | 600 ma | 1, 2.3, 5, 8, |
| 11, 22 GHz | ||
| Crimean (RT-22), Ukraine | 22 m | 22, 37 GHz |
| Metsähovi, Finland | 14 m | 37 GHz |
| Noto, Italy | 32 m | 43 GHz |
| Medicina, Italy | 32 m | 5, 8, 22 GHz |
| UMRAO, USA | 26 m | 5, 8, 14.5 GHz |
| Near-infrared | ||
| Campo Imperatore, Italy | 110 cm | |
| Optical | ||
| Osaka Kyoiku, Japan | 51 cm | |
| Yunnan, China | 102 cm | |
| Sobaeksan, South Korea | 61 cm | |
| Lulin (SLT), Taiwan | 40 cm | |
| Mt. Maidanak (AZT-22), Uzbekistan | 150 cm | |
| Mt. Maidanak (T60-K), Uzbekistan | 60 cm | |
| Abastumani, Georgia | 70 cm | |
| Crimean, Ukraine | 70 cm | |
| Jakokoski, Finland | 50 cm | |
| Skinakas, Greece | 130 cm | |
| Rozhen, Bulgaria | 200 cm | |
| Rozhen, Bulgaria | 50/70 cm | |
| Tuorla, Finland | 103 cm | |
| Michael Adrian, Germany | 120 cm | |
| Valle d’Aosta, Italy | 81 cm | |
| Sabadell, Spain | 50 cm | |
| L’Ampolla, Spain | 36 cm | |
| Bordeaux, France | 20 cm | |
| Roque (KVA), Spain | 35 cm | |
| Roque (NOT), Spain | 256 cm | |
| Kitt Peak (WIYN), USA | 90 cm | |
| Kitt Peak (MDM), USA | 130 cm | |
| a Ring telescope | ||
2 Observations by the WEBT
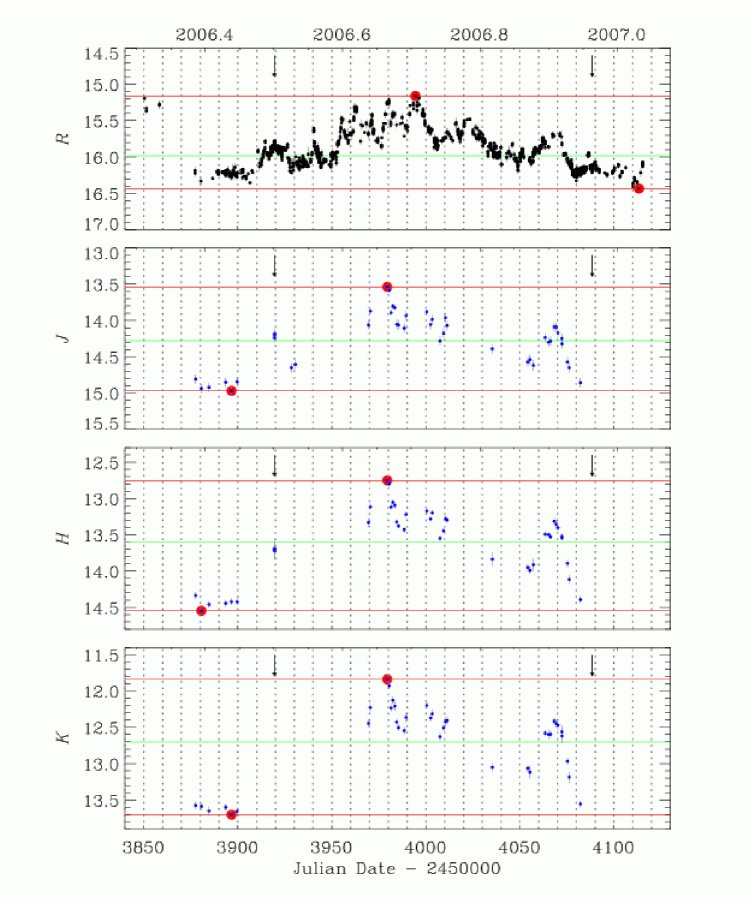
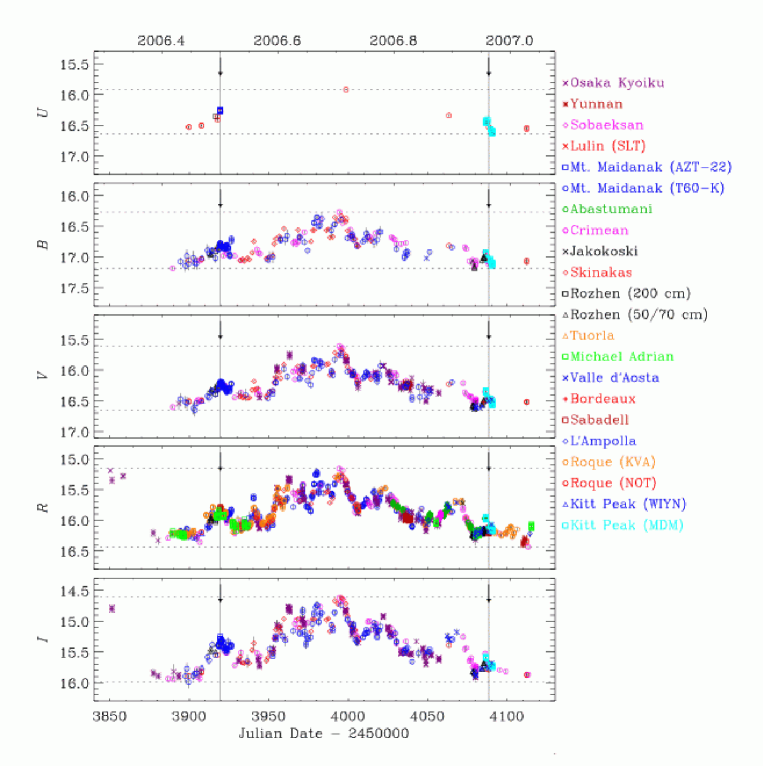
Table 1 contains the list of the radio, near-infrared, and optical observatories participating in the 2006–2007 WEBT campaign (starting from September 2006 for the radio observers, and from May 2006 for the near-infrared and optical ones). Earlier data were published by Villata et al. (2006, 2007). Col. 1 reports the name of the observatory and the country where it is located, Col. 2 gives the telescope size, and Col. 3 the observing bands. Notice that for each group (radio, near-infrared, and optical), the observatories are listed in order of longitude; indeed, one of the WEBT characteristics is the spread in longitude of its members, which in principle allows continuous 24 hour monitoring.
Light curves in Johnson-Cousins bands are plotted in Fig. 1. The largest contributions (more than 30 observing nights) came from the Mt. Maidanak, Roque (KVA), Crimean, Osaka Kyoiku, and Skinakas observatories. The source magnitude has been calibrated according to Angione (1971) in the band, to Raiteri et al. (1998) in the bands, and to González-Pérez et al. (2001) in the band. A cleaning process was applied to minimize data scattering due to photometric uncertainties, as described by e.g. Villata et al. (2002) and Raiteri et al. (2005). The total number of data points in Fig. 1 is 3201, % of which are in the band.
Figure 1 shows the source in a rather faint state, but with significant magnitude variations: the difference between the minimum and maximum brightness levels is 0.72, 0.91, 1.04, 1.28, and 1.38 mag in the , , , , and band, respectively. Notwithstanding the different sampling of the light curves, a progressive increasing of the variability amplitude with wavelength is clearly recognizable.
The -band light curve is compared to the near-IR ones in Fig. 2. The latter are less sampled than the optical ones, since only the 110 cm telescope at Campo Imperatore was monitoring the source at these frequencies. The fluxes have a maximum at JD = 2453979, in correspondence to one of the brightest optical peaks. We can see that the variability amplitude continues to increase with wavelength (1.43, 1.80, and 1.86 mag in , , and bands, respectively). This trend seems to be another indication in favour of the existence of a luminous accretion disc, which was suggested to be responsible for the redder-when-brighter behaviour found by Villata et al. (2006). We will come back to this point in the following section.
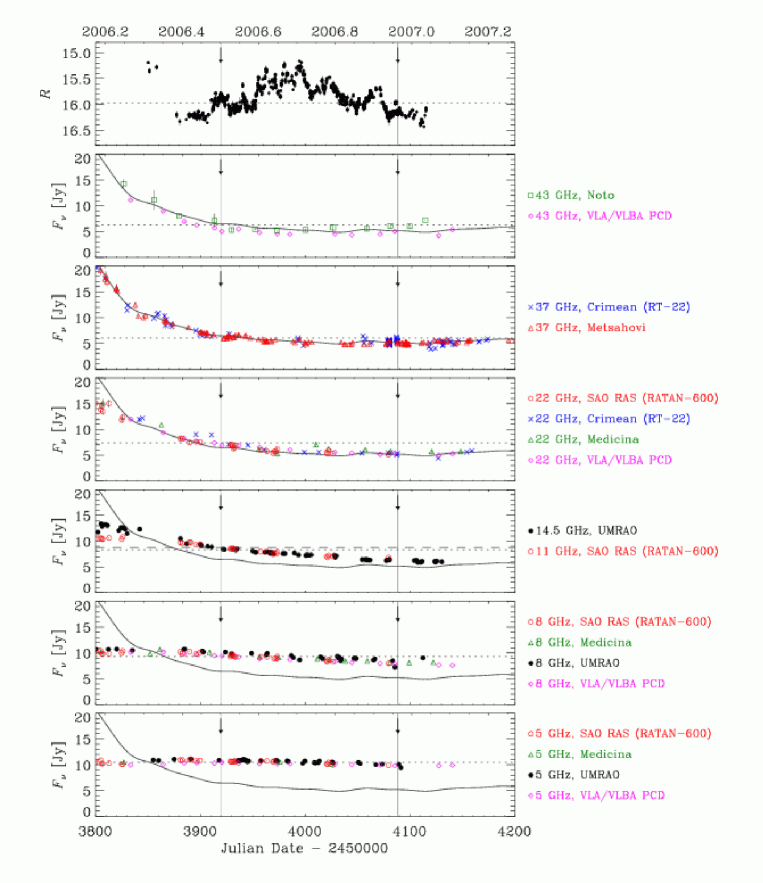
The behaviour of the radio flux density (Jy) at different frequencies is shown in Fig. 3, where the first panel reports the optical light curve in the band for a comparison. We also included data from the VLA/VLBA Polarization Calibration Database (PCD)222http://www.vla.nrao.edu/astro/calib/polar/.
In contrast with the optical light curves, showing some activity, the radio flux displays only a smooth decreasing trend, which is mainly recognizable at the higher frequencies, where we see the tail of the big radio outburst peaking in late February 2006 that was analysed by Villata et al. (2007). Indeed, we notice that at the beginning of the period considered in Fig. 3, the radio spectrum is still inverted, as during the outburst, suggesting that the flux enhancement comes from the inner radio emitting region. Then, as the high-frequency flux decays, the radio spectrum becomes softer and softer, and the flux density increases with increasing wavelength. This behaviour is highlighted in Fig. 3 by reporting the 37 GHz (20-day binned) cubic spline interpolation in the various radio panels for a comparison between frequencies. As expected, the 37 GHz spline matches the 43 GHz data fairly well, while lower-frequencies light curves intersect the spline at some time, when the corresponding spectral index changes sign and the spectrum is no longer inverted.
3 Observations by XMM-Newton
The X-ray Multi-Mirror Mission (XMM) - Newton satellite observed 3C 454.3 twice during the period considered in this paper (PI: C. M. Raiteri). The first time was during revolution number 1202, from July 2, 2006 at 21:25:07 UT to July 3 at 01:58:37 UT (JD = 2453919.39244–2453919.58237). The second observation took place during revolution number 1287, from December 18, 2006 at 20:07:27 UT to December 19 at 00:25:14 (JD = 2454088.33851–2454088.51752).
3.1 Results from EPIC
The European Photon Imaging Camera (EPIC) includes three detectors: MOS1, MOS2 (Turner et al., 2001), and pn (Strüder et al., 2001). Since a bright state of the source could not be excluded, a medium-filter/small-window configuration was chosen in order to avoid possible contamination by lower-energy photons as well as photon pile-up.
Data were reduced with the Science Analysis System (SAS) software, version 7.0. Only the good time intervals were selected, i.e. the periods which are free of high-background flares. This temporal filtering, which was performed according to standard prescriptions, reduced the available integration time for MOS1, MOS2, and pn by %, 5%, and 30%, respectively in July. For the December data these numbers became %, 27%, and 40%, because of a very high background at the beginning of the exposure.
Both the source and background spectra were extracted by setting (FLAG==0) and (PATTERN=4) in the selection expression for all the three EPIC detectors. The first string rejects artifacts as well as events next to both CCD edges and bad pixels, which may have incorrect energies; the second string selects only single and double pixel events, which have the best energy calibration. Source spectra were extracted from circular regions with and arcsec radii for MOS and pn, respectively; background spectra were selected as the largest source-free circles that can be arranged on the same CCD: and arcsec radius regions for MOS and pn, respectively.
By means of the grppha task of the FTOOL package, the source spectra were grouped, i.e. the energy channels were binned in order to have a minimum of 25 counts in each bin, and they were associated with the corresponding background and response files. The grouped spectra were then analysed with the Xspec package, version 11.3.2. Only energy channels between 0.3 and 12 keV were considered.
The same model spectrum was applied to the MOS1, MOS2, and pn data simultaneously to increase the statistics. We first applied a single power law with Galactic absorption modelled according to the Wilms et al. (2000) prescriptions and , from the Leiden/Argentine/Bonn (LAB) Survey (see Kalberla et al., 2005). The results are shown in Table 2, where Col. 2 reports the column density, Col. 3 the photon spectral index , Col. 4 the unabsorbed flux density at 1 keV, Col. 5 the 2–10 keV observed flux, and Col. 6 the value of (with the number of degrees of freedom ).
| Date | () | ||||
|---|---|---|---|---|---|
| [] | [Jy] | [] | |||
| Single power law with Galactic absorption | |||||
| July 2–3 | 0.724 | 1.52 0.01 | 0.87 0.01 | 0.857 (1093) | |
| Dec. 18–19 | 0.724 | 1.57 0.01 | 1.18 0.01 | 1.051 (1074) | |
| Single power law with free absorption | |||||
| July 2–3 | 0.87 0.06 | 1.55 0.02 | 0.90 0.02 | 0.842 (1092) | |
| Dec. 18–19 | 1.01 0.06 | 1.65 0.02 | 1.29 0.02 | 0.985 (1073) | |
| Double power law with fixed extra absorption | |||||
| July 2–3 | 1.34 | 1.49, 2.99 0.20 | 0.99 0.02 | 0.849 (1092) | |
| Dec. 18–19 | 1.34 | 1.58, 2.87 0.23 | 1.37 0.04 | 0.984 (1073) | |
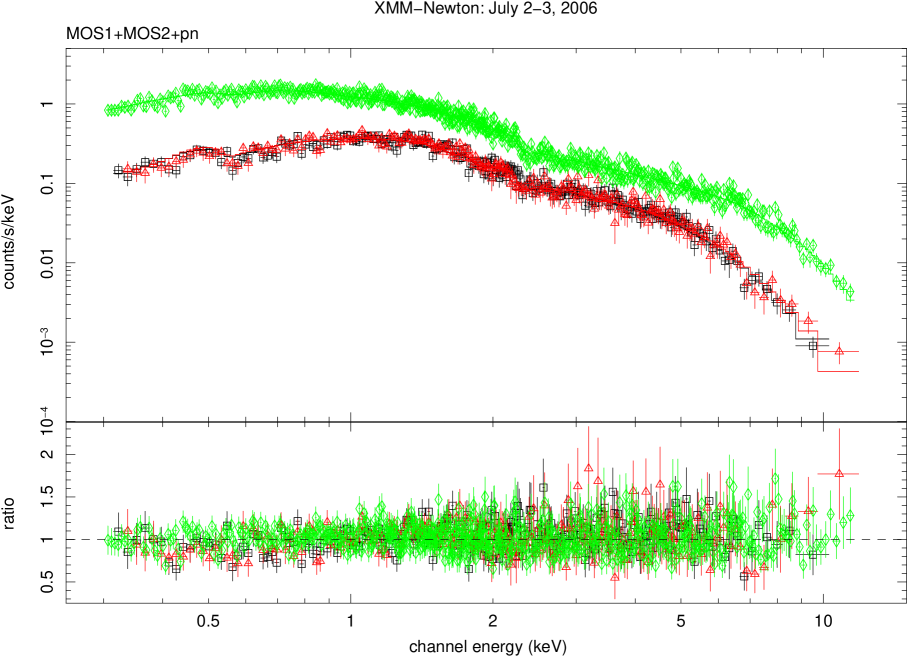
The three EPIC spectra fitted with the above model are displayed in the top panels of Fig. 4 (July 2–3) and Fig. 5 (December 18–19), while the bottom panels show the ratio between the data and the folded model. Assuming a flat cosmology with and , the luminosity of the source in the 2–10 keV rest frame energy range is in July, and in December.
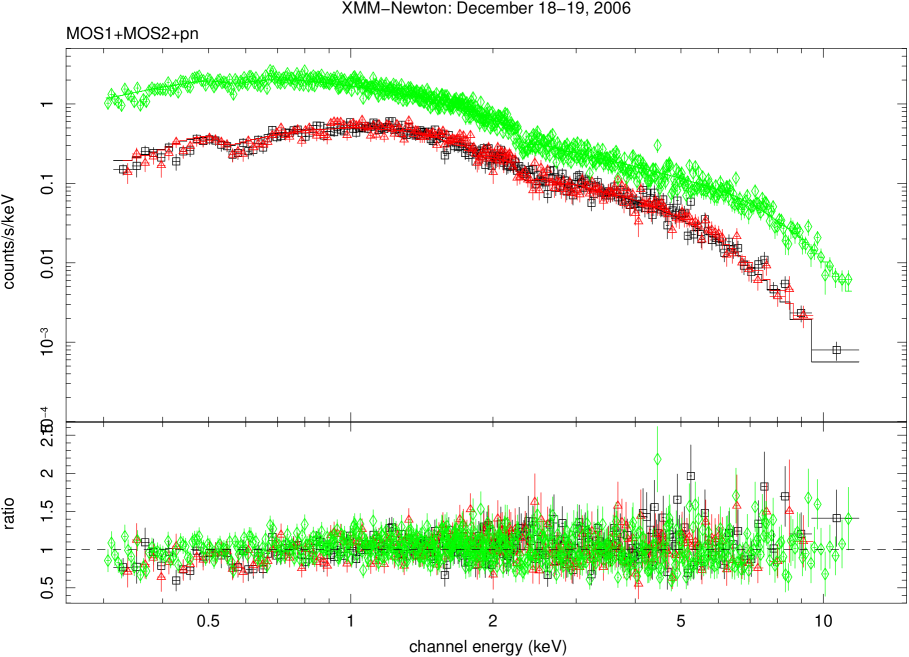
We notice that fitting previous X-ray spectra of 3C 454.3 often required extra absorption. Villata et al. (2006) reported a value of for the Chandra observation of May 2005, during the outburst phase333Notice that there was a misprint in the Villata et al. (2006) paper, because of which 1.34 became 13.4.. In that case the unabsorbed 1 keV flux density was times higher, but the power-law slope was very similar: . An even higher hydrogen column density was found by Giommi et al. (2006) when fitting the April–May 2005 data taken by the XRT instrument onboard Swift (–) and when reanalysing the BeppoSAX data of June 2000.
By looking at Fig. 5, we see that the model slightly overestimates the data at the low-energy end of the plot. This could be an indication that some extra absorption is needed also in this case. To check this point, we reanalysed the XMM-Newton data letting to vary freely, and obtained for July, and for December (see Table 2). The F-test probability in the two cases is and , respectively, indicating that from a statistical point of view the hypothesis of extra absorption is reasonable.
Another possibility is that the need of extra absorption hides the fact that the intrinsic spectrum of the source is not a power law, but presents some hardening in the soft X-ray range (Tavecchio et al., 2007). We investigated this hypothesis by fitting the XMM-Newton data with both a broken and a double power-law model with Galactic absorption, but the results do not imply any significant curvature of the source spectrum, and do not improve the goodness of fit. However, we cannot rule out that this scenario holds true in case of high X-ray states, like those observed in spring 2005, which seem to require more extra absorption.
On the other hand, the hypothesis that the amount of absorbing material is variable, even on relatively short time scales, is difficult to explain. It may be that extra absorption is indeed present, and it is as large as found by e.g. Villata et al. (2006), so that the intrinsic spectrum softens at low X-ray frequencies during faint X-ray states. We checked this point by fitting a double power-law model with to both the July and December data. In order to reduce the uncertainties, we also fixed one of the two spectral indices by fitting the data above 2 keV with a single power law, since absorption plays a negligible role at these energies. The results of the fits, which appear to be as good as in the power-law with free absorption case (the F-test probability now being and for the July and December epochs, respectively), are shown in Table 2.
3.2 Results from OM
Besides the X-ray detectors, XMM-Newton also carries a co-aligned 30 cm optical–UV telescope (Mason et al., 2001), the Optical Monitor (OM). The instrument is equipped with optical filters, ultraviolet UV, UV, UV filters, as well as optical and UV grisms. In both the July and December pointings, we chose to use a , , UV, UV sequence, as a compromise between a good spectral coverage and the limited duration of the observation. Exposure times for each filter are given in Cols. 5 and 8 of Table 3 for the July and December observations, respectively.
The OM data were reduced with the omichain task of SAS version 7.0, and the results were analysed with omsource. Source magnitudes are reported in Cols. 6 and 9 of Table 3. The error on the source magnitude also takes into account the dispersion of the results obtained by varying the parameters of the aperture photometry, in particular the location and size of the regions from which the background is extracted.
We noticed that the and magnitudes of the brightest stars in the field are in fair agreement with the ground-based calibrations in the band by Angione (1971) and in the band by Raiteri et al. (1998), which we have adopted for the WEBT data (see Sect. 2). The UV magnitudes of Stars 1 and 4 in the Raiteri et al. (1998) notation are and , respectively. In the UV frames only the source is measurable.
We derived the Galactic extinction (mag) in the various bands (Col. 2 of Table 3) by adopting the -band value of Schlegel et al. (1998) and then applying the equations by Cardelli et al. (1989). Extinction in the UV band is almost 1 mag; had we adopted the most recent prescriptions by Fitzpatrick (1999), we would have obtained a value which is only lower.
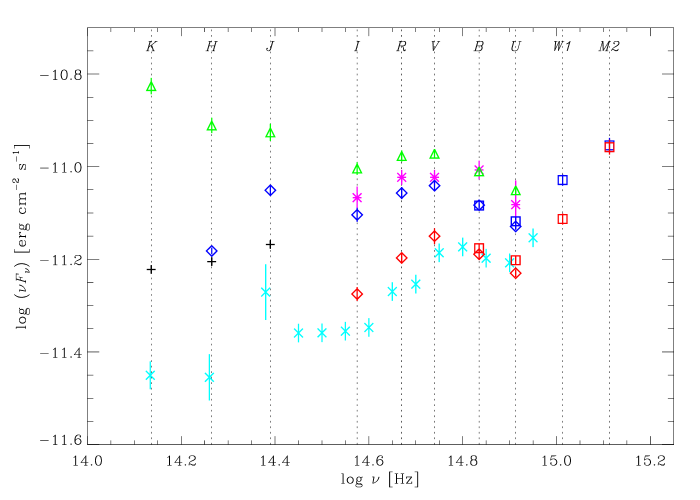
The transformation of the de-reddened magnitudes into flux densities was obtained by using the method based on the Vega flux scale444See http://xmm.esac.esa.int/sas/7.0.0/watchout/ Evergreen_tips_and_tricks/uvflux.shtml: the adopted Vega magnitudes and flux densities are reported in Cols. 3 and 4 of Table 3, respectively. The derived 3C 454.3 flux densities corresponding to the July and December pointings are shown in Cols. 7 and 10 of Table 3, and plotted as blue and red squares in Fig. 6, respectively.
| July 2–3 | Dec. 18–19 | ||||||||
| Filter | Extinction | Vega | Vega | 3C 454.3 | 3C 454.3 | 3C 454.3 | 3C 454.3 | ||
| [mag] | [mag] | [] | [s] | [mag] | [mJy] | [s] | [mag] | [mJy] | |
| 0.462 | 0.030 | 6.40 | 2900 | 16.82 0.01 | 1.205 0.011 | 1402 | 17.05 0.02 | 0.975 0.018 | |
| 0.539 | 0.025 | 3.20 | 2901 | 16.03 0.02 | 0.931 0.017 | 1401 | 16.24 0.02 | 0.767 0.014 | |
| 0.648 | 0.025 | 3.68 | 4499 | 15.82 0.03 | 0.908 0.025 | 3001 | 16.03 0.03 | 0.748 0.021 | |
| 0.980 | 0.025 | 4.33 | 4600 | 15.89 0.04 | 0.857 0.032 | 7520a | 15.90 0.04 | 0.849 0.031 | |
| a Three subsequent exposures of 3100, 3099, and 1321 s. | |||||||||
This figure also shows ground-based optical and near-infrared flux densities from this work as well as from the literature (see description below); all the plotted values have been obtained by correcting for the Galactic extinction, using the same method we used for the OM data. In order to convert de-reddened magnitudes into flux densities, we adopted the zero-mag fluxes by Bessell et al. (1998).
Blue and red diamonds in Fig. 6 correspond to the data acquired by the NOT during the July and December XMM-Newton pointings, respectively. As we can see from the figure, the ground-based optical flux densities agree fairly well with the OM ones in the overlapping frequency range. Flux densities in the bands from observations performed at Campo Imperatore simultaneously to the July pointing are also displayed (blue diamonds).
In Fig. 6, the above two near-infrared–ultraviolet SEDs are compared to previous faint-state SEDs. One SED (green triangles) was obtained by Villata et al. (2006) from near-infrared and optical observations by the WEBT in late September 2005, just after the end of the big outburst. The faintest-state SED (cyan crosses) was derived from Neugebauer et al. (1979), who observed this source with the 5 m Hale Telescope at Palomar Mountain; the optical data were taken in January 1973, while the near-infrared ones in October 1976. Further near-infrared data points (black plus signs) were derived from the August 1980 observations of Allen et al. (1982). Finally, the pink asterisks refer to data acquired in December 1986 by Smith et al. (1988).
By looking at Fig. 6 we notice that:
-
•
all the optical SEDs have a bump shape, with peak in the – frequency range;
-
•
the OM data presented in this paper confirm and extend further in frequency the rise of the SED in the ultraviolet that was present in the data of Neugebauer et al. (1979);
-
•
there is also an upturn from the to the band;
-
•
going towards lower frequencies, the behaviour of the brightest-state SED is different from that of the lower-state ones, since in the former the SED rise continues, while in all the latter the values in the band are lower than in the one. The difference between the and values is greater in the July 2006 SED than in the Allen et al. (1982) one, while in the case of Neugebauer et al. (1979) large uncertainties affect the data.
The bump peaking around the and bands likely corresponds to the little blue bump observed in quasars between and 4000 Å in the rest frame. This is due to the contribution of many emission lines produced in the broad line region (BLR), in particular the numerous Fe ii and the Mg ii lines, and Balmer continuum (Wills et al., 1985). Since the 3C 454.3 redshift is , Fe ii lines would mostly contribute to the observed spectrum around the band, while the flux in the band would be enhanced by the Mg ii line and Balmer continuum contributions. In the same way, the flux excess in correspondence of the band is likely due to a prominent broad H emission line. This bump is more evident when the beamed synchrotron radiation from the jet is fainter. The lowest-flux SEDs in Fig. 6 (January 1973 and December 2006) show states where the BLR component probably dominates the source emission. In contrast, the steep near-infrared part of the September 2005 SED suggests that in this epoch the synchrotron component was giving a higher contribution, and the BLR component, though still recognizable, begins to be diluted by the synchrotron one.
On the other hand, the rise of the SEDs in the ultraviolet is likely the signature of the big blue bump observed in many active galactic nuclei, which is commonly interpreted as thermal emission from the accretion disc (e.g. Laor, 1990). Evidences of this thermal component have been found in other quasar-type blazars, such as 3C 273 (Smith et al., 1993; von Montigny et al., 1997; Grandi & Palumbo, 2004; Türler et al., 2006), 3C 279 (Pian et al., 1999), and 3C 345 (Bregman et al., 1986). Indeed, by separating the polarized (synchrotron) from the unpolarized (thermal) component in individual quasar IR–UV spectra, Wills (1991) showed that this latter is consistent with the SEDs observed in luminous radio-quiet and lobe-dominated quasars. In the case of the BL Lacertae object AO 0235+164, a UV–soft-X-ray bump is recognizable in several SEDs, but whether this component is thermal radiation from the disc or rather another synchrotron component from the jet is not clear yet (Raiteri et al., 2005, 2006a, 2006b).
The fact that the source flux appears to be constant in the UV band, which is less affected by the synchrotron contribution, suggests that the big blue bump is a rather non-variable component, at least on a few-month time scale.
The presence of these non-jet components, which mostly affect the blue part of the spectrum, allows us to understand why the variability amplitude in the near-IR and optical bands increases with wavelength (i.e. the redder-when-brighter behaviour), as noticed in Sect. 2. Indeed, when the jet emission decreases, the non-jet contribution sustains the source flux more in the blue than in the red.
4 Broad-band spectral energy distribution
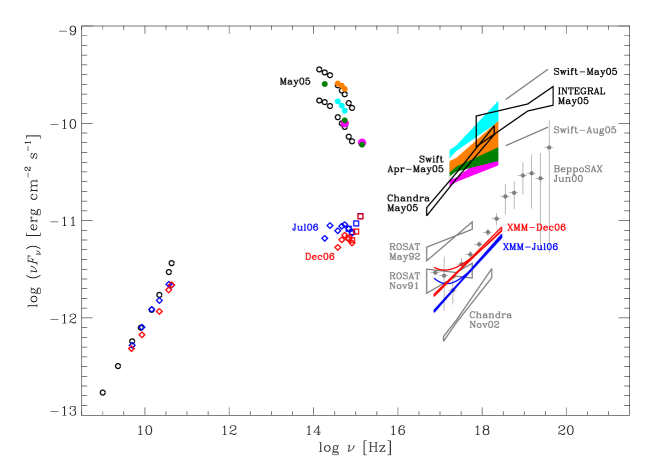
The broad-band SED of 3C 454.3 is shown in Fig. 7. The near-IR-to-UV SEDs corresponding to the XMM-Newton pointings of July and December 2006, which were displayed in Fig. 6 and discussed in the previous section, are now complemented by the X-ray spectra presented in Sect. 3.1 (the results of both the power-law with Galactic absorption and double power-law with fixed extra absorption models are shown) and by radio data from 5 to 43 GHz that were taken at the same time or within 3 days from the XMM-Newton observations. The comparison between the UV and X-ray data clearly shows the UV excess. As discussed in the previous section, this excess is the signature of the big blue bump, which is most likely due to thermal emission from the accretion disc. Moreover, fitting the X-ray data with a double power-law with fixed extra absorption model produces also a soft-X-ray excess, which would indicate a possible contribution from the high-frequency tail of the big blue bump.
We notice that, while the radio-to-optical state was fainter in December than in July 2006, in the X-ray domain it was the opposite. However, a linear fit to the high-frequency ( GHz) radio data in Fig. 7 reveals that this part of the radio spectrum was harder in December (, with ) than in July (), suggesting a larger flux in the mm bands, whose photons are inverse-Comptonized to the X-ray frequencies we observe with XMM-Newton.
In the same figure we show the results of power-law model fits to X-ray spectra from observations by ROSAT in 1991 and 1992 (Sambruna, 1997; Prieto, 1996), BeppoSAX in 2000555The spectrum shown in the figure, corresponding to observations performed in June 2000, was derived from the ASI Science Data Center (http://www.asdc.asi.it/)., Chandra in 2002 (Marshall et al., 2005), and from observations performed near the 2005 outburst peak by Chandra (Villata et al., 2006), INTEGRAL (Pian et al., 2006), and Swift (Giommi et al., 2006).
The open circles show the radio brightness levels and the near-IR–optical variability range observed by the WEBT members in May 2005, during the INTEGRAL and Chandra pointings, and reported by Villata et al. (2006). Lower-energy data simultaneous to the 0.7–10 keV observations of the XRT instrument onboard Swift were taken by the UVOT instrument onboard the satellite (optical–UV) and by the REM telescope (near-IR–optical). They are plotted in the figure distinguishing the four epochs presented by Giommi et al. (2006): April 24 (pink symbols), May 11 (cyan), May 17 (dark green), and May 19 (orange). An indication of the hard-X-ray flux (between 15 and 150 keV) registered by the BAT instrument onboard Swift in May and August 2005 is also reported. The X-ray spectra from Swift (in particular that of May 19) are less hard than the Chandra spectrum acquired on May 19–20; this may depend, at least in part, on the 1.7–1.8 times higher value adopted by Giommi et al. (2006) with respect to that used by Villata et al. (2006).
The data taken in the Swift epochs May 11 and May 19, 2005 reveal the same “crossing” trend that we have already noticed for the July and December 2006 XMM-Newton epochs, i.e. a higher optical flux corresponding to a lower X-ray flux. However, this does not imply any direct relation between the optical and X-ray emissions, since they come from different regions and, as discussed above for the XMM-Newton epochs, the X-ray emission is most likely correlated to the mm one.
We notice that the optical–UV data taken during the outburst phase do not show any evidence of the blue–UV bumps observed during faint states, as they are overwhelmed by the beamed synchrotron radiation.
5 Conclusions
The unprecedented outburst of 3C 454.3 in 2005, affecting the source emission from the near-IR to the X-ray frequencies, was first followed by a huge millimetric and then by a long-lasting, extraordinary, high-frequency radio outburst. After that, the blazar underwent a multifrequency faint-state period from mid 2006 to April 2007, which was characterized by moderate variability in the near-infrared and optical bands. The variability amplitude was larger at longer wavelengths, consistently with the results of e.g. Bregman et al. (1986) for the quasar-type blazar 3C 345, whereas the general feature of BL Lac-type blazars is to show larger-amplitude flux changes at higher frequencies (e.g. Villata et al., 2004; Papadakis et al., 2007; Wu et al., 2007).
After the radio peak of late February 2006, at the higher radio frequencies we observed the fast outburst dimming phase, with the transition from the inverted radio spectrum, which characterised the long-lasting outburst, to the usual, softer one. According to Villata et al. (2007), the fast drop at all the higher radio frequencies and the absence of any flux increase at the lower ones suggest that the event that perturbed the inner radio emitting region has propagated outwards, in a jet region that is misaligned with respect to the line of sight. Hence, we see now only the “quiescent” emission of the source, i.e. a higher flux density at larger wavelengths, since this radiation comes from outer and more transparent emitting regions.
The faint state allowed us to recognize important spectral features, which are usually hidden by the beamed synchrotron emission from the jet. The first is the little blue bump in the optical band, peaking around the and bands, and likely due to the contribution of Fe ii and Mg ii emission lines and Balmer continuum produced in the BLR (Wills et al., 1985). Another minor bump seems to peak in the band, and this is most likely the signature of a broad and prominent H line.
But the major feature, which was clearly revealed by the data acquired by the Optical Monitor onboard XMM-Newton, is the spectral break in the band, with the transition from a soft optical spectrum to a hard UV one. This suggests the presence of a big UV bump most likely due to thermal emission from the accretion disc, as already recognized in few other quasar-type blazars, but not yet in 3C 454.3.
These BLR and thermal emission components explain why the optical and near-infrared light curves show an increasing variability amplitude when going from the higher to the lower frequencies, as well as the redder-when-brighter behaviour noticed by Villata et al. (2006). Indeed, when the jet emission decreases, the blue part of the optical spectrum cannot go below a certain level because of the non-jet contributions.
A power-law model with Galactic photoelectric absorption gives a fair fit to the XMM-Newton X-ray spectra. Some amount of extra absorption (% for the July observation and % for the December one) yields better results from a statistical point of view. Since the need of even much higher values of extra absorption was claimed by various authors when analysing past X-ray data, this might suggest the presence of absorbing material with variable column density, as observed for AO 0235+164 (Wolfe et al., 1982) and suggested for BL Lacertae (Ravasio et al., 2003).
The possibility that the requirement of extra absorption actually hides a hardening of the intrinsic soft-X-ray spectrum is not supported by our results. Indeed, applying curved models with Galactic absorption to the XMM-Newton data does not produce significant curvatures and does not improve the goodness of fit with respect to the single power-law case. However, bright X-ray states, which seem to require larger values of extra absorption, might be charactized by intrinsic curved spectra with hardening in the soft X-ray range.
An alternative explanation is that extra absorption, possibly in the quasar environment, does exist, and it is not variable. In this case, the fact that X-ray data acquired during faint X-ray states seem to require a lower amount of absorption could be due to a spectral softening of the lower-energy X-ray spectrum. This softening might be due to the contribution of the high-frequency tail of the big blue bump.
At present, it is not possible to discriminate among the various models of X-ray spectral fitting. Further X-ray observations will hopefully help to clarify this matter.
Acknowledgements.
We thank the referee, Beverley J. Wills, for useful comments and suggestions. This work is partly based on observations obtained with XMM-Newton, an ESA science mission with instruments and contributions directly funded by ESA Member States and NASA, and on observations made with the Nordic Optical Telescope, operated on the island of La Palma jointly by Denmark, Finland, Iceland, Norway, and Sweden, in the Spanish Observatorio del Roque de los Muchachos of the Instituto de Astrofisica de Canarias. This research has made use of data from the University of Michigan Radio Astronomy Observatory, which is supported by the National Science Foundation and by funds from the University of Michigan. The Torino team acknowledges financial support by the Italian Space Agency through contract ASI/INAF I/023/05/0. St. Petersburg team was supported by the Russian Fund of Basic Research, grant 05-02-17562. The Metsähovi team acknowledges the support from the Academy of Finland. JHF’s work is partially supported by the National Natural Science Foundation of China (10573005,10633010). YYK is a research fellow of the Alexander von Humboldt Foundation. RATAN–600 observations were partly supported by the Russian Foundation for Basic Research (project 05-02-17377). ACG’s work is supported by NNSF of China grant no. 10533050.References
- Allen et al. (1982) Allen, D. A., Ward, M. J., & Hyland, A. R. 1982, MNRAS, 199, 969
- Angione (1971) Angione, R. J. 1971, AJ, 76, 412
- Bessell et al. (1998) Bessell, M. S., Castelli, F., & Plez, B. 1998, A&A, 333, 231
- Bregman et al. (1986) Bregman, J. N., Glassgold, A. E., Huggins, P. J., et al. 1986, ApJ, 301, 708
- Cardelli et al. (1989) Cardelli, J. A., Clayton, G. C., & Mathis, J. S. 1989, ApJ, 345, 245
- Fitzpatrick (1999) Fitzpatrick, E. L. 1999, PASP, 111, 63
- Giommi et al. (2006) Giommi, P., Blustin, A. J., Capalbi, M., et al. 2006, A&A, 456, 911
- González-Pérez et al. (2001) González-Pérez, J. N., Kidger, M. R., & Martín-Luis, F. 2001, AJ, 122, 2055
- Grandi & Palumbo (2004) Grandi, P. & Palumbo, G. G. C. 2004, Science, 306, 998
- Kalberla et al. (2005) Kalberla, P. M. W., Burton, W. B., Hartmann, D., et al. 2005, A&A, 440, 775
- Laor (1990) Laor, A. 1990, MNRAS, 246, 369
- Marshall et al. (2005) Marshall, H. L., Schwartz, D. A., Lovell, J. E. J., et al. 2005, ApJS, 156, 13
- Mason et al. (2001) Mason, K. O., Breeveld, A., Much, R., et al. 2001, A&A, 365, L36
- Neugebauer et al. (1979) Neugebauer, G., Oke, J. B., Becklin, E. E., & Matthews, K. 1979, ApJ, 230, 79
- Papadakis et al. (2007) Papadakis, I. E., Villata, M., & Raiteri, C. M. 2007, A&A, 470, 857
- Pian et al. (2006) Pian, E., Foschini, L., Beckmann, V., et al. 2006, A&A, 449, L21
- Pian et al. (1999) Pian, E., Urry, C. M., Maraschi, L., et al. 1999, ApJ, 521, 112
- Prieto (1996) Prieto, M. A. 1996, MNRAS, 282, 421
- Raiteri et al. (2005) Raiteri, C. M., Villata, M., Ibrahimov, M. A., et al. 2005, A&A, 438, 39
- Raiteri et al. (2006a) Raiteri, C. M., Villata, M., Kadler, M., et al. 2006a, A&A, 459, 731
- Raiteri et al. (2006b) Raiteri, C. M., Villata, M., Kadler, M., et al. 2006b, A&A, 452, 845
- Raiteri et al. (1998) Raiteri, C. M., Villata, M., Lanteri, L., Cavallone, M., & Sobrito, G. 1998, A&AS, 130, 495
- Ravasio et al. (2003) Ravasio, M., Tagliaferri, G., Ghisellini, G., et al. 2003, A&A, 408, 479
- Sambruna (1997) Sambruna, R. M. 1997, ApJ, 487, 536
- Schlegel et al. (1998) Schlegel, D. J., Finkbeiner, D. P., & Davis, M. 1998, ApJ, 500, 525
- Smith et al. (1988) Smith, P. S., Elston, R., Berriman, G., Allen, R. G., & Balonek, T. J. 1988, ApJ, 326, L39
- Smith et al. (1993) Smith, P. S., Schmidt, G. D., & Allen, R. G. 1993, ApJ, 409, 604
- Strüder et al. (2001) Strüder, L., Briel, U., Dennerl, K., et al. 2001, A&A, 365, L18
- Tavecchio et al. (2007) Tavecchio, F., Maraschi, L., Ghisellini, G., et al. 2007, ApJ, 665, 980
- Türler et al. (2006) Türler, M., Chernyakova, M., Courvoisier, T. J.-L., et al. 2006, A&A, 451, L1
- Turner et al. (2001) Turner, M. J. L., Abbey, A., Arnaud, M., et al. 2001, A&A, 365, L27
- Villata et al. (2007) Villata, M., Raiteri, C. M., Aller, M. F., et al. 2007, A&A, 464, L5
- Villata et al. (2006) Villata, M., Raiteri, C. M., Balonek, T. J., et al. 2006, A&A, 453, 817
- Villata et al. (2004) Villata, M., Raiteri, C. M., Kurtanidze, O. M., et al. 2004, A&A, 421, 103
- Villata et al. (2002) Villata, M., Raiteri, C. M., Kurtanidze, O. M., et al. 2002, A&A, 390, 407
- von Montigny et al. (1997) von Montigny, C., Aller, H., Aller, M., et al. 1997, ApJ, 483, 161
- Wills (1991) Wills, B. J. 1991, in Variability of Active Galactic Nuclei, ed. H. R. Miller & P. J. Wiita, 87–101
- Wills et al. (1985) Wills, B. J., Netzer, H., & Wills, D. 1985, ApJ, 288, 94
- Wilms et al. (2000) Wilms, J., Allen, A., & McCray, R. 2000, ApJ, 542, 914
- Wolfe et al. (1982) Wolfe, A. M., Briggs, F. H., & Davis, M. M. 1982, ApJ, 259, 495
- Wu et al. (2007) Wu, J., Zhou, X., Ma, J., et al. 2007, AJ, 133, 1599