Mid-Infrared interferometry of dust around massive evolved stars
Abstract
We report long-baseline interferometric measurements of circumstellar dust around massive evolved stars with the MIDI instrument on the Very Large Telescope Interferometer and provide spectrally dispersed visibilities in the 8-13 µm wavelength band. We also present diffraction-limited observations at 10.7 µm on the Keck Telescope with baselines up to 8.7 m which explore larger scale structure. We have resolved the dust shells around the late type WC stars WR 106 and WR 95, and the enigmatic NaSt1 (formerly WR 122), suspected to have recently evolved from a Luminous Blue Variable (LBV) stage. For AG Car, the protoypical LBV in our sample, we marginally resolve structure close to the star, distinct from the well-studied detached nebula. The dust shells around the two WC stars show fairly constant size in the 8-13 µm MIDI band, with gaussian half-widths of 25 to 40 mas, and the Keck observations reveal an additional extended structure around WR 106. The visibility profiles for NaSt1 obtained from two MIDI baselines indicate a compact source embedded in an extended structure. The compact dust we detect around NaSt1 and AG Car favors recent or ongoing dust formation.
Using the measured visibilities, we build spherically symmetric radiative transfer models of the WC dust shells which enable detailed comparison with existing SED-based models. Our results indicate that the inner radii of the shells are within a few tens of AU from the stars. In addition, our models favor grain size distributions with large ( 1 µm) dust grains. This proximity of the inner dust to the hot central star emphasises the difficulty faced by current theories in forming dust in the hostile environment around WR stars. Although we detect no direct evidence for binarity for these objects, dust production in a colliding-wind interface in a binary system is a feasible mechanism in WR systems under these conditions.
1 Introduction
The most massive stars (M☉) will likely pass through a Luminous Blue Variable (LBV) and Wolf-Rayet (WR) phase before ending their lives in a supernova explosion. LBVs and some WRs are known to show infrared excess associated with circumstellar dust. The LBV phase is short-lived and unstable with irregular mass ejections of to M☉ for each outburst (Humphreys & Davidson, 1994), resulting in circumstellar nebulae and associated dust. The dust in this phase is consistent with grains of differing compositions ranging over metallic, silicate and carbon-rich (Voors et al., 1999; Clark et al., 2003). The WR stage, characterised by massive winds (of the order ) is divided into two main phases (Smith, 1968), the WN phase with strong spectral lines of N and CNO-cycle products, and the later WC phase with strong lines of C and other He-burning products. Dust formation is associated with the WC phase, consistent with the over-abundance of C, and is notably absent in the WN phase (van der Hucht et al., 2001), although recent Spitzer observations (Barniske et al., 2006) may be the first indications to the contrary. Long term and detailed infrared photometry of WC stars (Williams et al., 1987, hereafter WvdHT), has led to considerable progress in understanding the nature of the dust and its formation. The favored mechanism for dust-formation in this stage is through wind-wind collision in a WR-OB binary system (Usov, 1991). For the episodic dust producers WR 140 and WR 137, photometric and spectrosocopic data (Williams et al., 1990, 2001) had already indicated binarity which has been confirmed by long-baseline interferometric observations for WR 140 (Monnier et al., 2004a). High resolution images in the near-IR using aperture- masking techniques with the Keck telescope provide direct evidence for binarity in the case of the constantly dusty, late-type WC stars WR 98a, WR 104 (Monnier et al., 1999; Tuthill et al., 1999), and more recently, the “cocoon stars” in the Quintuplet cluster (Tuthill et al., 2006). Monnier et al. (2007) present a strong case for binarity for all the dusty WRs in the Keck aperture-masking sample. However, whether all dusty late type WCs are binaries is an open question and dust formation in single WR stars has not been ruled out (Cherchneff et al., 2000).
In this paper, we present and interpret interferometric mid infrared observations of the late type WC stars WR 95 (catalog ) and WR 106 (catalog ), the suspected LBV-WR transition star NaSt1 (catalog ), and the LBV AG Car (catalog ). The main goals of this campaign were to resolve the sizes of the dust shells and characterize the physical distribution of dust. All the objects were observed with the MIDI instrument at the Very large Telescope Interferometer (VLTI) in the 8-13 µm wavelength range, typically with a baseline of 47 m. NaSt1 and WR 106 were also observed at 10.7 µm with a multi-aperture interferometric technique using individual segments of the Keck-I telescope mirror to get complementary data from baselines up to the 10 m diameter of the Keck mirror. In Sections 2 and 3, we describe the observations, data reduction and present the results. Section 4 details the dust models we have constructed and the comparison with existing models based on the spectral energy distribution. Section 5 summarizes these results and presents the conclusions.
2 Observations and Data Reduction
2.1 MIDI
Most targets were observed over four nights in 2004 July, except for AG Car which was allocated one night in 2004 April (Table 1). NaSt1 was also observed on two nights in 2004 September. All observations were with the 47 m long UT2-UT3 baseline, except for the 2004 September observations of NaSt1 which used the 89 m UT2-UT4 baseline. The MIDI instrument (Leinert et al., 2003) on the VLTI combines the light from a given pair of 8.2 m telescopes (UTs) and produces spectrally dispersed fringes in the 8-13 µm band. A detailed description of the observing technique and data reduction can be found in Leinert et al. (2004). Here we limit ourselves to a brief summary.
The observing sequence starts with acquiring the target on each individual telescope with the 8.7 µm filter (1.4 µm wide) and attaining maximal overlap of the two images, while chopping the secondary at 2 Hz over 10″. The images are combined to produce the two complementary interferograms and dispersed through a prism with a resolution of 30. The delay lines are scanned to find and track the fringes and fringe visibilities are recorded while stepping the delay through 10 wavelengths (10 µm) in steps of 2 µm with a piezo-driven mirror. The scan rate is tuned to the timescale of instrumental and atmospheric fluctuations of delay and a typical measurement records 200 scans in about 5 minutes. After the fringe measurement, a photometric measurement is carried out by blocking the light from one and then the other telescope, while chopping the secondary mirror. No chopping is done during the fringe-tracking scans. The pointing is maintained by the Coude guiding with only tip-tilt correction; higher order AO was yet to be integrated into the system. A sensitivity better than 1 Jy is achieved for this mode of fringe measurement. Given that these observations were during the first regular semester after MIDI commisioning, the accuracy that we achieve for the visibility measurements is of the order of 10% and is mostly set by photometry, guiding (overlap of the two images) and fringe tracking errors which impose limits on the accuracy of calibration. We calculate the errors on the visibility as the standard deviation over the multiple calibrations for each measurement and conservatively quote the higher of this number or 10% of the visibility amplitude. The above is true for the absolute visibility amplitude errors; the relative errors are less and the slope of the visibility in the 8 to 13 µm band is accurate to 3%.
Standard calibrator stars of known diameter from the MIDI catalogue111 [HREF]http://www.eso.org/projects/vlti/instru/midi/midi_calib.txt were observed immediately before and after the target (Table 1). Given the relatively large systematic errors inherent in the visibility determination, we have also used calibrators from other programs within a span of 2-5 hours (depending on atmospheric conditions).
The visibility reduction method generally follows the now well-established algorithms for optical/IR interferometry (e.g., Coude Du Foresto et al. (1997) for fiber stellar interferometers: the basic principles apply for non-fiber systems like MIDI) and was carried out using custom software provided by the VLTI consortium written in the IDL language. The spectra are extracted with a typical binning of 4 pixels, with each pixel being 0.05 µm wide. The two complementary outputs of the combiner are differenced to remove the incoherent flux including overall variations in the contribution from the two telescopes. Next, the fringe power is estimated from the Fourier transform and the visibility amplitude222The usual estimator used in optical/infrared interferometry is the square of the visibility amplitude (V2) since this quantity can be corrected for detector noise bias. However the MIDI measurement error in the mode we used (“High-Sens”, with no simultaneous photometry) is dominated by calibration error, not detector noise., normalized by the photometric fluxes, is calculated. The visibility is then calibrated using the instrument visibility measured on the calibrator stars.
2.2 Keck
We carried out observations at 10.7 µm with the Keck-I telescope on two stars in our sample, WR 106 and NaSt1, in 2005 May (Table 2). These observations were carried out in a “segment-tilting” mode (Monnier et al., 2004b; Weiner et al., 2006) to achieve close to diffraction limited resolution. Imaging at 10 µm with the full pupil has, in practice, failed to reliably yield diffraction limited images. This is in part attributable to the “seeing spike” problem, where the visibilities at shorter baselines are difficult to calibrate in the presence of changes in the seeing between the target and calibrator. The results shown here demonstrate the utility of this new method in alleviating some of these problems. In this technique, custom software is used to reconfigure the segmented primary mirror so as to allow selected groups of segments to focus on the detector (the Long-Wavelength Spectrograph camera). Each group (four in our case) of 6 segments is chosen so as to form a non-redundant sparse-aperture array. The 1.8 m hexagonal segments are individually phased up so that each group focuses on a separate spot on the detector. Thus in a given frame, 24 out of 36 segments are used in these four “Fizeau arrays” (the rest of the segments are pointed away from the detector). This arrangement measures 15 baselines ranging from about 2 m to 9 m and 20 closure phases. Each frame is of the order of 10 ms and we co-add 9 frames, giving an effective exposure of 90 ms. Chopping is done at a 5 Hz rate. Calibrators are observed before and after the targets and each target is visited at least twice during a night. The analysis of the data closely follows the aperture-masking analysis described in detail in numerous publications (e.g., Tuthill et al., 2000). These measurements complement the long-baseline VLTI data by adding in visibilities at shorter baselines up to 9 m.
3 Results
3.1 The WC stars
The two WC type stars in our sample are WR 95 and WR 106. They are both classified as late type (WC 9) and are known to be persistent dust producers from IR excess detected over long-term photometry (Williams, 1995). The photometric data do not have any periodicity and neither do the spectra indicate any clear signs of binarity. We obtained two MIDI visibility measurements on WR 95 on consecutive nights in July 2004. Though the projected baseline and position angle differ slightly between these two measurements, the visibility values were remarkably similar (Figure 1, broken lines). Though this might indicate a small degree of asymmetry, the accuracy of these measurements are not high enough to justify this interpretation. Instead we have chosen the average of the two sets to represent the spectrally dispersed visibility (Figure 1, solid line). As can be seen in Figure 1, we clearly resolve the WR 95 dust shell with visibility values ranging from 0.2 to 0.6 over the 8-13 µm band. In the absence of detailed knowledge of the source geometry we have assumed a gaussian profile and the resulting FWHM in milliarcseconds (versus wavelength) is shown by the dotted line. WR 95 was not observed with the Keck segment-tilting method since it was below the sensitivity limit.
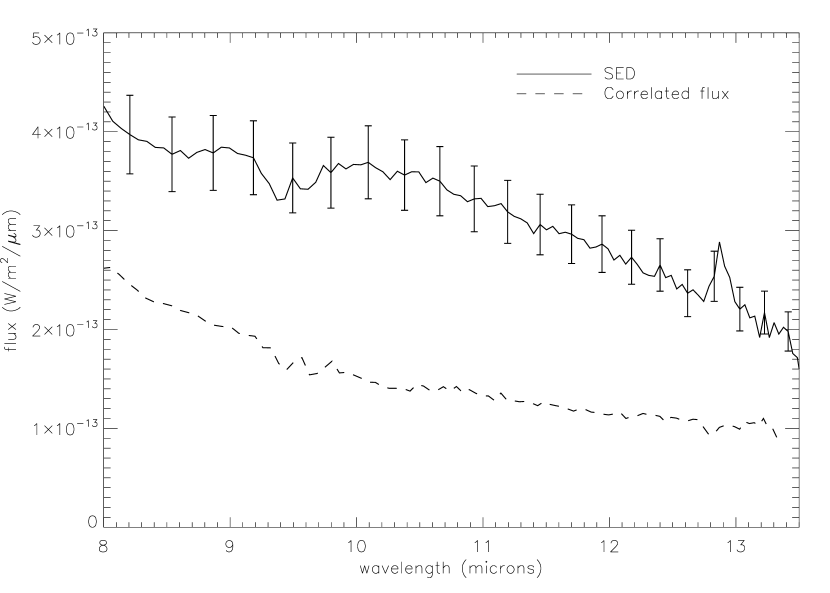
Figure 2 shows the MIDI results for WR 106. Though we obtained two measurements in July 2004 (see Table 1), poor seeing conditions resulted in variations in fringe tracking and calibration between the two observations. In the absence of a clear criterion to select one data set over the other, we average the two and the resulting larger error bars are shown in the figure. However, this target is well-resolved and meaningful conclusions can be drawn even from the less-than-optimum data. The visibility variation with wavelength is similar to that for WR 95.
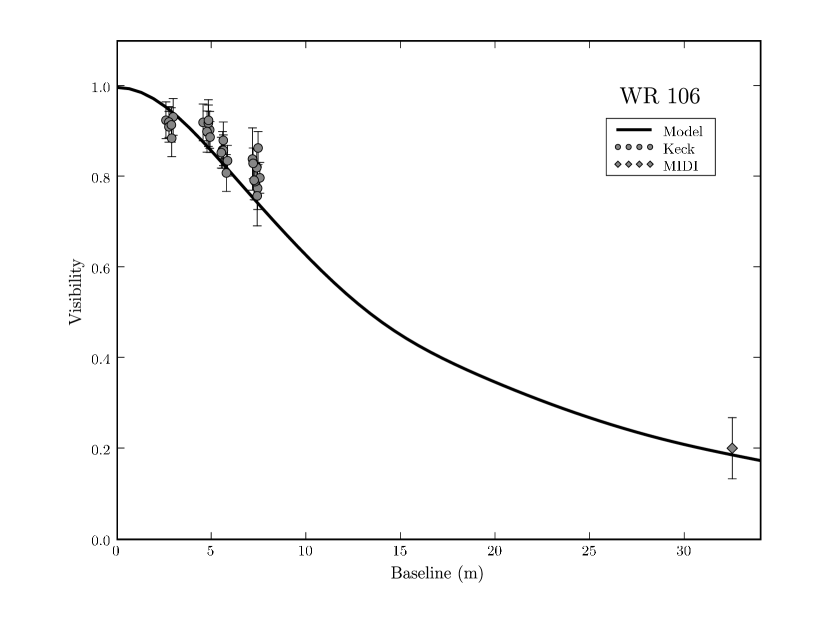
WR 106 was resolved by the Keck single aperture (Table 2). This was surprising in that, given the visibility values measured by the VLTI, one would have expected an unresolved source at the comparatively short baselines offered by the Keck mirror. This indicates that there is an extended component in the dust distribution which was over-resolved and hence failed to show up in the VLTI observations. We present these results in Section 4 where we discuss some simple models.
In Table 3, we list the angular sizes (gaussian FWHM) measured with MIDI at 10.5 µm and the corresponding linear sizes of the objects, assuming distances from the literature (see table footnote). The parameters directly constrained by this data set are the size of the dust shells and its variation with wavelength. The radius at which the dust grains start to condense is a much-debated and crucial topic in the theory of dust-formation around WR stars (Zubko, 1998; Crowther, 2003). The major difficulty has been that the equilibrium temperatures at the radii predicted by the SED-based models are often above the sublimation temperature for carbon dust. Dust formation in the shock interface of a colliding-wind system has found some favor in this context. A recent summary of results from a long-term campaign of aperture-masking interferometry at the Keck (Monnier et al., 2007) provides the near-IR sizes for a number of WR stars, including those in our sample. The authors point to a tight correlation between the the surface-brightness in the 1.5 - 3.0 µm band and the sizes (gaussian FWHM) of the objects in their sample to argue for a common underlying dust-production mechanism. Our direct measurement of the mid-IR size-scale for these objects is an important addition to this debate. From our gaussian FWHM curves, it is clear that the size of the emitting region is more or less invariant in the 8 - 13 µm band. This could indicate that the emission is dominated by an inner edge or ring of material. In fact the sizes for WR 95 at the shorter wavelengths (1.6 and 2.2 µm) reported in Monnier et al. (2007) are quite similar to our values. For WR 106, the mid-IR size is larger, as expected from the presence of the extension seen in the Keck measurement. In section 4, we present radiative transfer models for the dust shells based on our measurements and derive inner edge radii which we compare with values from SED-based models.
3.2 NaSt1
NaSt1 has a checkered history of classification. It was initially typed as a late-type WN star, WR 122 (van der Hucht et al., 1981), but subsequently this classification has been questioned. The most recent study (Crowther & Smith, 1999) has resulted in this star not being considered a Wolf-Rayet any longer. Crowther and Smith find the chemical composition of the optical nebulosity sorrounding the star to be similar in many respects to an LBV, like Carina, and conjecture that the obscured central star could be an early type WN, presumably just leaving the LBV phase. The uncertainty in classification is in part due to the rarity of these very massive stars, especially one caught in transition. As such our measurement of the extent of the close-in dust and its variation with wavelength is of significance. The source is unresolved by MIDI in single dish imaging mode and the flux measured within the 300 mas beam is similar to the the value quoted in Smith and Houck (2001, Figure 4 in their paper) from a bigger beam, indicating that all the mid-IR emission originates from a compact object. Another notable feature is the absence (as in the WCs) of any silicate feature in the visibility profile (Figure 3) or the MIDI spectrum (Figure 4). Although this does not rule out the presence of silicate dust, it attests to the fact that there are no structures with silicate emission at the MIDI resolution scale. This is in agreement with the finding of Crowther & Smith (1999) that the nebula is highly enriched in CNO processed material.
NaSt1 was not resolved with the Keck single aperture. In our experience, the segment-tilting method is capable of resolving sizes down to 40-50 mas at the 3-sigma level. At 10.7 µm, this is approximately a factor of 6 better than the formal diffraction limit (1.22 /D) for the 10 m aperture. A more rigorous analysis for the resolution limit for aperture-masking observations at Keck (the near-infrared analogue of segment-tilting) estimates it to be 4 times better than the diffraction limit (Monnier et al., 2007). We estimate an upper limit of 50 mas for NaSt1 from the Keck experiment.
NaSt1 was observed with MIDI at both the UT2-UT3 (projected baseline: 44.0 m, PA: 42°) and the longer UT2-UT4 (projected baseline: 63.0 m, PA: 78°). Figure 3 shows the visibility values and corresponding gaussian sizes for NaSt1. The visibility varies with wavelength, decreasing towards the red end of the spectrum. This typically indicates cooler material further away from the star and is in contrast to the behavior we see in the WC stars. At least part of the dust around LBVs could be swept from the ISM and/or formed in a cooler environment in the episodic ejecta from the LBV phase and could lead to a less-defined inner edge and more spread in the dust temperature. The visibility on the PA 42° shorter baseline is very similar to that on the longer one, and if we intrepret this directly as a size, may indicate an elongation in this direction. The optical image of NaSt1 (Crowther & Smith, 1999) in the NII 6583 line shows an elliptical nebula with the major axis at a PA of 30°and an aspect ratio of 0.6, though the size scale ( 8 arcsec) is several orders of magnitude larger than the milliarcsecond scales we measure.
However, it must be stressed that the visibility curves from the two different baselines are almost identical and the probability of obtaining the same profile for a spatially complex object (even if as simple as an ellipse) by pure chance is very low. A possible alternative interpretation is that, following the suggestion of Crowther & Smith (1999), the mid-IR source could be split into two components: a compact, unresolved part, with a correlated flux of about 5 Jy from 8 to 13 µm that corresponds to the central source and perhaps some hot dust in its immediate surrounding, and a detached Car-like nebula, fully resolved by the interferometer. The extension of this nebula may be of the same order as that of the region contributing the [NeII] 12.8 µm line which is seen in the single dish spectrum, but not in the correlated (i.e., arising in the unresolved core) flux (Figure 4). However, the upper limit on the size of this component would be limited to 50-60 mas at most; anything bigger would have been resolved by the Keck observations. Given the 10% error on the MIDI visibilities, this could still be over-resolved, though marginally, even at the shorter 44 m baseline. The size of the compact component is possibly less than 5 mas or so, given that higher values would start to affect the relative slope of the visibilities between the two baselines. Qualitatively, this hypothesis offers a natural explanation of the measurements: the central source is unresolved and the extension overresolved whatever the baseline length (44 m or 63 m). However, the tight constraints on the extended component weaken the case. Clearly, more observations are needed to clarify the picture. A very hot source (T100,000 K) is required for the fitting the object’s SED by Crowther & Smith (1999), and the 5 Jy (1.5 10-13 Wmm-1) correlated flux we measure at 10 m is not consistent with this. A constant correlated flux from 8 to 13m (Figure 4) can hardly be attributed to a source at a single temperature (say, 2000 K) either. In order to decompose the SED into multiple sources at different temperatures it is important to study this object in the near-IR using the AMBER instrument at the VLTI to resolve the K band continuum and the very strong HeI 2.058 µm line that may originate in the close vicinity of the star (Crowther & Smith, 1999, their Figure 6).
At a distance of 2 kpc, the maximum linear size from the gaussian model is 40 AU and with a two-component model it is 100 AU (for comparison, the average extension of the optical nebula is 13600 AU at 2 kpc from Crowther & Smith). If we take the same characteristic expansion velocity as Crowther & Smith (15kms-1) then the dynamical age of the dusty nebula at 100 AU from the source is about 30 yr. This shortens to a couple of years if instead we assume dust grains forming in the wind at a velocity of 100 -300 kms-1(Zubko, 1998; Crowther & Smith, 1999). Hence the dust that we resolve points to very recent or ongoing dust formation close to the star which has implications for its current poorly-known evolutionary state.
3.3 AG Car
AG Car is one of the best studied LBVs and a prototype of its class. AG Car has been extensively observed from UV to radio wavelengths with photometric, spectroscopic, and polarimetric techniques over several decades (Humphreys et al., 1989), which locates it in the H-R diagram very close to the Humphreys-Davidson limit, an empirical luminosity boundary for evolved massive stars (Humphreys & Davidson, 1979).
AG Car is surrounded by a bright extended bipolar nebula, 30” 40” in size (Nota et al., 1992), perhaps from a massive erruptive event 104 years ago (Lamers et al., 2001). The kinematics of the bipolar nebula is consistent with a two-lobe polar ejection viewed nearly from the equator (Nota et al., 1992). Spectroscopic analysis by Groh et al. (2006) supports the bi-polar geometry and shows the 50-100 R☉ supergiant central star to be rotating close to its break-up velocity. The high rotational velocity after the huge LBV outburst may be understood if the original explosion expelled the mass and momentum preferentially toward the poles. The wind at smaller latitude may not have formed or may have launched material with velocities lower than the escape velocity which fell back onto the star. The nebula contains a large amount of dust (Voors et al., 2000, 0.2 M☉), which implies a huge mass loss rate during the eruption (at least 8-15 M☉).
Our measurements are set in context by two studies in particular; Voors et al. (2000) and Nota et al. (2002). The images in Voors et al. (2000) obtained with the 10 µm TIMMI camera on the 3.6 m NTT at La Silla reveal a central peak and a detached nebula with a radius of 10″. Their SED analysis reveals a complex situation: the dust is dominantly oxygen-rich but Polycyclic Aromatic Hydrocarbon (PAH) features are observed at 3.3, 7.7, 8.6 and 11.3 µm revealing some amount of carbon dust. Moreover, a population of very large grains ( 10µm) is necessary to explain the flux levels at long wavelengths whereas a population of small warm grains is invoked to explain the flux between 5 and 20µm.
There is evidence for CO J = 10 and 21 emission associated with AG Car (Nota et al., 2002) and the authors conclude that the unresolved CO emission must arise close to the star in a high density warm region and not in the detached nebulae resolved in optical emission-line images. They postulate that a warm and dense equatorial disk exists close to the star.
MIDI observations of AG Car were carried out with the UT2-UT3 baseline on two nights, with projected baselines of 42.0 m and 35.6 m and PA of 41° and 69° respectively. The visibilites and corresponding gaussian sizes are shown in Figure 5 and the spectrum in Figure 6. AG Car is marginally resolved. The measured size ( 11 mas) is similar for both observations and fairly uniform with wavelength. The Nota et al. (2002) optical images show strongly enhanced H brightness at PA35-225°, and the morphology is similar at 12m (Voors et al., 2000). This direction is also the waist of the nebula, the largest extension being seen perpendicular to it. The MIDI baselines are therefore oriented close to an optimal direction to detect equatorial material and we are very likely resolving the equatorial disk, though we cannot presently distinguish between a disk and shell structure. This is the first direct evidence for dust in a compact structure. The size we detect (11 mas) is 3 orders of magnitude smaller than the upper limit (3”) to the size of the (unresolved) CO outflow in Nota et al. (2002). The corresponding linear size is of the order of only 100 AU at a distance of 6 kpc; very close to the central star. Nevertheless, this detection adds weight to the Nota et al. (2002) claim that the CO emission arises from molecular gas close to the star and is shielded by a disk structure. The presence of dust has implications also for the origin of this compact structure. Nota et al. (2002) favor a scenario where the the star goes through a Red Super Giant (RSG) or RSG-like phase (Smith et al., 1998; Lamers et al., 2001) during which the molecular outflow is formed. Dust formation is also commonly observed during the RSG stage (Massey et al., 2005; Danchi et al., 1994) and fits in with this hypothesis, though the 100 AU scale size indicates very recent or current dust formation as well.
There are few published spectra of AG Car in the mid-IR and the MIDI spectrum is a valuable addition. For comparison we also show in Figure 6 the spectrum from the Short Wavelength Spectrometer (SWS) on the Infrared Space Observatory (ISO) in the 8-13 µm range (Sloan et al., 2003), scaled to roughly match the flux level of the MIDI spectrum. The ISO spectrum, with a much bigger aperture, exhibits a slightly different slope from the MIDI measurement, but the striking difference is that the MIDI spectrum does not show the 11.3µm PAH feature, implying that the PAH originates from further out in the disk/shell as conjectured by Voors et al..
4 The WC Models
The dust around late type WR stars has been closely studied over the last two decades or so and presents a challenging problem pertaining to its formation, geometry and evolution. There have been quite a few attempts to model the dust in some detail. WvdHT model these as spherical shells based on extensive IR spectroscopy. Zubko (1998) provides dust models with emphasis on the physics of grain formation and growth taking into account the grain dynamics in the stellar wind. Harries et al. (2004) take advantage of the high resolution near-IR images of WR 104 (Tuthill et al., 1999), which show a “pinwheel” of dust formed in a binary wind interface, to construct a 3D radiative transfer model for this object. As mentioned earlier, a large percentage of the known dust-forming late type WC stars are known to be binaries, WR 104 being a prime example. The formation of dust in these stars is usually interpreted using the wind-wind collision model of Usov (1991). None of the stars in our sample show definite evidence of being binaries (Williams & van der Hucht, 2000), though this remains a strong possibility.
It has been difficult to explain dust formation in the hostile environment of the wind from single WR stars. SED-based models typically have dust forming at distances from 300 up to a 1000 times the stellar radius (Zubko, 1998). The consensus on the material of the dust, from the SED signature, is amorphous carbon (WvdHT). However, at these distances the electron temperatures in the winds of WRs are likely as high as 104 K (Zubko, 1998), implying that carbon is almost fully ionised.
We present here radiative transfer models for the WC stars in our sample with an aim to use the interferometric measurements to answer the crucial question as formation radius of the inner edges of these dust shells. To this end, we use a 2D Monte Carlo radiative transfer code, MCTRANSF (Niccolini et al., 2003), to construct spherically symmetric dust distributions consistent with the measured visibilities.
The parameters of the models are the star diameter and effective temperature, the internal and external radius of the envelope, its density profile and optical depth, the minimal and maximal radius and size distribution of the grains and the optical indices of the dust. We start with the basic parameters for the dust shells around WR 95 and WR 106 mostly taken from the comprehensive SED-based models of WvdHT (see Table 4). By propagating energy packets in the sampled envelope (circular grid), taking into account the absorption, emission and scattering characteristics of the dust, MCTRANSF computes the temperature of the envelope, the SED of the flux received by the observer directly from the star, as well as the flux emitted and scattered by the envelope. The code has been described in detail in Niccolini et al. (2003) (see Pascucci et al., 2004, for benchmarking tests). An example application in modeling a circumstellar dust shell is found in Woitke & Niccolini (2005).
We then explore the parameter space around this model by primarily varying the location of the inner edge of the disk to see what values are most consistent with both our measured visibilities and spectra. We also tried limited variations of the optical depth, grain size and distribution to quantify their effect on the visibility profile and spectra. The radius of the central star and the composition of the dust were not changed in these trials. MCTRANSF does not explicitly incorporate the sublimation temperature of the grain as an input. The dust temperature in the nucleation zone from existing observational and modeling constraints ranges from 1000 - 1500 K or so (Zubko, 1998; Harries et al., 2004) and in the process of iteration we discard those models which produce untenably high temperatures at the inner edge of the shell. We stress that the modeling is not a “fitting” exercise. That does not seem justified, given the limited visibility data and the fact that the actual geometry of the dust is most likely more complex than simple spherical shell models. Our goal here is to use the new measurements to constrain the vitally important distance to the dust-forming zone from the star.
4.1 WR 106
Extensive studies of the SED of this well known dust-producing WC9 star exist in the literature and long-term IR photometry is summarised in van der Hucht et al. (2001). Infrared (J-Q bands) measurements are presented in WvdHT. More recent mid-IR ISO spectra are found in Smith & Houck (2001). Given the difficulty in standardising mid-IR photometry from various sources and the fact that dusty WC stars can have differing degrees of variability, we rely mostly on the 8-13 µm spectra obtained with the MIDI instrument simultaneously with the visibilities. Leinert et al. (2004) have confirmed the reliability of spectra from MIDI. We used standard reduction techniques as they describe to extract the spectra; most of our interferometric calibrators were also chosen to be IR spectroscopic standards 333[HREF]http://ssc.spitzer.caltech.edu/irs/calib/templ/cohen_models/ and as such provide ideal templates to calibrate the spectra. De-reddening WR spectra has been non-trivial, primarily because these stars are grouped towards the Galactic center with large columns of intervening interstellar dust in addition to the circumstellar dust. The wide interstellar silicate feature centered around 9.7 µm complicates the issue (Smith & Houck, 2001). To provide a uniform comparison, we have de-reddened the 8-13 µm band with values of Aλ/Av from WvdHT and the van der Hulst extinction curve 15 for the shorter wavelengths.
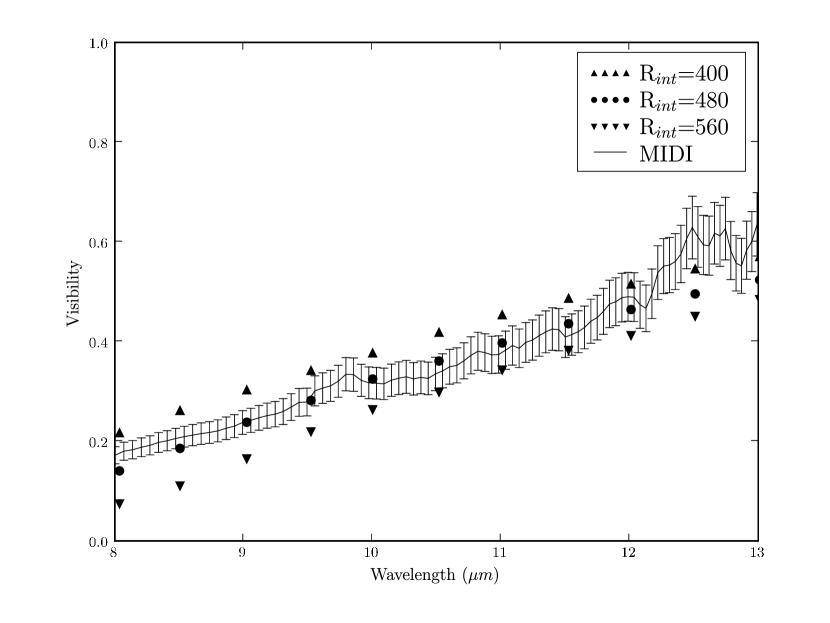
For WR 106, the model visibilities from our “best” model are shown in Figure 7, along with the Keck measurements as well as the MIDI visibility at 10.5 µm.
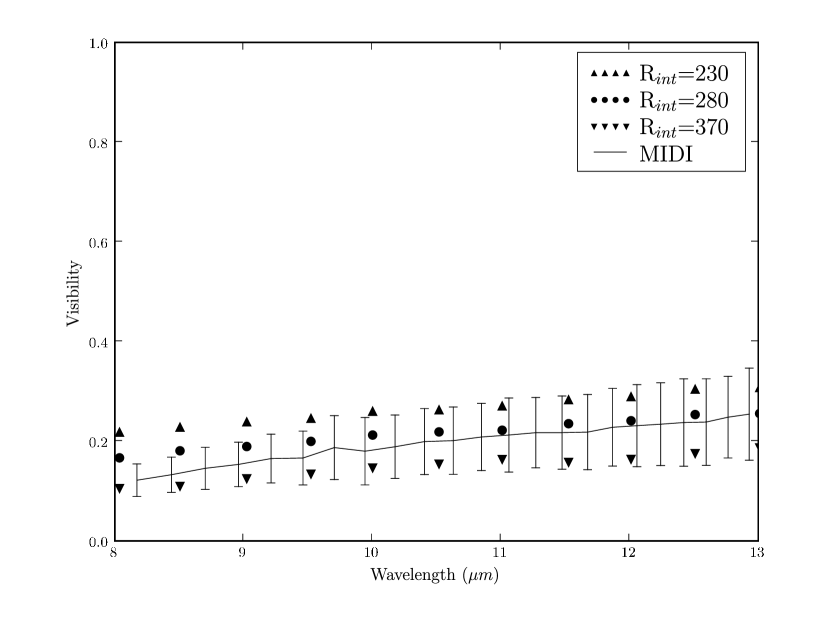
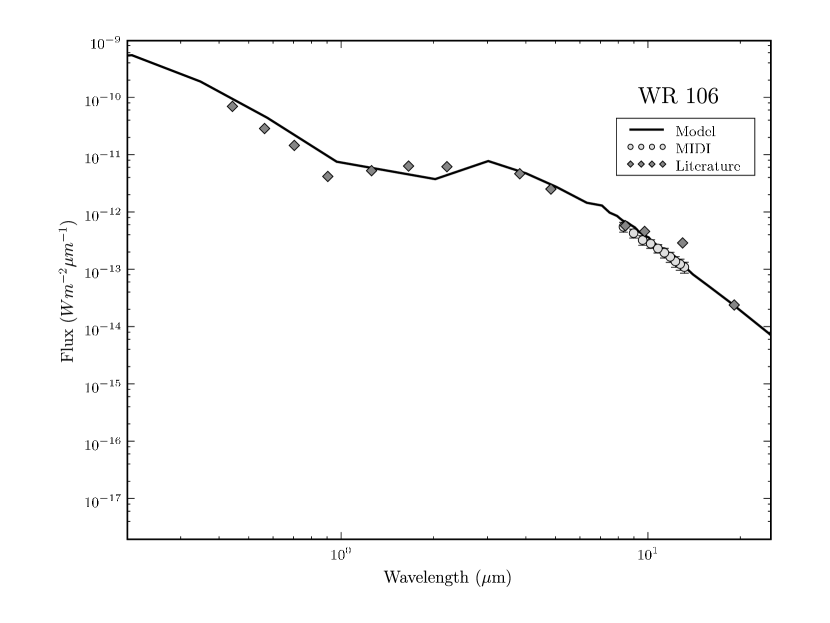
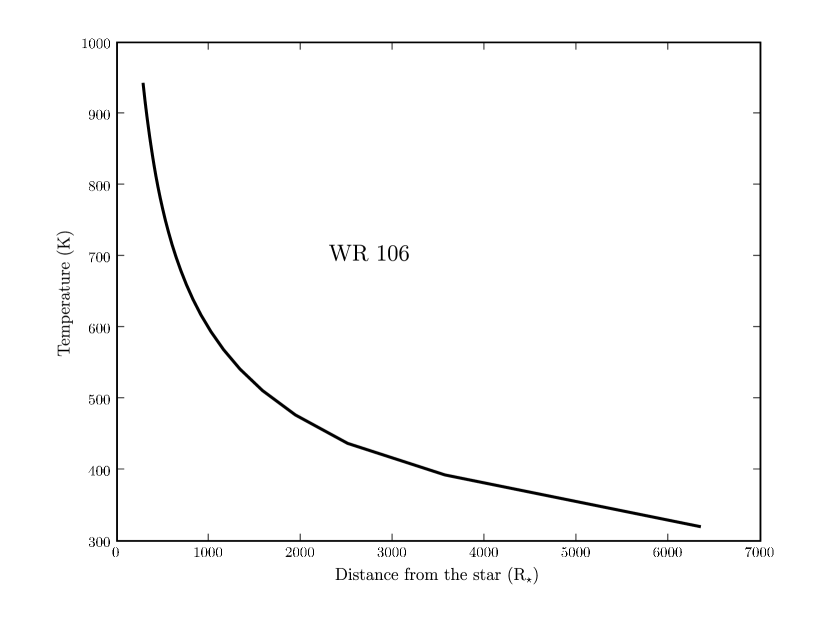
The MIDI visibilities across the entire band (8-13 µm) are compared with the model in Figure 8. The closure phases measured by the Keck segment-tilting experiment did not show any significant deviation from zero, signifying a lack of asymmetry at this resolution and sensitivity. We therefore plot the Keck visibilities treating the baselines as scalars (i.e., ignoring the orientation). Figure 9 shows the model SED along with our measurements and those from the literature444From catalogs available at the VizieR online database (Ochsenbein et al., 2000). Optical fluxes: Homogeneous Means in the UBV System (Mermilliod, 1991); Hipparcos Input Catalogue, Version 2 (Turon et al., 1993); The USNO-B1.0 Catalog (Monet et al., 2003); IR fluxes: Catalog of Infrared Observations, Edition 5 (Gezari et al., 1999); Third release of DENIS (DENIS consortium, 2005). spanning wavelengths from the optical to the far-infrared for comparison. The temperature profile of the dust in our model is shown in Figure 10. The parameters for the model are as below:
Central Star
For the central star, we have adopted a blackbody spectrum at the effective temperature listed below. The temperature of the WR star has been assigned a range of values in the literature. Most dust-formation models adopt a value between 18000 and 25000 K (e.g., WvdHT). These values have been criticized as being under-estimates from recent studies of the WR spectra (Crowther, 2003). However, we find in our models that higher temperatures (we tested up to 40000 K) do not fit the 8-13 µm spectra and also lead to dust temperatures above the 1500 K or so sublimation temperature usually adopted for amorphous carbon grains. This indeed has been the reason that previous modeling attempts favour the lower values as well. Although more sophisticated SEDs have been used for the stellar photosphere (Harries et al., 2004, WdvHT), a simple blackbody is likely adequate for our purpose. The radius of the star is is assumed to be 14.6R☉ (WdvHT) at a distance of 2.09 Kpc (van der Hucht, 2001).
-
*
Temperature of central star (Teff) = 19000 K
-
*
Angular radius of central star (R∗) = 3.2310-5 arcsecond
Dust Shell physical properties
-
*
Composition: Amorphous carbon (optical constants from Rouleau & Martin, 1991)
-
*
Grain size: Ranges from 0.5 to 0.6 µm
-
*
Optical depth () = 0.015 at 10 µm
Dust Shell geometry
-
*
Inner radius of dust shell (Rint) = 280 R∗(multiples of stellar radius)
-
*
Outer radius of dust shell = 8400 R∗
-
*
Density profile: Proportional to r-2, except in the region between 1.0 Rint and 14.0 Rint where we introduce an over-dense region with density proportional to 7r-2.
4.2 Discussion
Most of the starting parameters of the dust shell model were based on WvdHT. They establish the composition to be amorphous C at least in the case of the episodic dust-producer WR 140. The lack of silicate features in the mid-IR region also points to amorphous C. The grain size and distribution for the shells are not well known. The Zubko (1998) grain-formation model predicts a fairly small maximum grain size( 100 - 200Å). Harries et al. (2004) model the inner part of the WR 104 pinwheel nebula with small ( 100Å) grains, mainly to match the 2-10 µm flux. However, there is evidence in the SED of WR nebulae pointing towards large grains of 0.1 to 1 µm (Chiar & Tielens, 2001; Veen et al., 1998) and Marchenko et al. (2002) find a characteristic size of 0.5 µm for the extended emission in WR 112. The model presented here also favors large grains with a quasi-uniform grain size ranging from 0.5 to 0.6 µm, with a standard interstellar distribution scaling as a-3.5(Mathis et al., 1977). A model with sizes ranging from 0.03 to 2.0 µmalso shows reasonable agreement with the data for similar values of the other parameters. Despite extensive trials we were unable to find a distribution of smaller grain sizes which agreed with the data, in particular the flux at the shorter infrared wavelengths.
The optical depth for these dust shells in the mid IR is fairly low (Zubko, 1998). We use here a value of 0.015. Our primary goal of matching the measured visibilities is not strongly affected by the optical depth and it is the spectra that constrain this parameter.
The important constraint imposed by the visibility profile is on the range of inner edge radii of the dust shell. The “best” model in Figure 7 has a value of 280 R∗ for the inner edge radius, which is the same as in the WvdHT model. We show in Figure 8 the model visibility profile for values ranging from 230 R∗ to 370 R∗. Even for this narrow range, the visibility profiles are clearly different, indicating the fairly strong constraints imposed by the measurements.
The over-density (denser than the r-2 profile) that we introduce in the shell is to accomodate the visibilities measured with the smaller baselines at the Keck, which are lower than expected for a r-2 profile consistent with the longer baseline MIDI visibilities. The over-dense region in the dust shell extends from the inner edge (Rint) up to 14 Rint in the model, i.e., size scales from 9 to 125 mas. This enhancement at the spatial scales probed by the segment-tilting experiment (resolution 50 mas, see Section 3.2) decreases the visibility at the low spatial frequencies. This of course is not a unique solution, but offers an intuitive physical model. The over-density could indicate an episode of more vigorous dust production. It could also be an artifact of applying an overly simplistic spherically symmetric model to a possibly complex shell geometry as in, for example, a “pin-wheel” structure. In the absence of more complete visibility sampling, we limit ourselves to simply pointing out the existence of an extended structure in the dust around WR 106.
4.3 WR 95
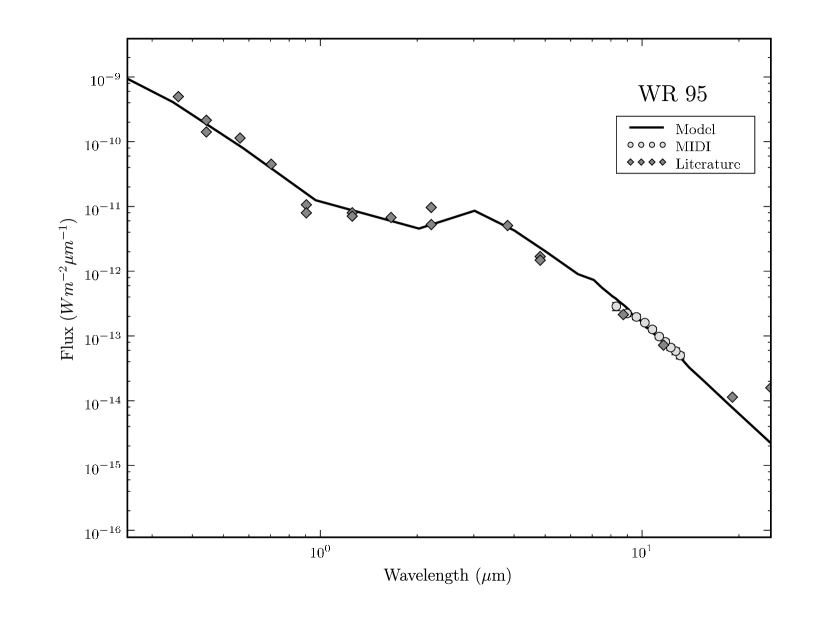
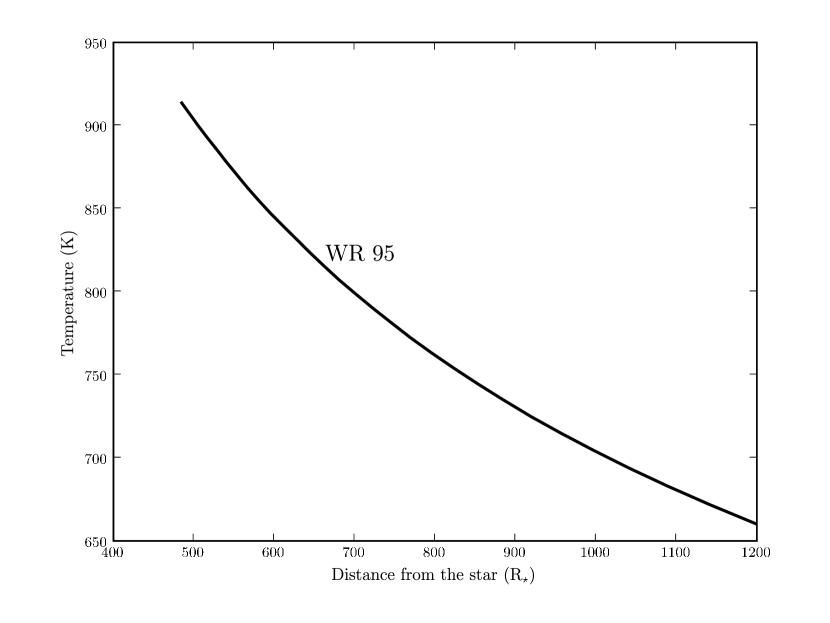
WR 95 is also a late-type dust-forming WC, similar to WR 106. As in the case of WR 106, there is no definite evidence so far, either spectroscopic or photometric, of binarity. WR 95 falls below the sensitivity limit of the Keck segment-tilting experiment and so we base our models solely on the MIDI visibilities and spectra. Our best model visibilities along with the measured values in the 8-13 µm MIDI band are shown in Figure 11. Figure 12 shows the measured 8-13 µm SED, the near-IR and far-IR photometry from the literature, and the model SED profile. The dust temperature profile is as in Figure 13. The parameters of the model are as below:
Central Star
-
*
Effective temperature (Teff): 25000 K
-
*
Angular radius of star (R∗): 3.210-5 arcsecond
Dust shell physical properties
-
*
Composition: Amorphous carbon
-
*
Grain size: Ranges from 0.5 to 0.6 µm
-
*
Optical depth () = 0.005 at 10 µm
Dust Shell geometry
-
*
Inner radius of dust shell (Rint) = 480 R∗(multiples of stellar radius)
-
*
Outer radius of dust shell = 1230 R∗
-
*
Density profile: Proportional to r-2
As in the case of WR 106, we base our initial model parameters mostly on WvdHT. To match the near IR photometry and our visibility measurements we had to adopt higher temperature of 25000 K for the WR star. The optical depth for our best model, 0.005 at 10 µm, is lower than that for WR 106. Since we do not have shorter baseline Keck observations in this case to detect extended structure, a uniform r-2 density profile suffices. The nominal inner radius of the shell is 480 R∗ (Figure 11 shows how the model visibilities vary for slightly different values of this parameter), compared to 410 R∗ derived by WvdHT. As in the case of WR 106, a dust grain distribution with sizes ranging from 0.3 to 2.0 µm also yields a fair fit to the measurements.
5 Conclusions
High-resolution measurements of dust around massive stars are sparse in the literature. Coupled with the rarity of the objects themselves, it is not surprising that so much remains unclear about the mechanisms of dust-formation and the nature of the dust itself. Only a handful of WR stars known to produce dust have been imaged with any degree of detail. Three of these, WR 104, WR 98a and WR 140 are binaries, producing dust at the wind-wind interface. The fourth, WR 112 reveals a multiple-shell dust structure, though at much larger (arcsecond) scales than discussed here for our targets, suggestive also of being a binary (Marchenko et al., 2002). Hence the measurements presented here, albeit with limited baselines, of similar objects with no previous evidence of binarity, are an important step in probing the nature of these dust shells.
We observed two WC9 stars (WR 106 and WR 95), an LBV (AG Car) and an object which may be in a stage of transition from an LBV to a WR phase, NaSt1. NaSt1 was well resolved and the visibility measurements suggest increasing size with wavelength, a behavior unlike the WC 9 stars in our sample. We favor a two-component model for the dust with a compact, unresolved core and an extended component. Previous studies of the SED of this object have also indicated this structure. For AG Car as well, our measurements resolve a compact mid-IR source which is likely associated with a known molecular gas component and is the first direct evidence for dust near the central star. For both these objects, this study has revealed the presence of close-in dust that has important implications for the state of evolution of the central star.
For the WC stars we construct spherically symmetric radiative transfer models for the dust shells. These models indicate the inner edge of these shells are at a few hundred stellar radii (tens of AU) from the star. Gaussian sizes (FWHM) directly estimated from the visibility measurement provide model-independent upper limits which are consistent with these values. At these distances, the dust temperature is fairly close to sublimation values for carbonaceous dust. In addition, our results support previous indications of fairly large grains ( 1 µm) despite these conditions. These new results re-open an existing controversy: How does dust form in the hostile environment of a WR stellar wind at such high temperatures? The proximity of the inner edge to the star also forces us to adopt values close to 20,000 K for the central star to keep the dust below the sublimation point. However, the spectra of late-type WC stars point to higher (40,000 to 70,000 K) temperatures, rendering the situation even worse. Our results certainly indicate that dust formation is likely occuring under fairly extreme conditions. This may suggest a colliding-wind binary model but direct evidence is still lacking for the objects in our sample.
The dust around WR 106 seems to deviate from an r-2 profile at the shorter baseline Keck measurements. Our simple models suggest an over-dense region fairly close to the inner edge. This could be also be a first indication of of binarity with multiple shells from episodic dust production or a more complex geometry as in a pinwheel. But given our limited baseline coverage, a caveat on modeling artifacts is warranted.
We have not attempted to estimate the dust mass from the models. Our measurements are insensitive to the colder dust further from the star and it is unlikely that we can improve on the existing dust mass estimates for these stars from spectral profiles.
In the long-term, further progress would involve multiple baselines to image the dust structure. Observations of the outer dust at longer wavelengths are also required to accurately estimate the dust mass and geometry. In the short-term, we aim to look for asymmetries in the dust distribution by using the UT3-UT4 baseline at the VLTI, orthogonal to the one used here.
References
- Barniske et al. (2006) Barniske, A., Oskinova, L., Hamann, W.-R., & Gräfener, G. 2006, ASP Conf. Ser. 353: Stellar Evolution at Low Metallicity: Mass Loss, Explosions, Cosmology, 353, 241
- Cherchneff et al. (2000) Cherchneff, I., Le Teuff, Y. H., Williams, P. M., & Tielens, A. G. G. M. 2000, A&A, 357, 572
- Chiar & Tielens (2001) Chiar, J. E., & Tielens, A. G. G. M. 2001, ApJ, 550, L207
- Clark et al. (2003) Clark, J. S., Egan, M. P., Crowther, P. A., Mizuno, D. R., Larionov, V. M., & Arkharov, A. 2003, A&A, 412, 185
- Coude Du Foresto et al. (1997) Coude Du Foresto, V., Ridgway, S., & Mariotti, J.-M. 1997, A&AS, 121, 379
- Crowther & Smith (1999) Crowther, P. A., & Smith, L. J. 1999, MNRAS, 308, 82
- Crowther (2003) Crowther, P. A. 2003, Ap&SS, 285, 677
- Danchi et al. (1994) Danchi, W. C., Bester, M., Degiacomi, C. G., Greenhill, L. J., & Townes, C. H. 1994, AJ, 107, 1469
- Groh et al. (2006) Groh, J. H., Hillier, D. J., & Damineli, A. 2006, ApJ, 638, L33
- Harries et al. (2004) Harries, T. J., Monnier, J. D., Symington, N. H., & Kurosawa, R. 2004, MNRAS, 350, 565
- Humphreys & Davidson (1979) Humphreys, R. M., & Davidson, K. 1979, ApJ, 232, 409
- Humphreys et al. (1989) Humphreys, R. M., Lamers, H. J. G. L. M., Hoekzema, N., & Cassatella, A. 1989, A&A, 218, L17
- Humphreys & Davidson (1994) Humphreys, R. M., & Davidson, K. 1994, PASP, 106, 1025
- Lamers et al. (2001) Lamers, H. J. G. L. M., Nota, A., Panagia, N., Smith, L. J., & Langer, N. 2001, ApJ, 551, 764
- Leinert et al. (2003) Leinert, C., et al. 2003, Proc. SPIE, 4838, 893
- Leinert et al. (2004) Leinert, C., et al. 2004, A&A, 423, 537
- Marchenko et al. (2002) Marchenko, S. V., Moffat, A. F. J., Vacca, W. D., Côté, S., & Doyon, R. 2002, ApJ, 565, L59
- Massey et al. (2005) Massey, P., Plez, B., Levesque, E. M., Olsen, K. A. G., Clayton, G. C., & Josselin, E. 2005, ApJ, 634, 1286M
- Mathis et al. (1977) Mathis, J. S., Rumpl, W., & Nordsieck, K. H. 1977, ApJ, 217, 425
- Monnier et al. (1999) Monnier, J. D., Tuthill, P. G., & Danchi, W. C. 1999, ApJ, 525, L97
- Monnier et al. (2004a) Monnier, J. D., et al. 2004a, ApJ, 602, L57
- Monnier et al. (2004b) Monnier, J. D., Tuthill, P. G., Ireland, M. J., Cohen, R., & Tannirkulam, A. 2004b, Bulletin of the American Astronomical Society, 36, 1367
- Monnier et al. (2007) Monnier, J. D., Tuthill, P. G., Danchi, W. C., Murphy, N., & Harries, T. J. 2007, ApJ, 655, 1033
- Niccolini et al. (2003) Niccolini, G., Woitke, P., & Lopez, B. 2003, A&A, 399, 703
- Nota et al. (1992) Nota, A., Leitherer, C., Clampin, M., Greenfield, P., & Golimowski, D. A. 1992, ApJ, 398, 621
- Nota et al. (2002) Nota, A., Pasquali, A., Marston, A. P., Lamers, H. J. G. L. M., Clampin, M., & Schulte-Ladbeck, R. E. 2002, AJ, 124, 2920
- Ochsenbein et al. (2000) Ochsenbein, F., Bauer, P., & Marcout, J. 2000, A&AS, 143, 23
- Pascucci et al. (2004) Pascucci, I., Wolf, S., Steinacker, J., Dullemond, C. P., Henning, T., Niccolini, G., Woitke, P., & Lopez, B. 2004, A&A, 417, 793
- Rouleau & Martin (1991) Rouleau, F., & Martin, P. G. 1991, ApJ, 377, 526
- Sloan et al. (2003) Sloan, G. C., Kraemer, K. E., Price, S. D., & Shipman, R. F. 2003, ApJS, 147, 379
- Smith (1968) Smith, L. F. 1968, MNRAS, 138, 109
- Smith et al. (1998) Smith, L. J., Nota, A., Pasquali, A., Leitherer, C., Clampin, M., & Crowther, P. A. 1998, ApJ, 503, 278
- Smith & Houck (2001) Smith, J. D. T., & Houck, J. R. 2001, AJ, 121, 2115
- Tuthill et al. (1999) Tuthill, P. G., Monnier, J. D., & Danchi, W. C. 1999, Nature, 398, 487
- Tuthill et al. (2000) Tuthill, P. G., Monnier, J. D., Danchi, W. C., Wishnow, E. H., & Haniff, C. A. 2000, PASP, 112, 555
- Tuthill et al. (2006) Tuthill, P., Monnier, J., Tanner, A., Figer, D., Ghez, A., & Danchi, W. 2006, Science, 313, 935
- Usov (1991) Usov, V. V. 1991, MNRAS, 252, 49
- van der Hucht et al. (1981) van der Hucht, K. A., Conti, P. S., Lundstrom, I., & Stenholm, B. 1981, Space Science Reviews, 28, 227
- van der Hucht (2001) van der Hucht, K. A. 2001, New Astronomy Review, 45, 135
- van der Hucht et al. (2001) van der Hucht, K. A., Williams, P. M., & Morris, P. W. 2001, ESA SP-460: The Promise of the Herschel Space Observatory, 273
- Veen et al. (1998) Veen, P. M., van Genderen, A. M., van der Hucht, K. A., Li, A., Sterken, C., & Dominik, C. 1998, A&A, 329, 199
- Voors et al. (1999) Voors, R. H. M., Waters, L. B. F. M., Morris, P. W., Trams, N. R., de Koter, A., & Bouwman, J. 1999, A&A, 341, L67
- Voors et al. (2000) Voors, R. H. M., et al. 2000, A&A, 356, 501
- Weiner et al. (2006) Weiner, J., et al. 2006, ApJ, 636, 1067
- Williams et al. (1987) Williams, P. M., van der Hucht, K. A., & The, P. S. 1987, A&A, 182, 91
- Williams et al. (1990) Williams, P. M., van der Hucht, K. A., Pollock, A. M. T., Florkowski, D. R., van der Woerd, H., & Wamsteker, W. M. 1990, MNRAS, 243, 662
- Williams (1995) Williams, P. M. 1995, IAU Symposium, 163, 335
- Williams & van der Hucht (2000) Williams, P. M., & van der Hucht, K. A. 2000, MNRAS, 314, 23
- Williams et al. (2001) Williams, P. M., et al. 2001, MNRAS, 324, 156
- Woitke & Niccolini (2005) Woitke, P., & Niccolini, G. 2005, A&A, 433, 1101
- Zubko (1998) Zubko, V. G. 1998, MNRAS, 295, 109
| Star | V | IRAS 12µm | Type | Date Observed | Calibrators |
| mag | Jy | ||||
| WR 95 | 13.4 | 4.56 | WC 9 | 07-30-2004 | HD 177716, HD 129456, HD 169916 |
| 07-31-2004 | HD 169916, HD 165135, HD 192947 | ||||
| WR 106 | 11.93 | 11.67 | WC 9 | 07-09-2004 | HD 165135 |
| NaSt1 | 15.4 | 14.5 | WN(?) | 07-30-2004 | Same as WR 95 above |
| 09-29-2004aaDominant error arises from calibration | HD 168723 | ||||
| 09-30-2004aaDominant error arises from calibration | HD 168723 | ||||
| AG Car | 7.09 | 12.42 | LBV | 04-10-2004 | HD 81797, HD 107446, HD 129456, HD 139997 |
| aBaseline UT2-UT4 | |||||
| Star | Date of Observation | gaussian FWHM |
|---|---|---|
| mas (@ 10.7 µm) | ||
| WR 106 | 06-26-2005 | 56.06.9aaDominant error arises from calibration |
| NaSt1 | 06-26-2005 | 50.0 bbObject was unresolved. Value is an estimated upper limit |
| Star | Distance | gaussian FWHM | Linear Size | References |
|---|---|---|---|---|
| Kpc | mas (@ 10.5 µm) | AU | ||
| WR 95 | 2.09 | 28.41.5 | 59.4 | 1 |
| WR 106 | 2.3 | 45.05.0 | 103.5 | 1 |
| NaSt1 | 2.0 | 20.1, 14.8 (2.0)aaThe two values are from two different baselines. Interpreting sizes from visibility may be inaccurate for this object; see text | 40.2, 29.6 | 2 |
| AG Car | 6.0 | 12.53.0 | 75 | 3 |
| Parameter | ValueaaSingle values are common for both stars |
|---|---|
| Teff | 1900 K |
| R∗ | 14.6 R☉ |
| Dust shell Rint | 410 R∗ (WR 95) |
| 280 R∗ (WR 106) | |
| Dust shell thickness | 3 Rint (WR 95) |
| 30 Rint (WR 106) | |
| Dust composition | Amorphous C |
| Density Profile | r-2 |
| Optical depth @ 10 µmbbSee text, Section 4.2, for references | 0.01 |
| Grain sizesbbSee text, Section 4.2, for references | 0.1 to 1 µm |