Anomalous magnetic hysteresis in the microwave surface resistance of MgB2 superconductor
Abstract
We report experimental results of the field-induced variations of
the microwave surface resistance in samples of MgB2, produced by
different methods. By sweeping the DC magnetic field at increasing
and decreasing values, we have detected a magnetic hysteresis that
can be ascribed to the different magnetic induction, due to the
critical state of the fluxon lattice. The hysteresis observed in
the bulk samples has an unusual shape, which cannot be justified
in the framework of the critical-state models.
Keywords: magnesium diboride; microwave response;
irreversibility properties.
1 Introduction
The - phase diagram of type-II superconductors (SC) is characterized by the presence of the irreversibility line, , below which the magnetic properties of the SC become irreversible [1]. The application of a DC magnetic field, , smaller than develops a critical state of the fluxon lattice, characterized by the critical current density, [2, 3]. The main consequence of the critical state is the hysteretic behavior of the magnetization curve, which gives rise to hysteresis in all of the properties involving the presence of fluxons.
Fluxon dynamics can be conveniently investigated by measuring the microwave (mw) surface resistance, , which is proportional to the mw energy losses [4, 5]. Indeed, the variations of , induced by magnetic fields higher than the first penetration field, are due to the presence and motion of fluxons within the mw-field penetration depth. Most models for the field-induced mw losses [4, 5, 6, 7] assume an uniform distribution of fluxons in the sample, disregarding the critical-state effects. Very recently, we have investigated, both experimentally and theoretically, the field-induced variations of in SC in the critical state [8] and have accounted for the magnetic hysteresis in the curves of Nb samples, powder and bulk [9].
Here, we report on the magnetic-field-induced variations of in samples of MgB2 (bulk and powder), produced by different methods. In the curve, we have detected a magnetic hysteresis that could be due to the different values of the magnetic induction at increasing and decreasing field when the sample is in the critical state. The results obtained in powder sample can by justified in the framework of the critical state models, while those obtained in the bulk samples show a magnetic hysteresis of anomalous shape.
2 Experimental Apparatus and Samples
The field-induced variations of have been studied in four samples of MgB2, three bulk samples (labelled as B) and a powdered one (P). Samples B1 and B2 have been prepared by the one-step method [10]; in particular B1 has been obtained using 11B and B2 using 10B. Sample B3 has been produced by the reactive liquid Mg infiltration in 10B powder [11]. Sample P consists of 5 mg of Alpha-Aesar MgB2 powder, with grain mean diameter m.
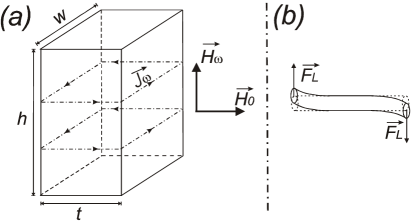
The mw surface resistance is measured by the cavity-perturbation technique [4]. A copper cavity, of cylindrical shape with golden-plated walls, is tuned in the TE011 mode resonating at 9.6 GHz. The sample is located inside the cavity, in the region in which the mw magnetic field is maximum. The cavity is placed between the poles of an electromagnet, which generates DC magnetic fields up to . Two additional coils, independently fed, allow compensating the residual magnetic field. The sample and the field geometry is shown in Fig. 1(a). In the mixed state, the induced mw current causes a tilt motion of the whole vortex lattice [7]; Fig. 1(b) schematically shows the motion of a flux line, induced by the Lorentz force, . The mw surface resistance of the sample is determined measuring the variation of the quality factor of the cavity, induced by the sample, using an hp-8719D Network Analyzer.
3 Experimental Results
The field-induced variations of have been investigated at fixed temperatures, on increasing and decreasing the DC magnetic field . In all of the investigated samples, we have observed a magnetic hysteresis in a wide range of temperatures, up to few K below . However, in this paper we report the results obtained at low temperatures, where the critical-state effects are more significant. All measurements have been performed in zero-field-cooled samples.
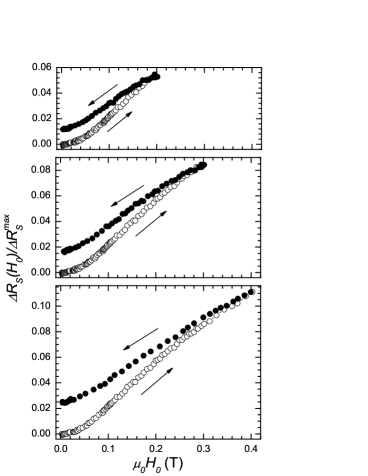
Fig. 2 shows the field-induced variations of , obtained at K by sweeping from 0 up to 1 T and back, for the four samples. , where is the residual mw surface resistance at ; the data are normalized to the maximum variation, , where is the surface resistance in the normal state, at K. Open symbols refer to the results obtained at increasing fields, full symbols those at decreasing fields. On decreasing , after it had reached 1 T, we observe an initial reversible behavior followed by a hysteretic behavior below a certain value of , depending on the sample, indicated in the figure as .

In all of the investigated samples, one can observe that the application of a DC magnetic field of T, much smaller than the upper critical field, induces an unusually enhanced variation; it ranges from to of the maximum variation (achieved when the sample goes to the normal state), dependently on the sample. The enhanced variation has been ascribed to the unusual fluxon structure in MgB2 SC, due to the two superconducting gaps [12, 13]; in this paper, we would discuss the irreversible properties of in MgB2.
A comparison among the results in the different samples, reported in Fig. 2, shows that in all of the bulk samples the width of the hysteresis loop at is of the variation observed at T, while in the powder sample it is . Another peculiarity distinguishing the mw responses of the powder and the bulk samples is the shape of the decreasing-field branch of the curve. Indeed, one can see that in the powder sample the decreasing-field branch exhibits a monotonic decrease, starting from down to . On the contrary, in the bulk samples the decreasing-field branch of the curve shows an unexpected plateau extending from T down to 0.
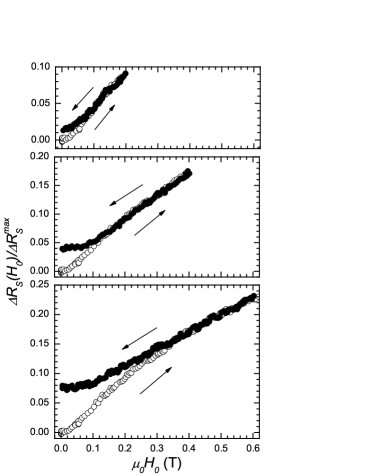
The field-induced variations of have also been investigated by cycling the DC magnetic field in different ranges. Figs. 4 and 4 show the curves, obtained for samples P and B2, respectively, by sweeping from zero up to a certain value, , and back, for different values of . As expected, due to the different trapped flux, the smaller the smaller the hysteresis width. In sample P, when is smaller than the value of Fig. 2(d), the curve is irreversible in the whole field range swept; we remark that we have not reported results obtained with because they exactly reproduce those of Fig. 2(d). On the contrary, in the bulk sample the value of below which the decreasing-field branch deviates from the increasing-field one depends on . For T, the hysteresis is visible in a restricted range of fields and the decreasing-field branch shows a monotonic decrease; instead, for T the unexpected plateau at low magnetic fields is well visible. We would remark that similar results have been obtained in all of the bulk MgB2 samples investigated.
4 Discussion
As it is well known, the magnetic-field-induced variations of the mw surface resistance are due to the presence and motion of fluxons within the mw-field penetration depth [4, 5, 6, 7]; in particular, at low temperatures and for applied magnetic fields lower enough than the upper critical field, they are essentially due to vortex motion induced by the mw current. In most of the models for fluxon dynamics reported in the literature, the fluxon distribution is assumed uniform, neglecting the effects of the critical state of the fluxon lattice. On the other hand, a magnetic hysteresis in the curve is expected in SC in the critical state because of the different fluxon density at increasing and decreasing DC fields. In order to account for this hysteretic behavior, it is essential to consider the fluxon distribution in the sample determined by the critical current density .
Recently, we have investigated the field dependence of the mw surface resistance of SC in the critical state [8, 9], by taking into due account the fluxon distribution, and we have quantitatively justified the hysteretic behavior of the curve detected in Nb samples [9]. The field geometry we have used (see Fig. 1) is particularly convenient to investigate such effects essentially for two reasons. Firstly, the effects of the non-uniform fluxon distribution on are enhanced because in the sample surfaces normal to the external magnetic field the mw current, penetrating along the fluxon axis within the mw-field penetration depth, bends the end segments of all the fluxons. Moreover, just in this case, one can calculate the average value of by integration over the sample surfaces that contribute to the mw energy losses. We have shown that the parameter that mainly determines the features of the curve is the full penetration field, . In particular, the hysteresis width is related to the value of ; samples of small size and/or small are expected to exhibit weak hysteretic behavior. determines also the shape of the hysteresis loop. On increasing from 0 up to , more and more sample regions contribute to the mw losses, giving rise to a positive curvature of the increasing-field branch of the curve. For , in the whole sample the local magnetic induction depends about linearly on the external magnetic field and the increasing-field branch is expected to have a negative concavity. The shape of the decreasing-field branch is strictly related to the shape of the magnetization curve; it should exhibit a negative concavity, with a monotonic reduction of in the whole field range swept.
A comparison among the results reported in the different panels of Fig. 2 shows that in the powder sample the hysteresis width is smaller than that observed in the bulk samples. In the framework of the critical-state model, this finding is ascribable to the small value of due to the reduced size of the powder grains, with respect to the bulk samples. Furthermore, the decreasing-field branch of the curve of sample P exhibits a monotonic decrease, starting from down to , as expected. On the contrary, in all of the bulk samples the shape of the hysteresis shows several anomalies. The most unexpected behavior concerns the plateau observed in the decreasing-field branch of the curve, after the sample had been exposed to relatively high fields. The presence of this plateau is puzzling because it would suggest that the trapped flux does not change anymore on decreasing below a certain threshold value, of the order of 0.1 T. A further anomaly is visible in the increasing-field branch, which exhibits negative concavity in the whole field range swept, despite the estimate value of for the bulk samples is few Tesla [13]. On the contrary, in the curve of sample P one can note a change of concavity in the increasing-field branch at T, which is a reasonable value of for the powder sample.
We would remark that the magnetic field value at which the decreasing-field branch of the curve deviates from the increasing-field one could differ from deduced from magnetization measurements. Indeed, it has been shown that, in samples of finite dimensions, the application of AC magnetic fields normal to the DC field may induce the fluxon lattice to relax toward an uniform flux distribution [14], reducing the value of . The process is particularly relevant for thin samples and/or small critical current. Furthermore, considering the sensitivity of our experimental apparatus, we expect to detect hysteresis for greater than . In this framework, one can justify the reduced value of we obtained in sample P (see Fig. 2(d)), which is roughly one order of magnitude smaller than the value estimated using values reported in the literature for MgB2.
The same justification cannot be given for the results obtained in the bulk samples. From Fig. 4 one can see that, after the inversion of the field-sweep direction, the curve shows an initial reversible behavior, independently of the value of . As a result, the value of the magnetic field at which the decreasing-field branch deviates from the increasing-field one depends on . We would remark that this result has been obtained in all of the bulk samples we have investigated. This finding disagrees with the meaning of the irreversibility line. Indeed, the region of the - plane in which SC exhibit irreversible magnetic properties is not expected to depend on the magnetic history of the sample, but only on the value at the corresponding temperature and external magnetic field. On the other hand, this anomaly has not been observed in the powder sample; indeed, Fig. 4 shows that when the magnetic-field-sweep direction is reversed at fields smaller than the value of deduced from Fig. 2(d) the curve is irreversible in the whole field range swept, consistently with the expected behavior.
In the framework of the critical state, the main property distinguishing the magnetic response of samples having small or large dimensions is the residual magnetic induction. Let us consider two samples with the same value of and different sizes, small and large; furthermore, let us indicate as and the full penetration field of the small- and large-size sample, respectively. In the critical state à la Bean, after cycling in the range , with , the maximum value of the local magnetic induction in the samples will be in the small-size sample and in the large-size sample. This means that in sample regions far from the edges, the local magnetic field in the large-size sample can be much higher than that in the small-size one. Since the dimensions of our bulk samples are a factor of greater than the grain dimensions of sample P, one may infer that the different behavior of the irreversible properties of in the powder and bulk samples is related to the higher value of the local magnetic induction inside the bulk samples, far from the edges, when the applied field is reduced after it had reached relatively high values.
5 Conclusion
We have reported on the irreversible properties of the field-induced variations of the mw surface resistance of different ceramic MgB2 samples, powder and bulk, produced by different techniques. The results have qualitatively been discussed in the framework of models reported in the literature. The hysteretic magnetic behavior of observed in the bulk samples exhibits several anomalies not yet understood. In particular, the magnetic field at which the decreasing-field branch deviates from the increasing-field one depends on the maximum magnetic field reached; furthermore, the decreasing-field branch of the curve shows an unexpected plateau extending from a certain value of , depending on , down to zero. In the powder sample, consisting of MgB2 grains of small dimensions, the shape of the observed magnetic hysteresis is consistent with that expected using the critical-state model. This finding suggests that the anomalous response of the bulk samples is strictly related to the higher value of the local magnetic field in the interior of the sample, when the applied magnetic field is reduced after it had reached high values.
References
References
- [1] Y. Yeshurun, A. P. Malozemoff and A. Shaulov 1996 Rev. Mod. Phys. 68 911, and Refs. therein.
- [2] C. P. Bean 1962 Phys. Rev. Lett. 8 250.
- [3] Y. B. Kim, C. F. Hempstead and A. R. Strnad 1962 Phys. Rev. Lett. 9 306.
- [4] M. Golosovsky, M. Tsindlekht and D. Davidov 1996 Supercond. Sci. Technol. 9 1, and Refs. therein.
- [5] A. Duli and M. Poek 1993 Physica C 218 449.
- [6] M. W. Coffey and J. R. Clem 1992 Phys. Rev. B 45 9872; 45 10527.
- [7] E. H. Brandt 1991 Phys. Rev. Lett. 67 2219; 1995 Rep. Prog. Phys. 58 1455.
- [8] M. Bonura, E. Di Gennaro, A. Agliolo Gallitto and M. Li Vigni 2006 Eur. Phys. J. B 52 459.
- [9] M. Bonura, A. Agliolo Gallitto and M. Li Vigni 2006 Eur. Phys. J. B 53 315.
- [10] M. Putti, V. Braccini, E. Galleani, F. Napoli, I. Pallecchi, A. S. Siri, P. Manfrinetti and A. Palenzona 2003 Supercond. Sci. Technol. 16 188.
- [11] G. Giunchi 2006 Advances in Cryogenic Engeneering 52 813.
- [12] A. Shibata, M. Matsumoto, K. Izawa, Y. Matsuda, S. Lee and S. Tajima 2003 Phys. Rev. B 68 060501(R).
- [13] M. Bonura, A. Agliolo Gallitto, M. Li Vigni, C. Ferdeghini and C. Tarantini 2007 e-print arXiv:cond-mat/0709.0618.
- [14] E. H. Brandt and G. P. Mikitik 2002 Phys. Rev. Lett. 89 027002; G. P. Mikitik and E. H. Brandt 2003 Phys. Rev. B 67 104511.