A MAPS-based Digital Electromagnetic Calorimeter for the ILC
Abstract
A novel design for a silicon-tungsten electromagnetic calorimeter is described, based on Monolithic Active Pixel Sensors (MAPS). A test sensor with a pixel size of m2 has been fabricated in July 2007. The simulation of the physical sensor is done using a detailed three-dimensional charge spread algorithm. Physics studies of the sensor are done including a digitisation algorithm taking into account the charge sharing, charge collection efficiency, noise, and dead areas. The influence of the charge sharing effect is found to be important and hence needs to be measured precisely.
1 Introduction and pixel design
The MAPS R&D program is part of the CALICE [2] collaboration and
proposes a swap-in solution to the existing analogue electromagnetic calorimeter
(ECAL) design [3], leaving the mechanical design unchanged. A first proof of concept sensor has been fabricated.
The concept is to develop a digital electromagnetic calorimeter where
each pixel reports only a single bit. This requires a low probability
for multiple particles within a pixel, and that probability is reduced to an acceptable
level with a cell size of m2.
The charge collection is done mainly by diffusion: four diodes placed near the
corners of each pixel have been optimised in order to minimise the charge sharing
between pixels while maximising the charge collection (see Section 2).
To limit the charge sharing effect, the sensitive thickness of the silicon epitaxial layer has been set to m. The total silicon thickness remains m.
The readout electronics are mainly inside the pixel. A column of 5 pixels every 42
is however needed for the electronic logic, which accounts for around 11% of dead area.
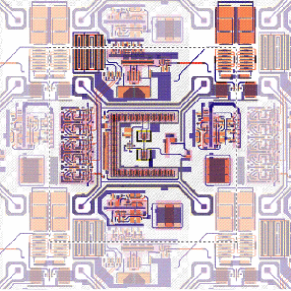
Figure 1 shows an example of the pixel layout, where one pixel is
represented inside the dash-lined area, and the four diodes can be seen on the four
corners. The components inside the diodes form the analogue circuitry, whereas the
comparator and logic are distributed around the edges.
The diodes are N-well to P-substrate. The in-pixel N-wells needed for
the PMOS transistors would also collect charge, leading to losses in
signal. In order to minimise this effect, a novel
process has been devised: the INMAPS process isolates the insensitive N-well region by
screening it with a m thick deep P-well implant.
The main challenge for a full calorimeter will be the power dissipation.
The current test sensor has not been
optimised at all in terms of power, and consumes on average W/mm2, whereas
the analogue CALICE design target is W/mm2. This will be improved in the second design.
2 Sensor simulation
The simulation of the charge collection of the sensor is done using Sentaurus TCAD [4], a tool taking a
precise description of the components in 3D.
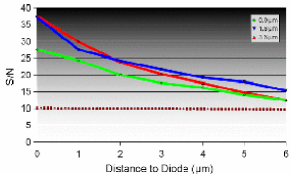
Figure 2 shows the signal over noise ratio as a function of the distance of the input MIP to the diodes, for three different diode sizes. The size of m seems appropriate to maximise the signal over noise ratio, while keeping the collected charge
level to a reasonable level.
Due to time constraints, results covering the whole pixel, with a m step in both
direction, have been done using two approximations:
a pessimistic scenario, where no deep P-well is added, and the N-well is represented by a
large central square collecting around 50% of the total charge deposited in a pixel, and
an optimistic scenario with a perfect deep p-well implant isolating completely the N-well.
3 Physics simulation
The physics simulation of the whole detector using a Tesla-like design [5], and a
MAPS-based ECAL is done using GEANT4 [6]. The distribution of the energy per
hit for photon events is found to be stable from 500 MeV up to 200 GeV,
confirming the assumption of having 1 MIP per cell on average. The energy resolution will then be given by:
.
Due to their small size, the charge sharing between pixels is expected to be important, and will have a big influence on the number of hits above threshold, and hence on the energy
measurements. Understand this phenomenon will be crucial, as well as a precise measurement
of its effects, to prove the validity of such a calorimeter.
The digitisation, required for a realistic simulation, is done in several steps, with results displayed in Figure 4 in terms of energy per hit, where the charge spread model assumes a perfect p-well. The simulation of the energy deposited in m2 cells is done with the Mokka [7] application. The charge sharing results from the sensor simulation (see Section 2) are then applied, giving for each deposition the percentage of energy seen by the pixel and by its eight closest neighbours. The results before applying the charge spread are displayed in dark blue. The other coloured curves show various intermediate contributions, and the black curve is the result per pixel when the different contributions have been summed. A noise of eV (which corresponds to 30 electrons, to be cross-checked with the sensor test setup) is then added. The influence of the noise on the energy resolution is found negligible for a threshold value above 600 eV, or of the noise. This is close to the region where the energy resolution is found minimal (see Figure 4). Dead areas of 5 pixels every 42 pixels are removed, giving the yellow histogram, Figure 4. This was found to degrade the energy resolution measurement by 6%, for single photon events at 20 GeV. A basic MIP clustering algorithm is finally applied, according to the number of closest neighbours, and gives a 16% improvement when calculating the energy resolution versus threshold, for a 20 GeV photon.
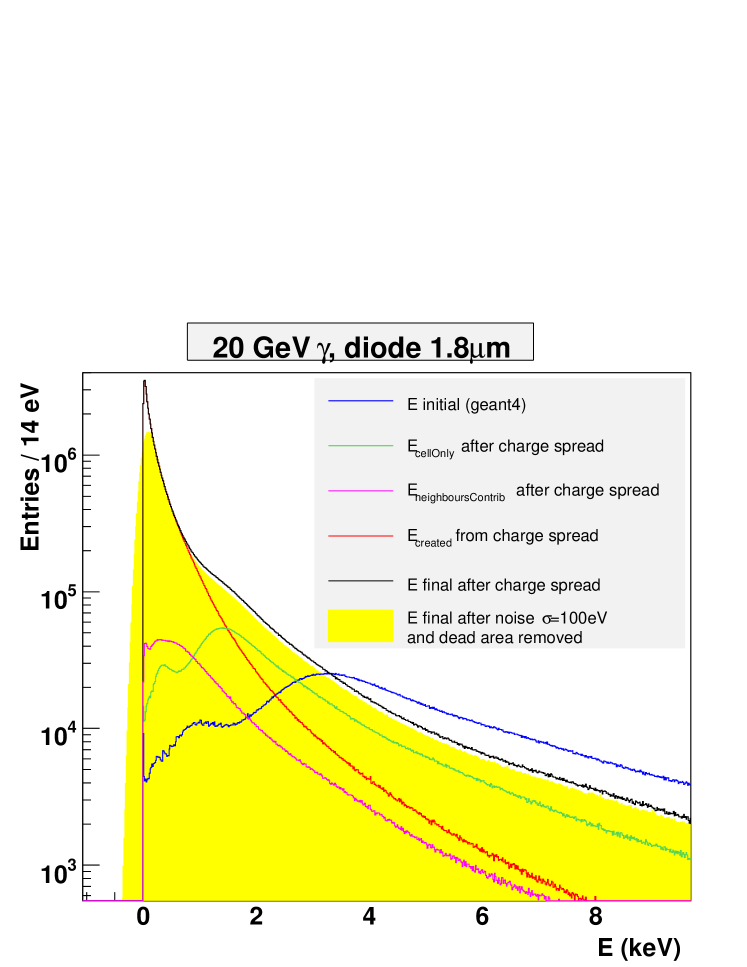
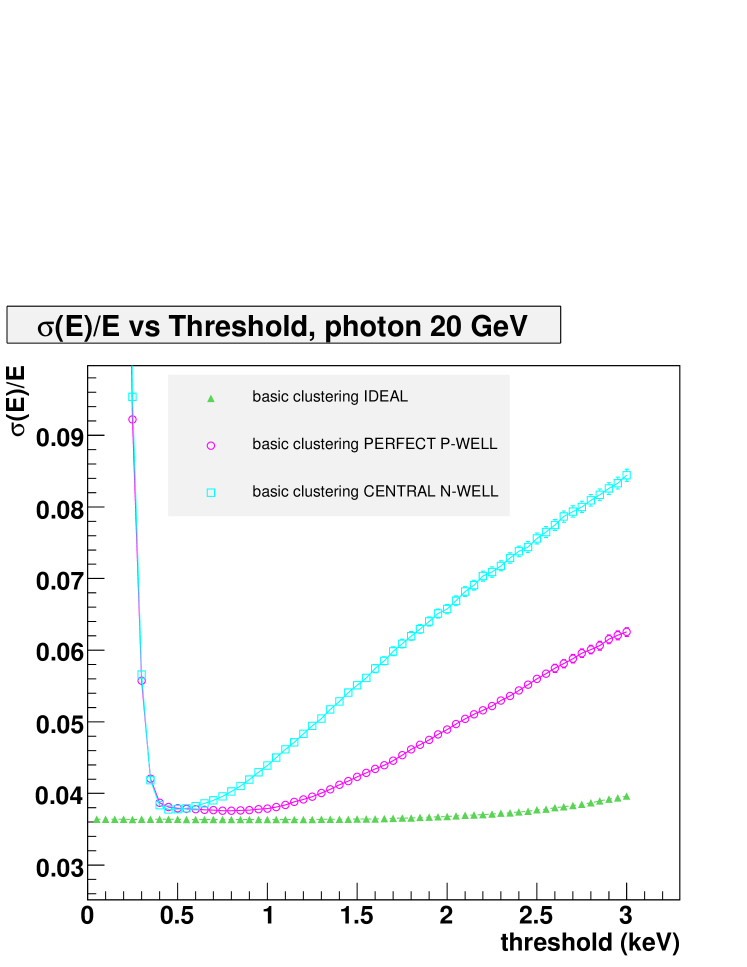
Figure 4 displays the energy resolution versus threshold for 20 GeV photons for the two extreme models we have taken into account up to now. From these curves, two very positive remarks can be drawn. Firstly, the value of the threshold corresponding to the minimum in terms of energy resolution lies outside the noise region, i.e. above 5. Secondly, the minimum value stays constant over a range of threshold settings and is close to the value found when no charge spread is assumed. In the pessimistic N-well scenario, the minimum region is quite narrow, whereas the optimistic scenario predicts a flat region between 5 and 10 of the noise. The reality is expected to lie in between. The influence of the charge spread model is therefore crucial, and hence needs to be measured precisely, and compared with the sensor simulation results.
4 Conclusion
The sensor test setup is now completed, with several designs received from the foundry beginning of July 2007. Simulation shows a MAPS-based calorimeter has the potential to give good energy resolution but several aspects of the sensor response must be measured to cross-check the simulation.
References
-
[1]
Slides:
http://ilcagenda.linearcollider.org/contributionDisplay.py?contribId=392&sessionId=108&confId=1296 -
[2]
The CALICE collaboration: calorimeter studies for a future linear collider, 2002.
http://www.ppd.clrc.ac.uk/AnnReps/2004/exp/Calice-317.pdf -
[3]
ECAL mechanical design, available from
http://polywww.in2p3.fr/activities/physique/flc/calice.html -
[4]
Sentaurus TCAD, available from
http://www.synopsys.com/products/tcad/tcad.html -
[5]
Tesla Technical Design Report, available from
http://tesla.desey.de/new_pages/TDR_CD/start.html - [6] GEANT4, a simulation toolkit, S. Agostini et al., Nucl. Instr. and Meth. A 506 (2003) 250-303.
-
[7]
Mokka, a detailed Geant4 simulation for the ILC detectors. Available from
http://polywww.in2p3.fr/activities/physique/geant4/tesla/www/mokka/mokka.html