In silico network topology-based prediction of gene essentiality
Abstract
The identification of genes essential for survival is important for the understanding of the minimal requirements for cellular life and for drug design. As experimental studies with the purpose of building a catalog of essential genes for a given organism are time-consuming and laborious, a computational approach which could predict gene essentiality with high accuracy would be of great value. We present here a novel computational approach, called NTPGE (Network Topology-based Prediction of Gene Essentiality), that relies on network topology features of a gene to estimate its essentiality. The first step of NTPGE is to construct the integrated molecular network for a given organism comprising protein physical, metabolic and transcriptional regulation interactions. The second step consists in training a decision tree-based machine learning algorithm on known essential and non-essential genes of the organism of interest, considering as learning attributes the network topology information for each of these genes. Finally, the decision tree classifier generated is applied to the set of genes of this organism to estimate essentiality for each gene. We applied the NTPGE approach for discovering essential genes in Escherichia coli and then assessed its performance.
pacs:
87.10.+e, 87.17.AaI Introduction
Essential genes are genes that are indispensable to support cellular life. These genes constitute a minimal set of genes required for a living cell. Therefore, the functions encoded by this gene set are essential and could be considered as a foundation of life itself kobayashi2003 ; itaya1995 . The identification of genes which are essential for survival is important not only for the understanding of the minimal requirements for cellular life, but also for practical purposes. For example, since most antibiotics target essential cellular processes, essential gene products of microbial cells are promising new targets for such drugs jud2000 . The prediction and discovery of essential genes has been performed by experimental procedures such as single gene knockouts PubMed_12140549 , RNA interference PubMed_15877598 and conditional knockouts PubMed_14507372 , but each of these techniques require a large investment of time and resources and they are not always feasible.
Considering these experimental constraints, a computational or in silico approach capable of accurately predicting gene essentiality would be of great value. Some of such predictors have been already developed in which sequence features of genes and proteins with or without homology comparison have been utilized as parameters for training machine learning classifiers for gene essentiality prediction PubMed_16899653 ; PubMed_17052348 . In addition, predictors of gene essentiality based on network topology features, as the physical interactions of a protein PubMed_11333967 or the number of biochemical species that are knocked out from the metabolic network following a gene deletion PubMed_15671116 ; PubMed_16095595 have also been developed.
The currently available network topology-based methodologies of gene essentiality prediction use only one type of network topology feature, i.e. protein physical interactions or metabolic interactions, for performing such predictions. Actual molecular interaction networks, however, are composed by entities that are intricately connected with diverse types of interactions, such as protein physical, metabolic and transcriptional regulation interactions.
We therefore propose here a novel machine-learning based in silico approach, called NTPGE (Network Topology-based Prediction of Gene Essentiality), that relies on multiple topological network features of a given gene to estimate its essentiality. For the generation of the decision tree classifier, NTPGE employs the following network topological features as learning attributes: number of physical interactions for the corresponding encoded protein, number of target genes transcriptionally regulated by the corresponding encoded transcription factor, number of transcription factors that regulate it, number of enzymes that use metabolites produced by the corresponding encoded enzyme as reactants and number of enzymes that produce metabolites used as reactants by the corresponding encoded enzyme. To assess the performance of the NTPGE approach, we used it for the discovery of essential genes in the bacterium Escherichia coli, a model organism whose most of genes have already been characterized experimentally as essential or non-essential.
II Construction of the IMN of E. coli
As NTPGE relies on topological features of molecular network, the first step was to construct the Escherichia coli integrated molecular network (IMN) comprising protein physical, metabolic and transcriptional regulation interactions. For this purpose, we used MONET (MOlecular NETwork) ontology, a tool developed by our group that facilitates the construction of IMNs of organisms via integration of information from metabolic pathways, protein-protein interaction networks and transcriptional regulation interactions through a model able to minimize data redundancy and inconsistency PubMed_16755509 . As previously described, two genes of a given organism, and , coding for proteins and are linked if:
-
•
and interact physically,
-
•
regulates the transcription of gene ,
-
•
or one metabolite generated by a reaction catalyzed by is consumed in a reaction catalyzed by (we may exclude from this analysis the most used compounds such as ATP, NAD, H2O, etc.).
The data sources present in MONET ontology used for the construction of the E. coli IMN were KEGG (Kyoto Encyclopedia of Genes and Genomes PubMed_16381885 for metabolic interactions, RegulonDB PubMed_16381895 for transcriptional regulation interactions, and Butland et al PubMed_15690043 for protein physical interactions.
Using MONET, we constructed two directed IMNs of E. coli, and . contained all possible interactions among genes with 1,998 genes and 51,642 interactions. was similar to , except that the connections through the ten most frequently used compounds on the metabolism were deleted producing a network with 1,987 genes and 21,338 interactions, since connections via these common compounds is not likely to be important for the determination of gene essentiality due to their promiscuity.
III Brief analysis of the Escherichia coli IMNs
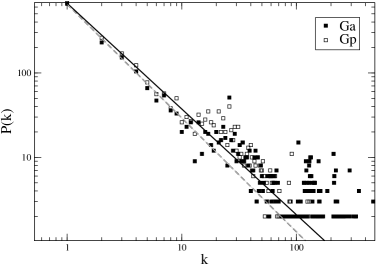
Prior to use the Escherichia coli IMNs for the validation of the NTPGE approach, we present here a brief analysis of the most common network measures, i.e. degree distribution and clustering coefficient, of these IMNs. The degree distribution, , gives the probability that a selected node has exactly links. is obtained by counting the number of nodes with = 1, 2,… links and dividing by the total number of nodes . The clustering coefficient, , gives the density of triangles we can construct in the network having the node as a vertex. The clusterization coefficient is defined as:
| (1) |
where is the number of links connecting the neighbors of the node . The average clustering coefficient is the clustering coefficient for the whole network and characterizes the overall tendency of nodes to form clusters or groups.
In Figure 1 we show the histogram of degree distribution for and . The curves are well approximated by a power law function, for both IMNs, suggesting that and are scale-free networks.
.
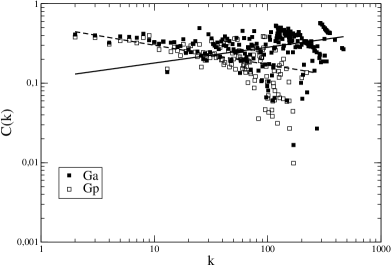
We also analyzed the dependence of the average clusterization coefficient, , on the connectivity , defined as . For a traditional scale-free network, we expect not to depend on , while for hierarchical networks we expect . Figure 2 shows the for and . These results point to a not dependent on for and a dependent on for , thus indicating that is a non-hierarchical IMN and is an hierarchical IMN. This shift from a non-hierarchical topology for to an hierarchical topology for seems to be caused by the deletion of the connections through the ten most frequently used compounds in the metabolism on the construction of . Such compounds induce a strongly connected IMN due to their promiscuity.
IV Description of the NTPGE approach
The NTPGE approach was performed using WEKA (Waikato Environment for Knowledge Analysis) system WEKA . WEKA is a collection of machine learning algorithms for data mining tasks. It also provides means for data pre-processing, classification, regression, clustering, association rules, and visualization WEKA . Among these algorithms, we used the J48 WEKA , which is the Weka’s implementation of the well known C4.5 C45 that uses the greedy technique to induce decision trees for classification. A decision-tree model is built by analyzing training data, which is then used to classify unseen data.
We trained the J48 algorithm on four different training configurations (, , and ). In all configurations, the training data was a set of known essential and non-essential genes of Escherichia coli taken from the PEC database (Profiling of Escherichia coli chromosome, http://www.shigen.nig.ac.jp/ecoli/pec/). The PEC database has been compiled experimental information on Escherichia coli strains from research reports and deletion mutation studies prior to 1998, including gene essentiality for cell growth. Based on these reports about gene essentiality for cell growth, the E, coli genes are classified in essential, non-essential and unknown. http://www.shigen.nig.ac.jp/ecoli/pec In all training configurations, for a given gene, the learning attributes used were as follows:
-
•
number of physical interactions for the corresponding encoded protein;
-
•
number of target genes transcriptionally regulated by the corresponding encoded transcription factor (regulation_out);
-
•
number of transcription factors that regulate it; (regulation_in);
-
•
number of enzymes that use metabolites produced by the corresponding encoded enzyme as reactants (metabolism_out);
-
•
number of enzymes that produce metabolites used as reactants by the corresponding encoded enzyme (metabolism_in);
In and , the above mentioned attributes were extracted from , whereas these same attributes were extracted from in and . Moreover, the attribute damage, which was not originally present in and , was included in and , The damage is defined as the number of metabolites whose production was prevented by the deletion of the enzyme. For a given enzyme, its damage has been shown to be strongly correlated to its essentiality.PubMed_14693817 .
The J48 algorithm was trained with the parameters presented in Table I. As it has been known that data imbalance is one of the causes that degrade the performance of machine learning algorithms kang , we replicated the data related to the essential genes in order to correct data imbalance as the number of non-essential genes is much larger than the number of essential genes.
V Performance of the NTPGE approach and related discussion
The performance of the NTPGE approach was evaluated by testing the classifiers created by the J48 algorithm, as described above, on the training data itself. The selection of the best training configuration to be considered as default by the NTPGE approach was performed based on the F-measure of the corresponding generated classifier. The F-measure provides an harmonic mean of precision and recall and is defined as:
| (2) |
Precision (the percentage of correctly classified instances) and recall (the percentage of positive labeled instances that were classified as such) were calculated from the confusion matrices of the classifiers obtained from the training configurations , , and (Tables II) and are shown on Table III. Table III also shows the F-measure as well as the features of the training configurations, as the number of instances (genes plus metabolites) and presence or absence of the learning attribute damage on training.
According to Table III, the best training configuration was (all genes and metabolites with the attribute damage). Its corresponding generated classifier had a F-measure of 83.4% for essential genes and 79.7% for non-essential genes. In fact, all generated classifiers yielded similar results, suggesting that the presence or absence of the ten most used compounds in metabolism or the presence or absence of the attribute damage did not affect the classification of genes as essential or non-essential by the NTPGE approach. Therefore, any training configuration could be selected as default by NTPGE.
| Parameter | Value |
|---|---|
| binarySplit | False |
| confidenceFactor | 0.25 |
| debug | False |
| minNumObj | 100 |
| numFolds | 3 |
| reduceErrorPruning | False |
| saveInstanceData | False |
| seed | 1 |
| subtreeRaising | True |
| unpruned | False |
| useLaplace | False |
| Predicted | ||
| Non-essential | Essential | Actual |
| 1,392 | 397 | Non-essential |
| 310 | 1,780 | Essential111The number of essential genes were replicated to avoid data imbalance. Actually, the number of essential genes is 209 |
| Predicted | ||
| Non-essential | Essential | Actual |
| 1,348 | 405 | Non-essential |
| 313 | 1,777 | Essential111The number of essential genes were replicated to avoid data imbalance. Actually, the number of essential genes is 209 |
| Predicted | ||
| Non-essential | Essential | Actual |
| 1,346 | 432 | Non-essential |
| 298 | 1,792 | Essential111The number of essential genes were replicated to avoid data imbalance. Actually, the number of essential genes is 209 |
| Predicted | ||
| Non-essential | Essential | Actual |
| 1,348 | 430 | Non-essential |
| 300 | 1,790 | Essential111The number of essential genes were replicated to avoid data imbalance. Actually, the number of essential genes is 209 |
| Features and Performance Measures | Training configurations | |||
|---|---|---|---|---|
| Number of Genes111The number of essential genes were replicated to avoid data imbalance; number of non-essential genes remained unchanged. Actually, the number of essential genes is 209 and non-essential genes is 1,789 for and the number of essential genes is 209 and non-essential genes is 1,778 for | 3,879 | 3,879 | 3,868 | 3,868 |
| Damage | no | yes | no | yes |
| Correctly Predicted Genes (%) | 81.8 | 81.5 | 81.1 | 81.1 |
| Incorrectly Predicted Genes (%) | 18.2 | 18.5 | 18.9 | 18.9 |
| F-measure (N) (%) | 79.7 | 79.4 | 78.7 | 78.7 |
| F-measure (E) (%) | 83.4 | 83.2 | 83.1 | 83.1 |
| Recall (N) (%) | 77.8 | 77.4 | 75.7 | 75.8 |
| Recall (E) (%) | 85.2 | 85.0 | 85.7 | 85.6 |
| Precision (N) (%) | 81.8 | 81.6 | 81.9 | 81.8 |
| Precision (E) (%) | 81.8 | 81.4 | 80.6 | 80.6 |
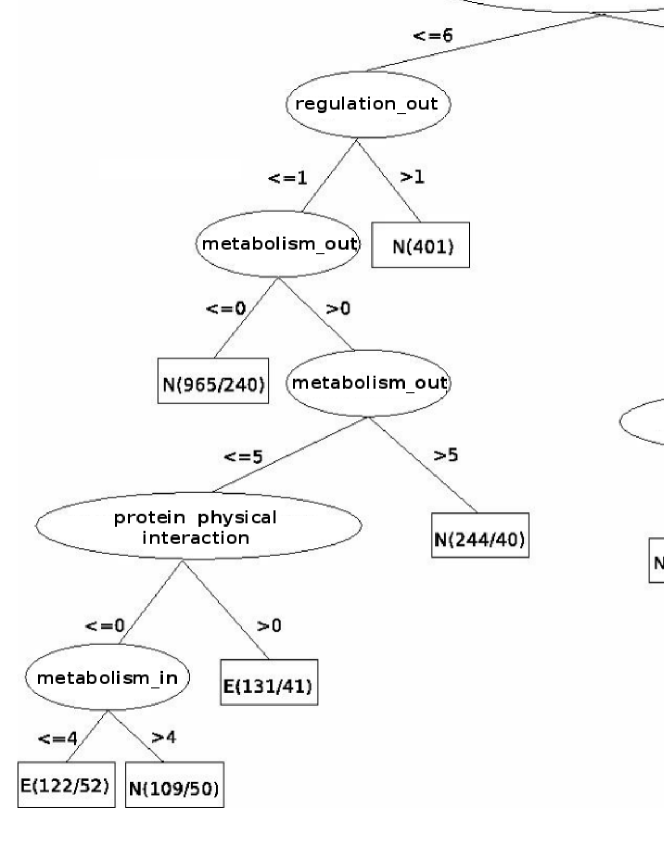
Figure 3 shows the set of rules of the decision tree generated from . The top node of the tree corresponds to the attribute protein physical interaction. This means that the classification tree algorithm concluded that the main factor to define essentiality in E. coli was the protein physical interaction. In fact, the degree of a protein has been documented in the literature as being indicative of essentiality in various organisms PubMed_11333967 ; PubMed_16281187 ; PubMed_15231746 . In our approach, a combination of intermediate number of protein physical interactions with at least one interaction of the type metabolism_in, i.e. number of enzymes that produce metabolites used as reactants by the corresponding encoded enzyme, was also indicative of essentiality. Transcriptional regulation interactions seems not to be a good predictor for gene essentiality, since genes with at least one interaction of the type regulation_out, i.e. number of target genes transcriptionally regulated by the corresponding encoded transcription factor, were classified as non-essential. Moreover, the attribute (regulation_in, i.e. the number of transcription factors that regulate a given gene, was not even included in the decision tree. These results regarding gene essentiality and transcriptional l regulation are not surprising, since transcription factors are usually not essential under the conditions in which the knockout experiments for determining gene essentiality are performed (PEC database, http://www.shigen.nig.ac.jp/ecoli/pec/)
VI Concluding remarks
We proposed here a novel machine learning-based computational approach, called NTPGE (Network Topology-based Prediction of Gene Essentiality), that relies on network topology features of a gene to estimate its essentiality. Distinct from previous network topology-based gene essentiality predictors, NTPGE employs multiple topological network features of a given gene to estimate its essentiality, namely physical interactions for the corresponding encoded protein, number of target genes transcriptionally regulated by the corresponding encoded transcription factor, number of transcription factors that regulate it, number of enzymes that use metabolites produced by the corresponding encoded enzyme as reactants and number of enzymes that produce metabolites used as reactants by the corresponding encoded enzyme.
We verified the performance of NTPGE by applying it for the discovery of essential genes in the bacterium Escherichia coli, a model organism whose most of genes have already been characterized experimentally as essential or non-essential. Among the interactions considered as learning attributes, NTPGE relied mostly in protein physical and metabolic interactions for gene essentiality prediction. In addition, the presence or absence of the ten most used compounds in metabolism or the presence or absence of the attribute damage did not likely influence the classification of genes as essential or non-essential by NTPGE. This can be concluded because the F-measure values of all generated decision trees were similar. Anyway, the best classifier was generated from (all genes and metabolites with the attribute damage) with a F-measure of 83.4% for essential genes and 79.7% for non-essential genes.
In conclusion, the NTPGE seems to be a reliable method of gene essentiality discovery that may be applied to the gene set of other organisms. However, NTPGE is limited to organisms whose corresponding IMN has already been constructed. The construction of the IMN of a given organism involves the gathering of experimentally determined data that are not always available, particularly for a newly sequenced organism. To overcome this limitation, future developments would be the integration of NTPGE with sequence-based methods of IMN construction, thus creating a purely in silico network topology information-based methodology of gene essentiality discovery.
ACKNOWLEDGEMENTS
We would like to thank CNPq (research grants 474278/2006-9 and 506414/2004-3), FAPESP (research grant 2007/02827-9) and FAPERGS (05600005-BRD) for supporting this work. We would also like to thank HP Brazil R&D for the collaboration.
References
- (1) K. K., S. Ehrlich, A. Albertini, G. Amati, K. Andersen, M. Arnaud, K. Asai, S. Ashikaga, S. Aymerich, P. Bessieres, and et al, Proc. Natl Acad. Sci. USA 100, 4678 (2003).
- (2) I. M., FEBS Lett. 362, 257 (1995).
- (3) J. N. and J. Mekalanos, Nat. Biotechnol. 18, 740 (2000).
- (4) G. Giaever, A. M. Chu, L. Ni, C. Connelly, L. Riles, S. Véronneau, S. Dow, A. Lucau-Danila, K. Anderson, B. André, A. P. Arkin, A. Astromoff, M. El-Bakkoury, R. Bangham, R. Benito, S. Brachat, S. Campanaro, M. Curtiss, K. Davis, A. Deutschbauer, K.-D. Entian, P. Flaherty, F. Foury, D. J. Garfinkel, M. Gerstein, D. Gotte, U. Güldener, J. H. Hegemann, S. Hempel, Z. Herman, D. F. Jaramillo, D. E. Kelly, S. L. Kelly, P. Kötter, D. LaBonte, D. C. Lamb, N. Lan, H. Liang, H. Liao, L. Liu, C. Luo, M. Lussier, R. Mao, P. Menard, S. L. Ooi, J. L. Revuelta, C. J. Roberts, M. Rose, P. Ross-Macdonald, B. Scherens, G. Schimmack, B. Shafer, D. D. Shoemaker, S. Sookhai-Mahadeo, R. K. Storms, J. N. Strathern, G. Valle, M. Voet, G. Volckaert, C. yun Wang, T. R. Ward, J. Wilhelmy, E. A. Winzeler, Y. Yang, G. Yen, E. Youngman, K. Yu, H. Bussey, J. D. Boeke, M. Snyder, P. Philippsen, R. W. Davis, and M. Johnston, Nature 418, 387 (2002).
- (5) L. M. Cullen and G. M. Arndt, Immunol Cell Biol 83, 217 (2005).
- (6) T. Roemer, B. Jiang, J. Davison, T. Ketela, K. Veillette, A. Breton, F. Tandia, A. Linteau, S. Sillaots, C. Marta, N. Martel, S. Veronneau, S. Lemieux, S. Kauffman, J. Becker, R. Storms, C. Boone, and H. Bussey, Mol Microbiol 50, 167 (2003).
- (7) M. Seringhaus, A. Paccanaro, A. Borneman, M. Snyder, and M. Gerstein, Genome Res 16, 1126 (2006).
- (8) A. M. Gustafson, E. S. Snitkin, S. C. J. Parker, C. DeLisi, and S. Kasif, BMC Genomics 7, 265 (2006).
- (9) H. Jeong, S. P. Mason, A. L. Barabási, and Z. N. Oltvai, Nature 411, 41 (2001).
- (10) M. Imieliński, C. Belta, A. Halász, and H. Rubin, Bioinformatics 21, 2008 (2005).
- (11) M. C. Palumbo, A. Colosimo, A. Giuliani, and L. Farina, FEBS Lett 579, 4642 (2005).
- (12) J. P. M. da Silva, N. Lemke, J. C. Mombach, J. G. C. de Souza, M. Sinigaglia, and R. Vieira, Genet Mol Res 5, 182 (2006).
- (13) M. Kanehisa, S. Goto, M. Hattori, K. F. Aoki-Kinoshita, M. Itoh, S. Kawashima, T. Katayama, M. Araki, and M. Hirakawa, Nucleic Acids Res 34, D354 (2006).
- (14) H. Salgado, S. Gama-Castro, M. Peralta-Gil, E. Díaz-Peredo, F. Sánchez-Solano, A. Santos-Zavaleta, I. Martínez-Flores, V. Jiménez-Jacinto, C. Bonavides-Martínez, J. Segura-Salazar, A. Martínez-Antonio, and J. Collado-Vides, Nucleic Acids Res 34, D394 (2006).
- (15) G. Butland, J. M. Peregrín-Alvarez, J. Li, W. Yang, X. Yang, V. Canadien, A. Starostine, D. Richards, B. Beattie, N. Krogan, M. Davey, J. Parkinson, J. Greenblatt, and A. Emili, Nature 433, 531 (2005).
- (16) I. H. Witten and E. Frank, Data Mining: Pratical Machine Learning Tools and Techniques with Java Implementations (Morgan Kaufmann, San Francisco, 2000).
- (17) J. R. Quinlan, C4.5: programs for machine learning (Morgan Kaufmann, San Francisco, 1993).
- (18) N. Lemke, F. Herédia, C. K. Barcellos, A. N. D. Reis, and J. C. M. Mombach, Bioinformatics 20, 115 (2004).
- (19) P. Kang and S. Cho, Lecture Notes in Computer Science 4232, 837 (2006).
- (20) E. Estrada, Proteomics 6, 35 (2006).
- (21) S. Wuchty, Genome Res 14, 1310 (2004).