Deep study of the fast bipolar outflows in pre-PNe from CO mm-wave line emission
Abstract
High spatial resolution images of PNe have shown their extremely complex morphology. However, the circumstellar envelopes of their progenitors, the AGB stars, are strikingly spherical. In order to understand the carving processes leading to axisymmetric nebulae, we are carrying out a study of a large sample of pre-PNe. Our emission model of the nebular molecular gas (12CO & 13CO) will allow us to determine important physical parameters (mass, linear momentum, kinetic energy) of the fast bipolar and slow spherical nebular components separately. We will study in an innovative way the properties for each source individually, and put our results in an evolutionary context with the help of the data obtained by us and collected from the literature.
Keywords:
stars: AGB and post-AGB – stars: circumstellar matter – radio-lines: stars – planetary nebulae1 Introduction
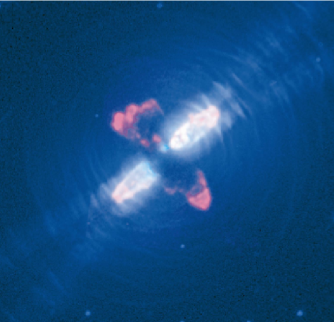
During the latter stage of stellar evolution of low- and intermediate-mass stars, an striking transformation occurs in the nebular morphology and kinematics: the spherical, slowly expanding ( 15 km s-1) circumstellar envelopes of AGB stars transform into highly aspherical PNe with fast outflows ( 100 km s-1). High spatial resolution images of pre-PNe has shown that the asphericity is already present in practically all well-resolved sources ref3 . In addition, the presence of fast bipolar outflows is a common feature in these objects ref1 . The physical processes leading to the appearance of this fast wind are not clearly understood, and the possible link to other structural features such as disk or tori, or a companion star, remain unknown. Magnetic fields may also be involved in the formation of these outflows (see thesis ).
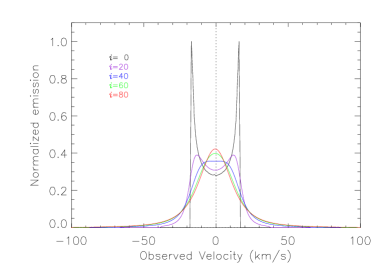
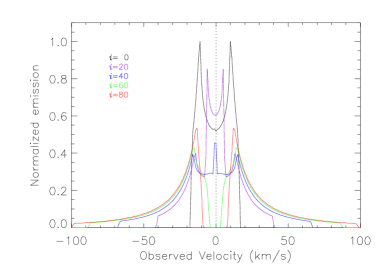
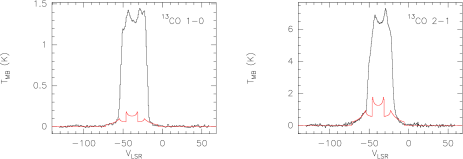
CO emission is the best probe to study the kinematics of the nebular molecular gas, which is the majority of the total nebular mass. Using a synthetic model it is possible to obtain crucial information about the physical conditions of the nebula. CO emission lines of pre-PNe show a characteristic profile where two components are clearly distinguished: i) the core of the line at low velocity, mainly (but not only) corresponding to the spherical component of the nebula, which is probably the fossil AGB wind, and, ii) the wings of the line at high velocity, corresponding to the bipolar component of the nebula. Note that although the bipolar component is the only one detected at high velocities, this is also detected at low velocities because of projection effects.
The first systematic study of the physical characteristics of the bipolar outflows of pre-PNe from their CO emission was made by ref1 . They considered that only the wings of the line represent the emission of the fast bipolar outflow, and, that all the fast gas flows in the direction of the nebula axis. To go a step further, besides increasing the number of sources in the sample with high-quality new observations, we have modeled the CO emission of the bipolar component of the nebula flowing in all directions. This way we are able to separate the CO emission at low velocities of the bipolar component from that of the spherical component at the core of the observed spectrum. This will help us to obtain more accurate values of the mass, the linear momentum, and the energy driven by the bipolar outflows, and to better understand whether those parameters are linked to other observational characteristics of these sources.
2 The sample
| IRAS Z02229+6208 | IRAS 22223+4327 | M 2–56 | IRAS 19475+31 |
| IRAS 06530–0213 | OH 17.7–2.0 | OH 231.8+4.2 | IRAS 22272+5435 |
| IRAS 07131–0147 | IRAS 04296+3429 | Hen 3-401 | IRAS 22574+6609 |
| IRAS 08005–2356 | CRL 618 | Roberts 22 | IRAS 20000+3239 |
| IRAS 18059–3211 | Frosty Leo | HD 101584 | IRAS 23304+6147 |
| IRAS 18095+2704 | IRAS 17436+5003 | Boomerang Nebula | R Sct |
| IRAS 17438+5003 | He 3-1475 | He 2-113 | IRAS 20028+3910 |
| NGC 6302 | IRAS 19500–1709 | Mz-3 | IRAS 23321+2545 |
| 89 Her | CRL 2477 | M 2–9 | IRAS 17150–3224 |
| IRAS 07134+1005 | CRL 2688 | CPD -568032 | IRAS 21282+5050 |
| Red Rectangle | NGC 7027 | M 1–92 |
We have a sample of 43 sources (see Table 1), most of them observed in 12CO and 13CO, both in transitions =1–0 and =2–1, at Pico de Veleta (Spain). The data corresponding to the rest of the sources are taken from the literature. With this large sample of sources it is possible to improve the statistical study on the characteristics found for their different nebular components.
3 Model
Starting with a few assumptions we have modeled the expected 12CO and 13CO emission profiles from the bipolar component of pre-PNe. These assumptions were:
-
•
, i.e., Hubble expansion velocity law
-
•
Axial symmetry, ellipsoidal or bilobal
-
•
Optically thin emission
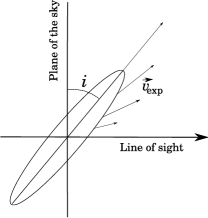
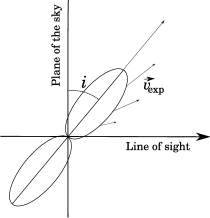
We consider that the CO gas is confined to an infinitesimally thin shell. Assuming mass conservation and an originally isotropical distribution of mass, we have a scenario similar to an anisotropically expanding balloon, where, as it expands the density at each point decreases following .
In our model, the CO gas located in the region closer to the star has low , that would correspond to the slow spherical component. Thus, in order to avoid such CO gas when computing the fast bipolar component emission profile, we have introduced a lower limit to , .
4 Application of the model. The case of CRL 2688
In order to test our model, we have applied it to a well studied source included in our sample, CRL 2688. First we obtain from the bibliography the values of some input parameters of our model: i) the inclination with respect to the plane of the sky, ii) the ratio between the mayor an the minor axis of the nebula, and iii) the distance to the source. We estimate the value of from the width of the core of the observed emission line, and the rotational temperature from the observed line intensity ratio. Once all these data are obtained, we fit by a method our synthetic profile of the bipolar component to the wings of the observed profile. This way we obtain the only two free parameters: the mass and the maximum expansion velocity of the bipolar component. After a successfully fit is obtained, we are able to obtain the mass of the spherical component of the nebula just by subtracting the bipolar component mass to the total mass. The model is preferably fitted, in the cases in which it is possible, to 13CO lines, since they are optically thinner than those of 12CO. A factor can be introduced as a correction due to opacity and calibration effects.
The results obtained for CRL 2688 are compatible with those obtained by ref1 . For this source they deduce a mass for the bipolar outflows of 0.06, while we obtain 0.11. The main reason for this difference is that we have not taken into account only the wings of the spectra as the emission of the bipolar component, but also the important contribution of the emission at low projected velocities, which is hidden by the most intense emission of the spherical component at the core of the line.
5 Future work
We will use this innovative model and new observational data to obtain the main physical characteristics of the fast bipolar outflows of pre-PNe. Our large sample will help us to find possible relations between them and other observational characteristics already known for these source, and therefore, to obtain a better understanding of how the fast collimated bipolar outflows are formed.
References
- (1) V. Bujarrabal, A. Castro-Carrizo, J. Alcolea, C. Sánchez-Contreras: A&A, 377, 868 (2001)
- (2) S. Matt: The Influence of Poloidal Magnetic Fields on Astrophysicals Outflows. PhD Thesis, University of Washington, Washington (2002)
- (3) R. Sahai, D.C. Hines, J.H. Kastner, et al.: ApJ, 492, L163 (1998)
- (4) R. Sahai, M. Morris, C. Sánchez Contreras, M. Claussen: ArXiv e-prints, 707, arXiv:0707.4662 (2007)