Observation of Seasonal Variations with the MINOS Far Detector
Abstract
An observation of seasonal variations in underground muon rate, , has been performed at Soudan, MN, by the MINOS Far Detector. The four percent fluctuation seen over three years was highly correlated to the temperature variations of the upper atmosphere. The coefficient relating variations in temperature to variations in muon rate was found to be: , which is near the expectation of 0.91.
1 Introduction & Motivation
When cosmic rays interact with molecules in the Troposphere, mesons are produced which either interact again and produce low energy cascades or decay into muons. While the temperature of the Stratosphere varies considerably within the day in areas far from the equator, the temperature of the Troposphere remains nearly constant, slowly changing over longer timescales such as seasons. Increases in temperature of the Troposphere cause increases in volume and atmospheric scale height, thus the height of the primary cosmic ray interaction. The higher in the atmosphere mesons are produced, the more time they have to decay to muons, thus the rate of muons underground will increase as temperature increases [1, 2, 3]. Though this effect has been measured by underground experiments, there has been little agreement with the expectation.
MINOS is a long baseline neutrino oscillation experiment, with a beam and Near Detector at Fermi National Accelerator Laboratory in Batavia, IL. The Far Detector is a 5.4 kt magnetized scintillator and steel tracking calorimeter located 720 m underground (2100 mwe) at the Soudan Underground Mine State Park in Northern Minnesota. Its depth, large acceptance and flat overburden make it possible to observe cosmic-ray induced muons of minimum surface energy 0.7 TeV without preference to direction, and thus detect the small seasonal fluctuations in arrival rate. The seasonal effect is enhanced as muon energy increases, and the large size of the Far Detector allows a significant accumulation of statistics with which to perform this analysis. Additionally, the Far Detector has a magnetic field, which allows the separation of particles by charge, so MINOS will be the first experiment to measure seasonal variations for separate from . The consistency and availability of radiosonde temperature measurements from the NOAA IGRA (Integrated Global Radiosonde Archive [4]) over the duration of the data set ensures a high statistics temperature sample as well, increasing the probability of a positive correlation. The data used in this analysis were collected over three years, from 1 August 2003 - 1 August 2006 for three complete cycles, numbering 24 million muons. The relationship between the temperature and intensity can be expressed as [1]:
| (1) |
where are the fluctuations about . The short lived mesons produced in the upper atmosphere interact or decay as they descend toward the earth. The meson decay channels result in muons with nearly the same energy as the parent meson, while interactions produce lower energy cascades that are filtered by the rock overburden above the Far Detector. These outcomes are energy dependent, separated by the “critical energy” [2]. The “Effective Temperature” () approximates the upper atmosphere as an isothermal body, weighting the temperature of the pressure levels to have a uniform amount of matter. In the scaling limit, is [2]:
| (2) |
where X is the scale height of the atmosphere, and are the nucleon and pion atmospheric attenuation lengths, respectively. For a detector counting discrete particles, the intensity is written , where , the number of muons observed over time , is the effective area, is the efficiency, and is the solid angle observed. Every term but the rate is constant over time, so: . With these definitions and eq. 1, we can write the experimental determination of :
| (3) |
2 The Data
The data for this analysis were accumulated over a three year span, beginning on 1 August, 2003, at a time when the detector was fully operational. Beginning with 40.3 million cosmic ray tracks, a series of cuts were performed [5]. Pre-analysis cuts include: failure of demultiplexing figure of merit, multiple muon (multiple muons aren’t included in the Monte Carlo), “bad run” and bad magnet coil status. Analysis cuts include: track length less than 2 m number of planes less than 20, and either track vertex or end point outside of the fiducial volume of the detector. A total of 24.7 million events survived these cuts for the combined sample. was found using weather data from International Falls, MN weather station. Balloon flights were usually done twice a day, with the maximum height reached at noon and midnight, and sampled temperatures from at least six different heights. Days in which there were not exactly two temperature readings or that both measurements did not reach a column depth of at least were excluded from the data set.
3 Analysis
Upon examination of the data, it was found that on four days there were fluctuations that deviated in an erratic manner. The great stability of the detector over the 1096 days of data and the fact that they were documented by the Control Room Logbook made these days stand out and diagnose as hardware issues. To find the rate for each day, the number of muons counted was divided by that day’s livetime. was calculated for two times each day using the IGRA temperature data and 2, and the error was found by added in quadrature with .
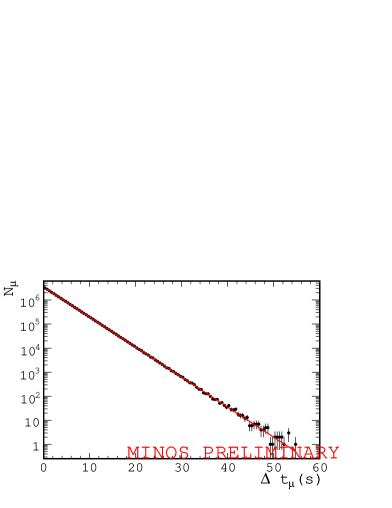
The fit results from Fig. 1 was used to find over three years, 0.287 Hz. Histograms of the deviations from the mean for both and are shown in Fig. 2, binned by day.
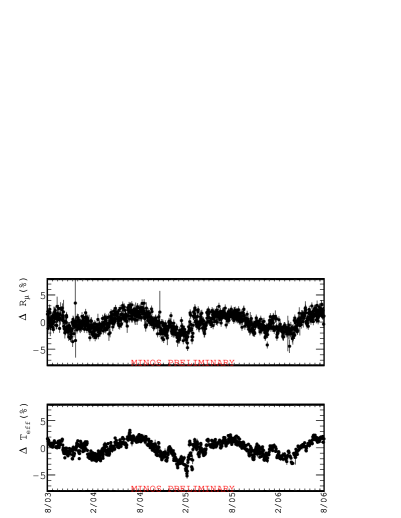
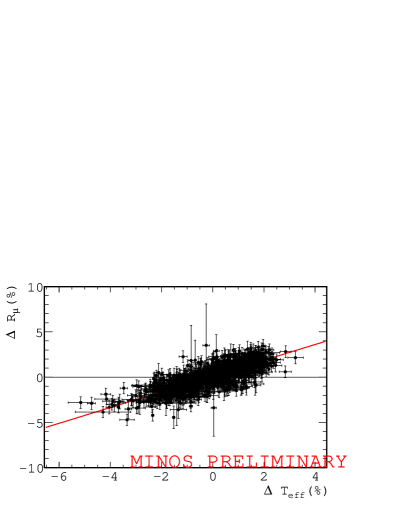
The expected periodic fluctuation in , with maxima in July, minima in January, is very clearly shown, as is a very similar (nearly indistinguishable) fluctuation in . An independent analysis used a smoothed time series, and their results were highly consistent with what is shown here. To quantify the correlation between rate and temperature, a plot of was produced (Fig. 3) and a linear regression was fit using ROOT’s MINUIT fitting package. This package accounts for error bars on both the x and y axis using a numerical minimization method. This fit gives from the slope.
In order to compare our experimental to the theoretical expectation, a simple numerical program was written to find the expected value given by [1]:
| (4) |
Note that this expression is only valid for pions. Future work will involve this kaon contribution, which should lower the expected since kaons are short lived and always decay. A muon energy and were chosen out of the differential muon intensity [6],
| (5) |
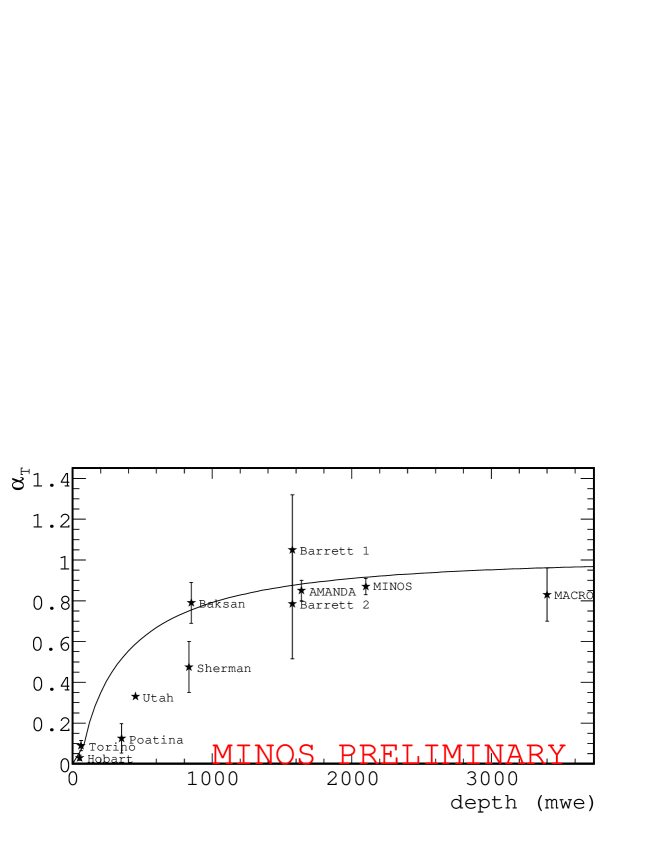
where is the muons spectral index [5]. a random azimuthal angle, was chosen and combined with and Soudan rock overburden map [7] to find the slant depth. The threshold surface energy required for a muon to survive this column depth is found from , where a = 0.45 TeV and for Soudan rock [5], column depth , and if the chosen , it was used in the calculation of the theoretical . This was repeated for 10,000 successful to find for MINOS, which is very near to the experimental value, . To compare the MINOS result with other underground experiments, this process was repeated for standard rock ( and ), flat overburden, and , where H is the detector depth in mwe, using 10,000 successful muons at depths from 0 to 4,000 mwe. The result of this calculation, along with data from other experiments, can be seen in Fig. 4. The MINOS result matches the expectation and has tighter error bars than both recent results, AMANDA ( [3]) and MACRO ( [2]).
The curvature of the track is used to determine the momentum and charge of the particle, so a charge sign confidence cut was required. This cut was charge over momentum divided by the error in the determination of charge over momentum (), determined from previous investigations of the muon charge ratio.
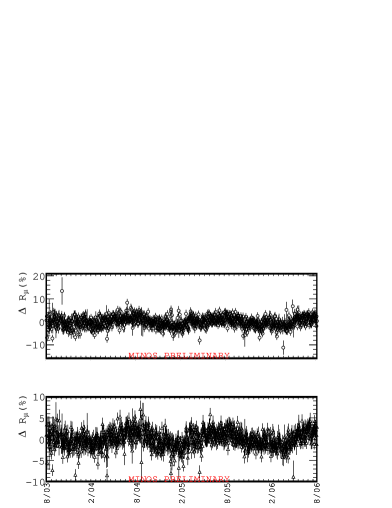
That left 8.8 million events; 5.1 million positive, 3.7 million negative, which is consistent with the published MINOS charge ratio. Fig. 5(t) shows (open triangles) and Fig. 5(b) shows (open circles) over the same time period, binned by day. The sample of muons is smaller than for the sample, thus the error bars on are larger, but the trade off is that the error bars on the temperature are much smaller since the small fluctuations over several days are not washed out. Performing the same fit of as for the sample on separate from resulted in a slope of and respectively. These correspond highly to each other, and are within one sigma of found from the sample.
4 Conclusions
A three year sample of 42 million cosmic ray induced muons has been collected by the MINOS Far Detector and daily rate fluctuations have been compared to daily fluctuations in atmospheric temperature, and these distributions were shown to be highly correlated, with a correlation coefficient of 0.79. The constant of proportionality relating the two distributions, , was found to be , which, within the error band, is in good agreement with the theoretical expectation in the pion-only approximation of . This suggests that the majority of muons seen in the Far Detector were generated by pion parents.
5 Acknowledgments
This work was supported by the U.S. Department of Energy and the University of Minnesota.
References
- [1] Barrett P. et al. Interpretation of cosmic-ray measurements far underground. Reviews of Modern Physics, 24:133–175, 1952.
- [2] M. Ambrosio et al. Seasonal variations in the underground muon intensity as seen by macro. Astropart. Phys., 7:109–124, 1997.
- [3] A. Bouchta. Seasonal variation of the muon flux seen by amanda. Prepared for 26th International Cosmic Ray Conference (ICRC 99), Salt Lake City, UT, 17-25 Aug 1999.
- [4] Durre I. Vose, R. S., and Wuertz D.B. Overview of the integrated global radiosonde archive. Journal of Climate, 19:53–68, 2006.
- [5] S.L. Mufson. Measurement of the atmospheric muon charge ratio at tev energies with minos. In International Cosmic Ray Conference (these proceedings), 2007.
- [6] T. K. Gaisser. Cosmic rays and particle physics. Cambridge, UK: Univ. Pr. (1990) 279 p.
- [7] M. Goodman. Interpretation of the charge ratio in minos. In International Cosmic Ray Conference (these proceedings), 2007.