Searching for Star Formation Outside Galaxies: Multiwavelength Analysis of the Intragroup Medium of HCG100
Abstract
We used multiwavelength data (Hi, FUV, NUV, R) to search for evidence of star formation in the intragroup medium of the Hickson Compact Group 100. We find that young star-forming regions are located in the intergalactic Hi clouds of the compact group which extend to over 130 kpc away from the main galaxies. A tidal dwarf galaxy candidate is located in the densest region of the Hi tail, 61 kpc from the brightest group member and its age is estimated to be only 3.3 Myr. Fifteen other intragroup Hii regions and TDG candidates are detected in the GALEX FUV image and within a field 10′10′ encompassing the Hi tail. They have ages 200 Myr, Hi masses of 109.2-10.4 M⊙, 0.001 SFR 0.01 M⊙ yr-1, and stellar masses 104.3–106.5 M⊙. The Hi clouds to which many of them are associated have column densities about one order of magnitude lower than N(Hi)1021 cm-2.
1 Introduction
The environment of galaxies play an important role on determining their overall properties. One of the most interesting environmental effects is seen in interacting systems which contain stripped Hi gas in the intragroup/intergalactic medium, instead of around galaxies. Three independent studies, Mendes de Oliveira et al. (2004, for the Stephan’s Quintet), Mendes de Oliveira et al. (2006, for HCG 31), Ryan-Weber et al. (2004, for NGC 1533, HCG 16, ESO 149-G003) and Oosterloo et al. (2004, for the loose group around NGC 1490) have surveyed systems with Hi intergalactic clouds and have shown that these are associated with actively star forming regions, the so-called intergalactic Hii regions. These objects seem to be similar to the Hii regions in our Milky Way, but are located in the intragroup medium and have high metallicities (close to solar in most cases). The fate of these types of objects and their importance in galaxy formation and evolution, enrichment of the intergalactic medium and globular cluster formation is still debatable. In order to better address these issues, we embarked on a multiwavelength analysis of the environment of interacting systems and present here the results based on FUV, NUV, optical, and Hi data of a Hickson compact group, HCG100.
The last group in Hickson’s catalog of compact groups of galaxies (Hickson 1982) is at vR = 5336 km/s (z=0.0178, Hickson et al. 1992) and it is formed by four late-type galaxies with accordant redshifts: a bright central Sb galaxy (HCG100a), an irregular galaxy with an optical tidal tail (HCG100b), a late-type barred spiral (HCG100c) with central H emission (Vilchez & Iglesias-Páramo 1998) and a late-type edge-on spiral (HCG100d). HCG100a, b and c show strong evidence of interaction, demonstrated not only by peculiarities in their morphologies but also in their velocity fields (Plana et al. 2003). H100b shows a tidal tail connecting with a faint galaxy not originally classified as a member of the group by Hickson. Past encounters are also confirmed by an extended Hi tail (Verdes-Montenegro et al. 2006). Therefore, the well-advanced dynamical state of HCG100 makes it an ideal target for searching for intergalactic Hii regions that might have been triggered by tidal interaction.
This paper is organized as follows: §2 describes the data, §3 discusses the age, masses and star formation rate estimates, §3.1 and §3.2 compare the intragroup regions in HCG100 with other intergalactic Hii regions and high UV-luminous galaxies. Finally, §4 summarizes the main conclusions. Throughout this paper, we use a cosmology with , and . Magnitudes are given in the AB-system and the adopted distance to HCG100 is 76.3 Mpc.
2 The data
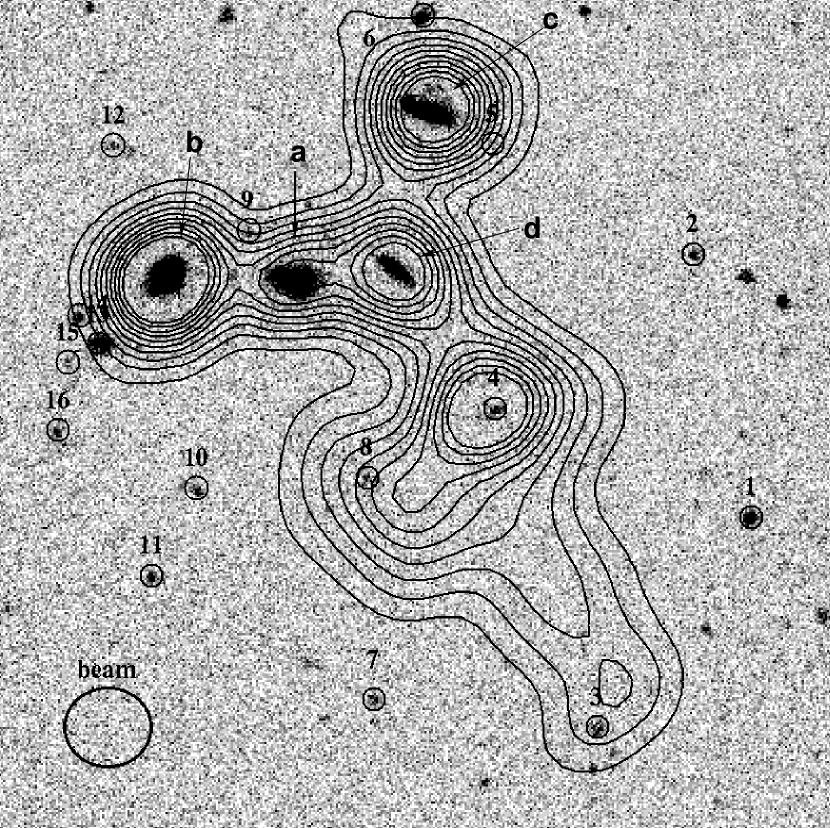
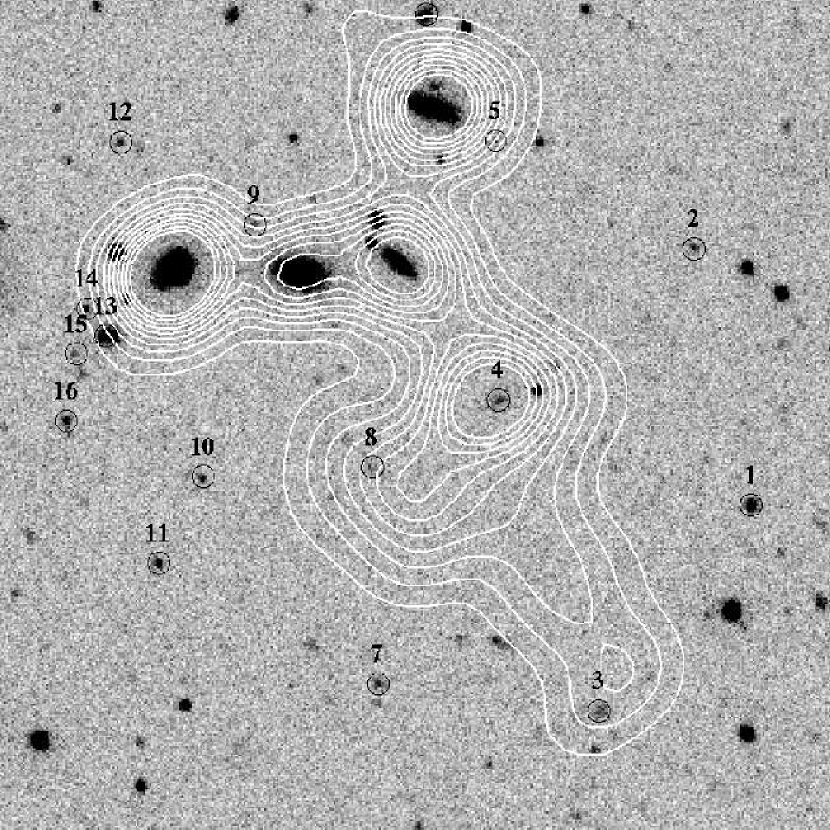
HCG100 was observed with the Galaxy Evolution Explorer (GALEX) mission in the far and near ultraviolet (FUV eff=1528Å, NUV eff=2271Å) as part of our Cycle 1 program (GI#73) to observe compact groups of galaxies. In Fig. 1 and Fig.2 we show a cutout of a 10′ 10′ window of the FUV and NUV images (GALEX field of view is 1∘.28 and 1∘.24 in FUV and NUV, respectively and pixel scale is 1.5 arcsec pixel-1) together with the distribution of atomic hydrogen Hi (PI Verdes-Montenegro).
We have also obtained an R-band image with the CTIO Blanco 4m telescope and a mosaic II CCD imager. Three 300s images of the group were taken, at a median seeing of 1.1′′. Each frame covered a 40 arcmin field on a side, at a pixel scale of 0.27′′/pixel, but we only used a 10 arcmin field around the object, given that this was the area of interest. The data was bias subtracted and flat fielded using standard procedures (using the package mscred in IRAF111IRAF is distributed by the National Optical Astronomy Observatories, which are operated by the Association of Universities for Research in Astronomy, Inc., under cooperative agreement with the National Science Foundation.). A flatfield was constructed from a combination of dark sky frames and twilight flats which worked well, given that the background, after flatfielding was done, showed an rms variation no greater than 1% over the whole field. The night was not photometric and therefore no calibration stars were observed. Instead, we chose to use two galaxies previously observed by Rubin et al. (1991), HCG 100c and HCG 100d, for obtaining the zero point of the photometry (see below).
2.1 Flux Calibration
FUV and NUV fluxes were calculated using Morrissey et al. (2005) mλ=-2.5 log[Fλ/aλ] + bλ, where aFUV = 1.4 10-15 erg s-1 cm-2 Å-1, aNUV=2.06 10-16 erg s-1 cm-2 Å-1, bFUV=18.82 and bNUV=20.08 for FUV and NUV, respectively. Fluxes were multiplied by the effective filter bandpass (FUV=269Å and NUV=616Å) to give units of erg s-1 cm-2 and luminosities were calculated for a distance D=76.3 Mpc.
The R-band image was calibrated to match Rubin et al. (1991) magnitudes for galaxies HCG100c and HCG100d. Total integrated R magnitudes of these objects are given in their Table 3 (no errors were quoted), and these were compared with the total instrumental magnitudes we obtained for these galaxies using two methods: (1) through aperture photometry in IRAF (using the task daophot.phot) and (2) using the program SExtractor (Bertin and Arnouts et al. 1996). The zero points obtained for each of these objects, and for each method, agreed within 0.1 mag, and we used an average of the values as our final zero point. The lack of a proper calibration, does not significantly change our results as shown in § 3.
The Hi data taken with the VLA (configuration D, PI Verdes-Montenegro) is not able to resolve the intragroup objects since the beamwidth is 61.0′′55.23′′ (22.6 kpc 20.4 kpc at 76.3 Mpc) and objects have sizes 16′′. Therefore, our measurements of the Hi fluxes were centered on the FUV detections but measured within one beam. Fluxes were converted into mass by using the relation:
| (1) |
where is the distance to the group in Mpc, is the Hi flux in Jy km/s.
Column Densities were calculated by applying the following relation
| (2) |
where =beamwidth in arcmin2, is the wavelength (21cm) and F is the Hi flux density in Jy/beam km/s (Rohlfs & Wilson 2000).
2.2 Source Detection
We used SExtractor (SE, Bertin & Arnouts 1996) to detect sources in the FUV and matched that catalog with the NUV and R-band catalogs. Therefore, only objects with FUV detections were included in our final catalog. In this paper we concentrate on all objects which were detected in a region of 10′ 10′ centered on the Hi tail (Verdes-Montenegro et al. 2006).
We used SE’s Kron elliptical apertures to measure magnitudes (mag-auto) in FUV, NUV and R-bands. Although mag-auto is often used to measure total magnitudes in galaxy surveys (e.g. Bell et al. 2004, de Mello et al. 2006, Zucca et al. 2006), high uncertainties might be expected at the faint magnitudes due to the assumption that the sky background has Gaussian random noise without source confusion (Brown et al. 2007). However, since we are comparing data taken with different resolutions and the fact that UV light does not necessarily peak at the same coordinate as the optical light, mag-auto performs better than the other SExtractor choices, as long as a careful match between the different catalogs is performed. We matched the coordinates of the sources in the 3-bands within 1′′ to 5′′ and after visually checking each identification we chose 3′′ as our best matched catalog with FUV, NUV and R-detections. The cross-match in the three bands resulted not only in the four most luminous members of HCG 100 (Table 1) but also 16 other objects, within the 10′10′ field (Table 2).
Nine of these sources are within the Hi tail: # 3 is the most distant object from the group (381 arcsec or 137.2 kpc from HCG100a) and is located in the southern tip of the Hi tail, #4 is far from all of the brightest members of the group and located in the densest Hi region, #5 and #6 are close to HCG100c, #8 is isolated and 150 arcsec (53.9 kpc) from HCG100a, #9 is close to HCG100a, #13 is a small galaxy not originally classified as a member of the HCG100 and located in the optical tidal tail of HCG100b, #14 and #15 are also close to the tidal tail. The other six objects have no Hi detection but are still within the chosen field.
SE’s magnitudes in FUV, NUV and R (mag-auto) were corrected for foreground Galactic extinction using E(B-V)=0.081 and AR=E(B-V)2.634 (Schlegel et al. 1998), AFUV=E(B-V)8.29 and ANUV=E(B-V)8.18 (Seibert et al. 2005).
In Table 3 we list the Hi mass per beam in the vicinity of nine of the intragroup objects detected, the other 7 objects are below the detection limit (). However, it is important to note that, due to the low resolution of the data, the HI masses of the objects near large galaxies are contaminated by the HI masses of the latter. Only objects #3, #4 and #8 are far away from bright members of the group and this contamination could be avoided. Objects #13, #14, #15 besides being close to H100b are within the same beam, therefore the HI masses listed in Table 3 are not the individual masses of each object but the total mass within one beam centered in that region.
As seen in Fig.1 most of the intragroup objects are located in the outskirts of the Hi contours where column densities range from 7.5 to 5 cm-2, except for object #4 which is located in a peak of Hi where NHi is 1.2 cm-2. Therefore, Hi clouds to which many of them are associated have column densities about one order of magnitude lower than the N(HI)1021 cm-2, value thought to be required for triggering star formation (e.g. Skillman et al. 1988). Due to the low resolution of the HI data, all values are lower limits to the true HI column density.
| ID | Morphologya | Velocityb | FUVc | NUV | Rd | FUVcorre | NUVcorr |
|---|---|---|---|---|---|---|---|
| HCG100 a | Sb | 5323 | 17.30 | 16.78 | 12.5 | 16.12 | 16.63 |
| HCG100 b | Sm | 5163 | 17.49 | 17.10 | 14.1 | 16.44 | 16.82 |
| HCG100 c | SBc | 5418 | 18.46 | 17.91 | 14.7 | 17.25 | 17.79 |
| HCG100 d | Scd | 19.08 | 18.65 | 15.5 | 17.99 | 18.41 |
| ID | RA | Dec | Ra | NUV | FUV | FUV-R | FUV-NUV |
|---|---|---|---|---|---|---|---|
| 1 | 0.2410 | 13.0647 | 18.80 0.01 | 20.56 0.04 | 20.44 0.06 | 1.64 0.06 | -0.12 0.07 |
| 2 | 0.2526 | 13.1161 | 19.54 0.01 | 21.61 0.08 | 21.48 0.10 | 1.94 0.10 | -0.13 0.13 |
| 3 | 0.2722 | 13.0236 | 19.09 0.01 | 21.61 0.08 | 21.21 0.09 | 2.12 0.09 | -0.40 0.12 |
| 4 | 0.2929 | 13.0859 | 20.25 0.04 | 21.26 0.07 | 21.09 0.09 | 0.84 0.10 | -0.17 0.12 |
| 5 | 0.2933 | 13.1377 | 19.42 0.01 | 22.43 0.15 | 22.79 0.22 | 3.37 0.22 | 0.36 0.27 |
| 6 | 0.3076 | 13.1630 | 17.48 0.00 | 20.19 0.03 | 20.20 0.05 | 2.72 0.05 | 0.01 0.06 |
| 7 | 0.3176 | 13.0290 | 18.43 0.00 | 22.85 0.11 | 21.70 0.12 | 3.27 0.12 | -1.15 0.16 |
| 8 | 0.3188 | 13.0724 | 20.39 0.01 | 22.49 0.13 | 21.18 0.11 | 0.79 0.11 | -1.31 0.17 |
| 9 | 0.3429 | 13.1208 | 20.35 0.01 | 22.24 0.11 | 22.10 0.16 | 1.75 0.16 | -0.15 0.19 |
| 10 | 0.3535 | 13.0704 | 19.75 0.01 | 21.92 0.09 | 21.66 0.11 | 1.91 0.11 | -0.26 0.14 |
| 11 | 0.3627 | 13.0532 | 19.42 0.01 | 21.63 0.07 | 21.62 0.10 | 2.20 0.10 | -0.01 0.12 |
| 12 | 0.3704 | 13.1375 | 18.88 0.00 | 22.15 0.09 | 21.98 0.14 | 3.10 0.14 | -0.18 0.17 |
| 13b | 0.3735 | 13.0986 | 17.69 0.00 | 19.63 0.02 | 19.59 0.04 | 1.90 0.04 | -0.04 0.04 |
| 13A | 0.3738 | 13.0987 | 17.83 0.01 | 19.78 0.05 | 19.81 0.17 | 1.98 0.17 | 0.03 0.18 |
| 13B | 0.3719 | 13.0984 | 17.77 0.01 | 19.62 0.04 | 19.83 0.04 | 2.06 0.04 | 0.22 0.06 |
| 14 | 0.3773 | 13.1041 | 20.42 0.01 | 21.63 0.08 | 21.10 0.09 | 0.69 0.09 | -0.53 0.12 |
| 15 | 0.3796 | 13.0950 | 19.52 0.01 | 22.04 0.12 | 21.79 0.14 | 2.27 0.14 | -0.25 0.19 |
| 16 | 0.3816 | 13.0817 | 18.89 0.00 | 21.55 0.06 | 21.30 0.11 | 2.41 0.11 | -0.24 0.12 |
| ID | LFUV (erg/s)a | LNUV (erg/s) | ageb | SFRFUV c | SFRNUV | log(M∗)d | log(MHI)e | Sepf | log I1530g |
|---|---|---|---|---|---|---|---|---|---|
| 1 | 5.90E+040 | 5.70E+040 | 3.9 | 0.005 | 0.007 | 5.0 | 131.2 | 6.02 | |
| 2 | 2.27E+040 | 2.16E+040 | 3.8 | 0.002 | 0.003 | 4.6 | 102.2 | 5.91 | |
| 3 | 2.91E+040 | 2.17E+040 | 1 | 0.002 | 0.003 | 4.7 | 9.6 | 137.2 | 5.90 |
| 4 | 3.25E+040 | 2.98E+040 | 3.3 | 0.003 | 0.004 | 4.7 | 10.4 | 60.7 | 5.35 |
| 5 | 6.79E+039 | 1.02E+040 | 194.1 | 0.001 | 0.001 | 6.5 | 9.9 | 61.2 | 4.99 |
| 6 | 7.41E+040 | 8.01E+040 | 26.9 | 0.006 | 0.010 | 6.3 | 9.2 | 74.7 | 6.31 |
| 7 | 1.84E+040 | 6.90E+039 | 1 | 0.001 | 0.001 | 4.5 | 108.5 | 5.51 | |
| 8 | 2.98E+040 | 9.62E+039 | 1 | 0.002 | 0.001 | 4.7 | 10.0 | 53.9 | 5.31 |
| 9 | 1.28E+040 | 1.21E+040 | 3.5 | 0.001 | 0.001 | 4.6 | 9.8 | 17.5 | 5.80 |
| 10 | 1.92E+040 | 1.63E+040 | 2.9 | 0.002 | 0.002 | 4.4 | 58.8 | 5.97 | |
| 11 | 2.00E+040 | 2.13E+040 | 21.0 | 0.002 | 0.003 | 5.6 | 83.7 | 5.85 | |
| 12 | 1.43E+040 | 1.31E+040 | 3.2 | 0.001 | 0.002 | 4.3 | 58.0 | 5.95 | |
| 13 | 1.29E+041 | 1.35E+041 | 13.7 | 0.010 | 0.016 | 6.2 | 9.5 | 53.3 | 6.67 |
| 13 A | 1.03E+041 | 1.36E+041 | 118.7 | 0.008 | 0.017 | 6.51 | |||
| 13 B | 1.06E+041 | 1.17E+041 | 33.8 | 0.008 | 0.014 | 6.50 | |||
| 14 | 3.22E+040 | 2.13E+040 | 1 | 0.003 | 0.003 | 4.8 | 9.5 | 56.3 | 6.30 |
| 15 | 1.70E+040 | 1.46E+040 | 2.9 | 0.001 | 0.002 | 4.3 | 9.5 | 62.1 | 5.07 |
| 16 | 2.67E+040 | 2.29E+040 | 2.9 | 0.002 | 0.003 | 4.5 | 72.0 | 5.26 |
3 Analysis
We used the broad-band colors generated from stellar populations models by Thilker et al. (2007) to estimate the ages of the intragroup sources. Thilker et al. models are optimized for GALEX filters transmission curves and have been extensively tested using GALEX data (Bianchi et al. 2007).
In Fig.3 we plot FUV–NUV colors of our sample and FUV–NUV color predictions as a function of age assuming a Milky Way internal extinction, (E(B-V)=0.2) and without any extinction correction (Thilker et al. 2007). It is clear that all intragroup objects are younger than 200 Myr. Four objects are not included in the logarithmic scale of Fig.3, they have ages 1 Myr old and are probably more affected by extinction since the first 2 Myrs after the stellar birth are strongly affected by dust obscuration. In Table 3 we list their ages, assuming a Milky Way internal extinction (E(B-V)=0.2) for all objects. However, for many of them the internal extinction is higher than the Milky Way value, as seen in the color-color plot shown in Fig.4. We have not attempted to estimate the intrinsic extinction individually since the three colors we have are either too close to each other (FUV and NUV) or too far apart (NUV and R). In any case, the ages of all objects are 200 Myr and will not reach older ages even if assuming extinction values such as AFUV=2.03, ANUV=1.46 used to age-dating Sloan Digital Sky Survey (SDSS) galaxies detected with GALEX (Salim et al. 2005). The UV-detection of these objects suggests that the energetic O-star winds have blown out the natal cocoon veiling most of the massive stars (Leitherer 2005). In Fig.4 we also plot FUV-R colors assuming an error of 0.2 magnitudes in the R-band magnitudes (triangles and squares) confirming that an object 0.2 magnitudes brighter or fainter in R have slightly higher or lower predicted ages if we had used FUV-R as an age indicator. Since we used FUV-NUV as an age indicator our results are not affected by errors in the photometry of the R-band image.
As discussed in Kennicutt (1998) the broadband optical luminosity by itself is a poor tracer of the star formation rate (SFR) and the UV wavelengths where the integrated spectrum is dominated by young stars gives a better estimate of the SFR. In Table 3 we list the SFRs which were derived following Iglesias-Páramo et al. (2006)222SFRs are derived using Starburst99 models (solar metallicity, Salpeter IMF from 0.1 to 100 M⊙) adapted to the GALEX bands. without applying internal extinction correction to the UV flux. The SFR using FUV and NUV are similar except for objects #6 and #13. This could be due to the fact that the latter object has double nuclei and is probably a merger of two small objects, whereas the former object is the largest object in the sample and probably a dwarf galaxy. Therefore, the instantaneous star-formation law used to derive the SFR might not be suited to their stellar populations. If they have had several bursts of star-formation in the recent past, the FUV gives a more robust indicator of SFR than NUV since it is not contaminated by previous star formation. As shown in Salim et al. (2005) the NUV-R is a good tracer of the star formation history of a galaxy, i.e. it is proportional to the ratio between the current SFR over the past-average SFR. If we assume Salim et al. average value of extinction (ANUV=1.46), all objects in our sample have NUV-R typical of galaxies undergoing a burst.
We have also calculated SFRFUV using Calzetti (2001) values of extinction for starburst galaxies. The average SFRFUV of the intragroup objects is as low as 0.01 M⊙ yr-1, and as high as 0.4 M⊙ yr-1, if we use the A1500 = 1.6 (Calzetti’s UV-selected starbursts) and A1500 = 4.1 (Calzetti’s average dust-rich starbursts), respectively. Therefore, the SFR of the intragroup objects is modest even if a high extinction correction is applied.
We used the ages obtained from Thilker et al. and the FUV luminosity to estimate the stellar masses with Starburst99 models (Leitherer et al. 1999). The stellar masses were obtained from Starburst99’s monochromatic luminosity, L1530, for an instantaneous burst, Salpeter IMF, solar metallicity, and standard input parameters are listed in Table 3. We chose an instantaneous burst instead of continuous star-formation, since we are estimating the mass from the FUV luminosity which is dominated by the young and massive stars. Therefore, low mass stars were not taken into consideration in the stellar mass calculation.
3.1 Comparison with Intergalactic HII Regions and TDGs
Tidal dwarf galaxies (TDGs) are found in the tip of the optical tails as well as along tidal features (e.g. Duc et al. 1997, Weilbacher et al. 2000, Knierman, et al. 2003, Bornaud et al. 2004). More recently, they have been identified in ongoing galaxy mergers where the FUV emission is seen to be associated with the Hi tidal tails (Hibbard et al. 2005), extending large distances beyond the optical extent (Neff et al. 2005). One of our objects, #4, is similar to Neff et al.’s TDGs. It is located in the Hi tail and where the Hi column density peaks. It has an Hi mass 1010.4 M⊙/beam in the vicinity and age 3.3 Myr. What is interesting for this object and also object #3, is their location with respect to the group members; object #4 is 61 kpc away from HCG100a and object #3 is at the very tip of the HI tail, 137 kpc away from HCG100a.
The TDG-candidate found in HCG100 (object #4) described above and other TDGs found in other systems with Hi tails are located far away from the group members and have young ages. For instance, the triplet formed by NGC7771, NGC7770 and NGC7769 observed with GALEX has a 3 Myr old TDG candidate within the 100 kpc Hi tail (Neff et al 2005). Another compact group, HCG31 has a TDG 40 kpc away from the parent galaxy (Mendes de Oliveira et al. 2006) and is also located in a peak of Hi in the gas tail .
The tidal material in interacting systems is expected to remain bound to the system. Some of it will fall back onto the remnant and some will stay detached (20% of NGC7252 tidal material will stay detached, according to Hibbard & Mihos 1995) for as long as a Hubble time. According to Verdes-Montenegro et al.’s (2005) proposed evolutionary scenario for compact groups, HCG100 is in phase 2, when multiple tidal tails form and a large amount of atomic gas is found in the intragroup medium. In phase 3 of the evolutionary path, galaxies will lose Hi gas and an Hi deficient group will be produced (Sulentic et al. 2001, Williams et al. 2002). Based on our results we suggest that at least a fraction of the tidal gas is used to form intragroup objects such as the ones within the Hi tail.
Moreover, considering the distance between the star forming regions and the group members and the young ages of the stellar population, we are witnessing the in “situ” star-formation within the Hi tidal tail and can rule out the possibility of formation in the outskirts of the group galaxies and later ejection to the intragroup medium.
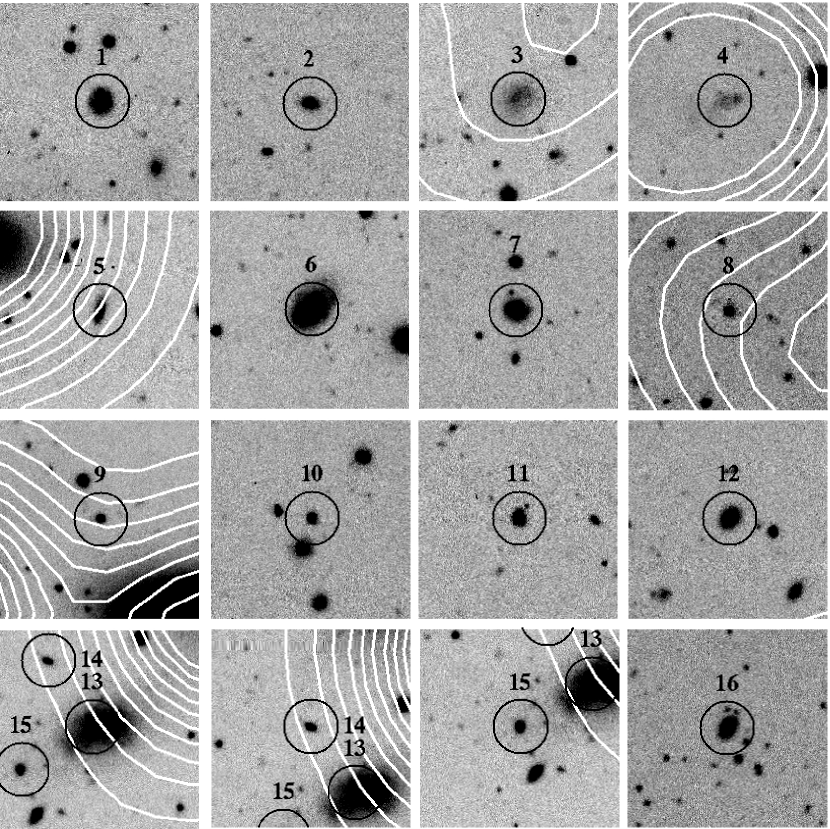
As shown in the R-band images (Fig.5), objects #3 and #4 resemble low surface brightness galaxies, whereas the others are either small round objects (#8, #9, #10, and #15), but larger than the images’ PSF, or have morphologies similar to objects found in the tail region of Stephan’s Quintet (Mendes de Oliveira et al. 2004). We cannot rule out the possibility that these objects are not related to the group and only with spectroscopy we will be able to tell whether they are group members or not. However, if found to be bound to HCG100, as the intergalactic Hii regions in Stephan’s Quintet are, the intragroup medium of HCG100 is actively forming stars as far as 137 kpc away from the galaxies. The SFRs are modest, 0.001–0.02 M⊙ yr-1, but similar to IHii regions found by Ryan-Weber et al. (2004) at distances up to 33 kpc from NGC 1533 and by Sakai et al. (2002) at distances of 155 kpc in the A1367 cluster.
The stellar masses of our sources (Table 3) range between 104.3–106.5 M⊙. The large spread in masses can be interpreted as a sign of evolution or different population of objects. In the first scenario, some of the objects are still in the process of formation and have not converted all the gas supply into stars as Duc & Mirabel (1997) suggested for TDGs. In the second scenario, we are detecting two populations of objects: TDGs and IHii regions. The low–mass objects are the IHii regions and high–mass objects are TDGs. One caveat to keep in mind is the fact that the stellar masses can be higher than what we obtained, since the intrinsic extinction for some objects is probably higher than the Milky Way value used to estimate their age. Higher extinction correction would make them more UV luminous and therefore more massive.
3.2 Comparison with high-z galaxies
Since the intragroup objects were UV-selected, we have compared them with a class of objects which is also selected by their UV emission but are at high redshifts, the Lyman Break Galaxies (LBGs, Steidel et al. 1995). LBGs are star-forming galaxies at , they are relatively small (rh=1-3 kpc), have relatively low mass (109.5-11M⊙) and low extinction. LBGs are thought to be the building blocks of larger systems proposed by the hierarchical clustering scenario of galaxy formation and evolution (Kauffmann et al. 1993). The fate of intragroup objects might be similar, since at least some are likely to be accreted by the larger galaxies in the group. HCG100a, for instance, may have already suffered a major accretion event, given its very peculiar velocity field (Plana et al. 2003).
Recently, Hoopes et al. (2007) identified a sample of the local equivalents of LBGs using images from the UV satellite GALEX and spectroscopy from the SDSS. Among the UV-luminous galaxy (UVLGs) population, they found a subset of supercompact galaxies that are similar to LBGs. As shown in Table 4, the intragroup objects in HCG100 are not as UV-luminous as UVLGs and LBGs and also form stars in a much lower rate than those. This might be an evolutionary effect suggesting that objects in the intragroup medium are less efficient in forming stars than LBGs and UVLGs.
4 Conclusions
We have analyzed the UV and optical light in combination with the Hi gas within the compact group of galaxies HCG100 and identified 16 star-forming regions in the intragroup region. The young age ( Myr) of these objects and the proximity to the tidal tail connects the OB stars formation time scale (108 yr) with the dynamic time scale of the tidal features. Moreover, the Hi clouds to which many of them are associated have column densities about one order of magnitude lower than the N(HI)1021 cm-2 thought to be required for triggering star formation. So, in these cases, we have a strong indication that the Hi clouds must have suffered recent collisions which could have then triggered the star formation process. Based on their ages, stellar masses and Hi masses in their vicinities, we conclude that some of these objects are tidal dwarf galaxies with ongoing star formation and some are intergalactic HII regions or conglomeration of stellar clusters.
Although we have an estimate of the amount of neutral gas in these objects, the main ingredient in the star-formation process, the molecular gas, is unknown for these objects. From CO observations of tidal dwarf galaxies (TDGs), Braine et al. (2001) provided strong evidence that TDGs are self-gravitating entities with large amounts of atomic gas which will transform into molecular gas and subsequently form stars. CO observations together with spectroscopy of these objects will be of great value in understanding their nature. For instance, we cannot exclude the possibility that some of these objects are not associated with HCG100, but at least those falling within HI density peaks are likely to be associated with the group. Moreover, we will be able to estimate metallicity of these newly formed regions and evaluate the enrichment level of the processed gas in the intragroup medium.
| Parametera | Large UVLGs | Compact UVLGs | LBGs | HCG100 IGs |
|---|---|---|---|---|
| log L1530 (L⊙) | 10.3 to 11.2 | 10.3 to 11.0 | 10.3 to 10.9 | 8 to 9 |
| log I1530 (L⊙ kpc-2) b | 6.0 to 8.0 | 8.0 to 10.3 | 9.0 to 10.3 | 5.6 to 8.3 |
| log SFR (M⊙ yr-1) c | 0 to 1.5 | 0.2 to 2.0 | 0.5 to 2.0 | -2 to -0.4 |
| FUV-R d | 1.0 to 3.5 | 0.2 to 2.8 | 0.2 to 1.7 | 0.7 to 3.4 f |


References
- (1) Bell, E.F., et al. 2004, ApJ, 608, 752
- Bertin et al. (1996) Bertin, E., & Arnouts, S. 1996, A&AS, 117, 393
- (3) Bianchi, L. et al. (2007), ApJS in press (GALEX special issue), astro-ph/0611926
- (4) Bournaud, F., Duc, P.-A., Amram, P., Combes, F., & Gach, J.-L. 2004, A&A, 425, 813
- (5) Braine, J. Duc, P-A., Lisenfeld, U., et al. 2001, A&A, 378, 51
- (6) Brown, M.J.I., et al. 2007, ApJ, 654, 858
- Calzetti et al. (2001) Calzetti, D. 2001, PASP, 113, 1449
- (8) de Mello, D.F., Dahlen, T., Gardner, J.P., Grogin, N.A. 2006, AJ, 132, 2014
- (9) Duc, P-A., & Mirabel, I.F. 1997, The Messenger 89, 14
- (10) Hibbard, J.E., & Mihos, J.C. 1995, AJ, 110, 140
- (11) Hibbard, J.E., et al. 2005, ApJ, 619, L87
- (12) Hickson, P., Mendes de Oliveira, C., Huchra, J.P. & Palumbo, G.G. 1992, ApJ, 399, 353
- (13) Hoopes, C.G., et al. 2007, submitted astro-ph0609415
- (14) Iglesias-Páramo, J., et al. 2006, ApJ, 164, 38
- Kauffmann et al. (1993) Kauffmann, G., White, S. D. M., & Guiderdoni, B. 1993, MNRAS, 264, 201
- (16) Knierman, K.A., et al. 2003, AJ, 126, 1227
- (17) Kennicutt, R.C. 1998, ARA&A, 36, 189
- (18) Leitherer, C. et al. 1999, ApJS, 123, 3
- (19) Leitherer, C. 2005 in The Spectral Energy Distribution of Gas Rich Galaxies, ed. C. C. Popescu & R. J. Tuffs (Melville: AIP), 39
- (20) Mendes de Oliveira, C., Cypriano, E.S., & Sodré,L. Jr, Balkowski, C. 2004, ApJ, L17
- (21) Mendes de Oliveira, C., Temporin S., Cypriano, E.S., Plana, H., Amram, P., & Sodré,L. Jr, Balkowski, C. 2006, AJ, 132, 570
- (22) Neff, S.G., et al. 2005, ApJ, 619, L91
- Oosterloo et al. (2004) Oosterloo, R., et al. 2004 in ‘Recycling Intergalactic and Interstellar Matter’ IAUS 217. Eds., P-A Duc, J. Braine, & E. Brinks, 486, 492
- (24) Plana, H., Amram, P., Mendes de Oliveira, C., Balkowski, C., & Boulesteix, J. 2003, AJ, 125, 1736
- (25) Rohlfs, K., & Wilson, T.L. 2000 Tools of Radio Astronomy. Springer-Verlag Berlin Heidelberg New York.
- Rubin et al. (1991) Rubin, V.C., Hunter, D.A., & Fordk, W.K.J. 1991, ApJSS, 76, 153
- RyanWeber et al. (2004) Ryan-Weber, E.V., Meuerer,G.R., Freeman, K.C., Putman, M.E., & Webster, R.L. 2004, AJ, 127, 1431
- (28) Salim, S., et al. 2005, ApJ, 619, L39
- (29) Sakai, S., Kennicutt, R.C., van der Huls, J.M., & Moss, C. 2002, ApJ, 578, 842
- (30) Schelegel, D.J., Finkbeiner, D.P., & Davis, M. 1998, ApJ 500, 525
- Seibert et al. (2005) Seibert et al. 2005, ApJ 619, L55
- (32) Skillman, E.D., Terlevich, R., Teuben, P.J., & van Woerden, H. 1988, A&A, 198, 33
- Steidel (1995) Steidel, C. C., Pettini, M., & Hamilton, D. 1995, AJ, 119, 2519
- (34) Sulentic, J.W., Rosado, M., Dultzn-Hacyan, D., et al. 2001, AJ, 122, 2993
- (35) Thilker et al. 2007, submitted
- (36) Verdes-Montenegro, L., Del Olmo, A., Yun, M.S., & Perea, J. 2005, A&A, 443, 464
- (37) Verdes-Montenegro, L., Yun, M.S., & Borthakur, S. 2006, in ‘Galaxy Evolution Across the Hubble Time’ IAUS 235, #399
- (38) Vilchez, J.M., & Iglesias-Páramo, J. 1998, ApJS, 117, 1
- (39) Weilbacher, P. M., Duc, P.-A., Fritze v. Alvensleben, U., Martin, P., & Fricke, K. J. 200, A&A, 358, 819
- (40) Williams, B.A., Yun, M.S., & Verdes-Montenegro, L. 2002, AJ, 123, 2417
- (41) Zucca, E., et al. 2006, A&A, 455, 879