Extracting longitudinal shower development information from crystal calorimetry plus tracking
Abstract
We present an approach to derive longitudinal shower development information from the longitudinally unsegmented BABAR electromagnetic calorimeter by using tracking information. Our algorithm takes advantage of the good three-dimensional tracking resolution of BABAR, which provides an independent geometric constraint on the shower as measured in the BABAR crystal calorimeter. We show that adding the derived longitudinal shower development information to standard particle identification algorithms significantly improves the low-momentum separation of pions from electrons and muons. We also verify that the energy dependence of the electromagnetic shower development we measure is consistent with the prediction of a standard electromagnetic shower model.
keywords:
Particle Identification , Longitudinal Shower Depth , Electromagnetic Calorimetry , TrackingPACS:
29.40.Gx , 29.40.Vj , 07.05.Kf, ,
1 Introduction
In present-day nuclear and particle physics experiments, inorganic scintillating crystals, such as NaI(Tl) and CsI(Tl), are often used to construct electromagnetic calorimeters when a precise measurement of the energy is required [1]. Crystal calorimeters can be finely segmented in the dimension transverse to the shower development without sacrificing energy resolution, thus providing a good measurement of the lateral shower development. However, engineering and energy resolution considerations prevent finely segmenting crystal calorimeters along the direction of shower development. Both lateral and longitudinal shower development information are useful in charged particle identification (PID) algorithms, particularly in electron identification. Because crystal calorimeters cannot provide direct longitudinal shower development information, they lose an important input to particle identification.
In this paper, we present a technique in which longitudinal shower development information is indirectly extracted from a longitudinally unsegmented crystal calorimeter in conjunction with a precise tracking system. This technique was developed for use with the BABAR [2] detector, but it can be applied at any detector which combines crystal calorimetry and precision tracking. It exploits the fact that BABAR has a tracking system capable of precisely determining the three-dimensional trajectory of charged particles, and the fact that these trajectories are not in general collinear with the crystal axes. A similar algorithm has previously been used for sampling calorimeters with fine lateral segmentation [3].
We also explore the usefulness of the derived longitudinal shower information for particle identification at BABAR. We show that using this information as part of an electron identification algorithm improves the electron vs. pion discrimination, particularly at momenta below 600 . We also show that this information can be generally used to improve the separation of the five most common charged particles (, , , and ), owing to the different longitudinal shower development in a crystal calorimeter of these different particle types. In particular, we find that the longitudinal shower information significantly increases the minimum momentum reach at which muons can be separated from pions in BABAR.
We further verify that the energy dependence of the indirect electron longitudinal shower information behaves as expected from electromagnetic shower models.
2 The BABAR Detector
The BABAR detector consists of a tracking system surrounded by a dedicated PID device, a crystal calorimeter, and an array of flux return iron plates instrumented with muon detectors. A detailed description of the BABAR detector can be found in Ref. [2], here we briefly describe those systems important for the algorithms described in this paper.
The BABAR tracking system is composed of a silicon vertex tracker (SVT) comprising five layers of double-sided detectors and a 40-layer central drift chamber (DCH). Operating in a 1.5 T solenoidal magnetic field, it provides a transverse momentum () resolution
| (1) |
for detecting charged particles, where and its rms error are measured in . Both the DCH and the SVT measure the specific ionization () of charged particles which pass through them. The resolution from the DCH varies as a function of track polar angle, having an average value of around for the majority of physics processes that we study in BABAR. The resolution from the SVT is typically about .
The BABAR ring-imaging Cherenkov detector (DIRC) provides dedicated charged particle identification in the central part of the detector. The polar angle coverage in the laboratory frame is . The Cherenkov angle resolution of the DIRC is measured to be , for the quartz refractive index of 1.473, which provides better than separation between charged kaons and pions over a broad kinematic range.
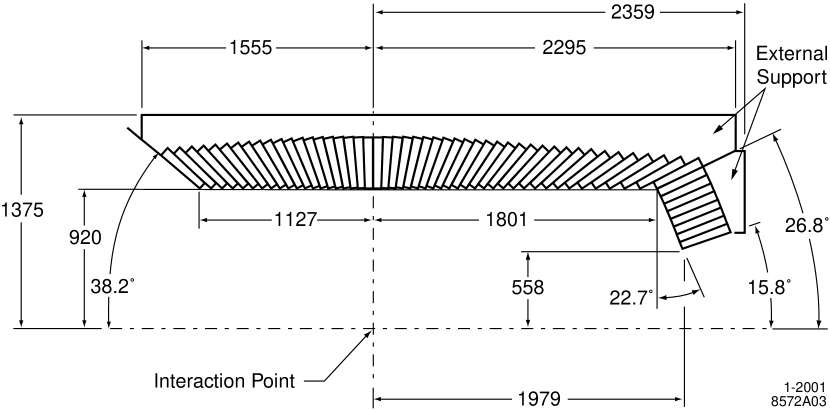
The BABAR electromagnetic calorimeter (EMC) consists of an array of 6580 CsI(Tl) crystals, which encloses the tracking system and DIRC. The crystals have a truncated trapezoidal shape, and are finely segmented in the plane transverse to particles coming from the nominal interaction point (IP), with a typical cross-section of at the front and at the back. The crystals range in depth between 16 and 17.5 radiation lengths (the radiation length of CsI(Tl) is ), with the crystal axis pointing back roughly to the IP. The EMC geometry can be approximately described as a central cylindrical barrel, divided into forward () and backward () regions, plus a conical forward endcap (). The crystals are staggered so that their front face presents a nearly normal surface to particles coming from the IP. The EMC covers about of the polar angle and all of the azimuth in the center-of-mass system of the collisions produced in PEP-II (see Fig. 1).
The energy resolution of the calorimeter has been measured in-situ using a combination of radioactive sources, symmetric decays of and , and Bhabha events, and can be described as:
| (2) |
where and refer to the shower energy and its rms error, measured in . The angular resolution is limited by the transverse crystal size and the distance from the IP. It can also be parameterized as an energy-dependent function
| (3) |
The EMC is surrounded by a series of iron plates arranged as coaxial octagonal cylinders about the BABAR symmetry axis. These plates form a high-susceptibility path for the magnetic flux generated by the BABAR solenoid to close on itself. Between the iron plates are resistive plate chambers and limited streamer tubes with binary readout, used to track muons and provide crude neutral hadron detection. The innermost layers of muon chambers act effectively as a ‘tail catcher’ for the EMC, detecting particles from showers that leak out the back.
3 Longitudinal Shower Depth Variable
To derive longitudinal shower development information from BABAR we exploit the fact that most particles do not enter the calorimeter exactly parallel to the crystal axes. A non-zero entrance angle transforms the transverse crystal segmentation into an effective longitudinal segmentation, providing some depth information. Because the effective longitudinal segmentation is poor (often fractional) and different for every particle, we do not attempt a full parameterization of the longitudinal shower development. Instead, we characterize the shower by the first moment of its longitudinal development, which we call the Longitudinal Shower Depth (). The value is closely related to, but not identical to, the position of the electromagnetic shower maximum, as is discussed in Appendix A.
The variable is a geometric quantity which exploits the fact that the track and the cluster both sample different two-dimensional projections of the three-dimensional shower spatial distribution. When the track direction is not parallel to the crystal axis, these projections are not fully degenerate, and they can be combined to extract the otherwise unobservable, third (longitudinal) dimension.
Three effects are responsible for the fact that the track direction and the crystal axis are not collinear. First, the magnetic field bends the track as it passes through the tracking volume. Second, the width of the beamspot in the beam direction causes tracks from the IP to have a different polar angle from that of the axis of the crystal they strike. Finally, by design, the crystal axes of the BABAR calorimeter do not project perfectly back to the nominal IP, which reduces the chance of particles from the IP passing perfectly between crystals.
As part of computing we describe the calorimeter cluster as a directed line segment in space. We first compute the two-dimensional cluster centroid using the standard BABAR algorithm, which takes the weighted average of the crystal center positions at a nominal depth of 12 cm, using a logarithm of the crystal energy as weight [4]. We then compute the weighted average direction of the crystal axes, using the energy in each crystal as (linear) weight. The cluster line segment is defined to pass through the cluster centroid, and point in the average crystal direction. The starting point of the cluster line segment is taken as the average position of the crystal front faces projected along the average direction.
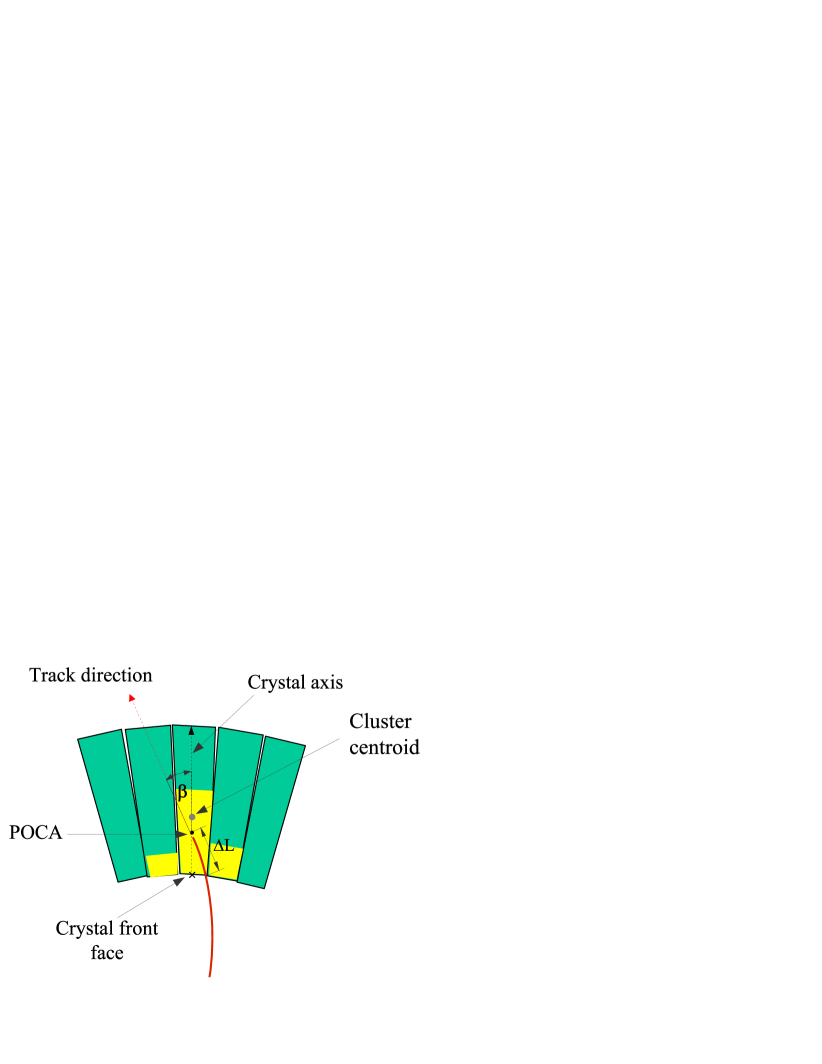
We then calculate the point of closest approach (POCA) in three dimensions between the extrapolated track trajectory and the cluster line segment, using an iterative algorithm. The POCA is the point where the track and cluster projections of the particle trajectory are most consistent.
Conceptually, we define as the path distance the track travels in the calorimeter’s sensitive volume in reaching the POCA. In practice, we define as the distance along the cluster line segment of the POCA, divided by the cosine of the angle between the track direction and the cluster line segment direction, given algebraically as:
| (4) |
where is the position of the POCA, is a point on the front face of the crystal, is a unit vector in the direction of the cluster line segment, and is the angle between the track direction and the cluster axis direction. This quantity approximates the material path distance, but is much simpler to compute. Our definition of ignores the effects of track curvature and crystal-face staggering, which are negligible on the scale of the resolution we achieve on . The definition of is presented graphically in Fig. 2.
4 Particle ID Control Samples
We evaluate the usefulness of for particle identification with the control samples of relatively pure electrons, pions, kaons, muons and protons. The considered control samples are selected from the data collected with the BABAR detector at the PEP-II asymmetric energy ( on ) collider, operating near the resonance which subsequently decays into a meson pair. In the following, we briefly outline the salient features of the control samples.
We select electrons111Electrons denote both electrons and positrons. in both radiative and non-radiative Bhabha events [] by utilizing requirements on the energy deposit and shower-shape variables in the EMC, and by rejecting track candidates consistent with being muons. Based on Monte Carlo studies, the purity of this sample is found to be . As Bhabha events provide mostly high momenta electrons, we consider the two-photon mediated process to enhance statistics in the low-to-medium momentum range (). The selection requirement for this process provides a clean sample of electrons with purity comparable to that of the Bhabha events.
Pion candidates are selected from the decay process and the events with 3-1 track topology. The purity of the sample selection, determined with a mixture of simulated decays and continuum events, is found to be . Pions from -pair events are affected by kaon contamination, having a purity of about . However, this sample provides high-momentum pions not found in the sample. The electron contamination in the -pair pion sample is very small.
In addition to the electron and pion control samples, we use kaons selected from the decay chain ; protons from the decay, ; and muons selected in radiative muon-pair events, . These samples have the best purity for the corresponding track-candidate selection in BABAR, which is comparable to that of the considered electron and pion samples.
5 Electron ID Performance
To test the impact of on electron identification, we start with an electron selector based on two standard variables: the ratio of the shower energy deposited in the calorimeter to the momentum of the track associated with the shower () and the lateral shower moment, defined as
| (5) |
Here is the total number of crystals associated to a shower, is the energy deposited in the -th crystal such that , the lateral distance between center of the shower and -th crystal as defined earlier, and which is approximately the average distance between two crystals. Like , these variables involve calorimetry and tracking measurements only. By evaluating the incremental improvement given by adding to this selector, we test the impact of including the effect of possible correlations between and other similar variables.
We describe the electron identification performance in terms of the electron efficiency and the pion misidentification of the algorithm. We use the TMVA (Toolkit for Parallel Multivariate Data Analysis) package [5] to build a global likelihood function using and , together (or not) with .
To study the pion misidentification probability for a given value of electron ID efficiency, first we define a likelihood ratio, , for each track candidate in the considered signal and background samples by:
| (6) |
Here, the signal and background likelihoods (, ) are products of corresponding probability density functions (, ) of the three discriminating variables:
| (7) |
After that, for a given value of the likelihood ratio, the signal identification efficiency and the background misidentification probability are calculated. This is done for different momentum bins, separately in the forward and the backward barrel, and the endcap regions, using the control samples of electrons and pions discussed in the previous section.
| in | Backward Barrel | Forward Barrel | Endcap | |||
| with | without | with | without | with | without | |
| [0.2, 0.4] | 25 % | 34 % | 16 % | 27 % | ||
| [0.4, 0.6] | 19 % | 25 % | 14 % | 22 % | 5 % | 7 % |
| [0.6, 0.8] | 6 % | 11 % | 8 % | 15 % | ||
| [0.8, 1.0] | 2 % | 3 % | 3 % | 5 % | ||
| [1.0, 2.0] | 2 % | 3 % | 2 % | 3 % | 2 % | 3 % |
| 2.0 | 3 % | 3 % | 2 % | 2 % | ||
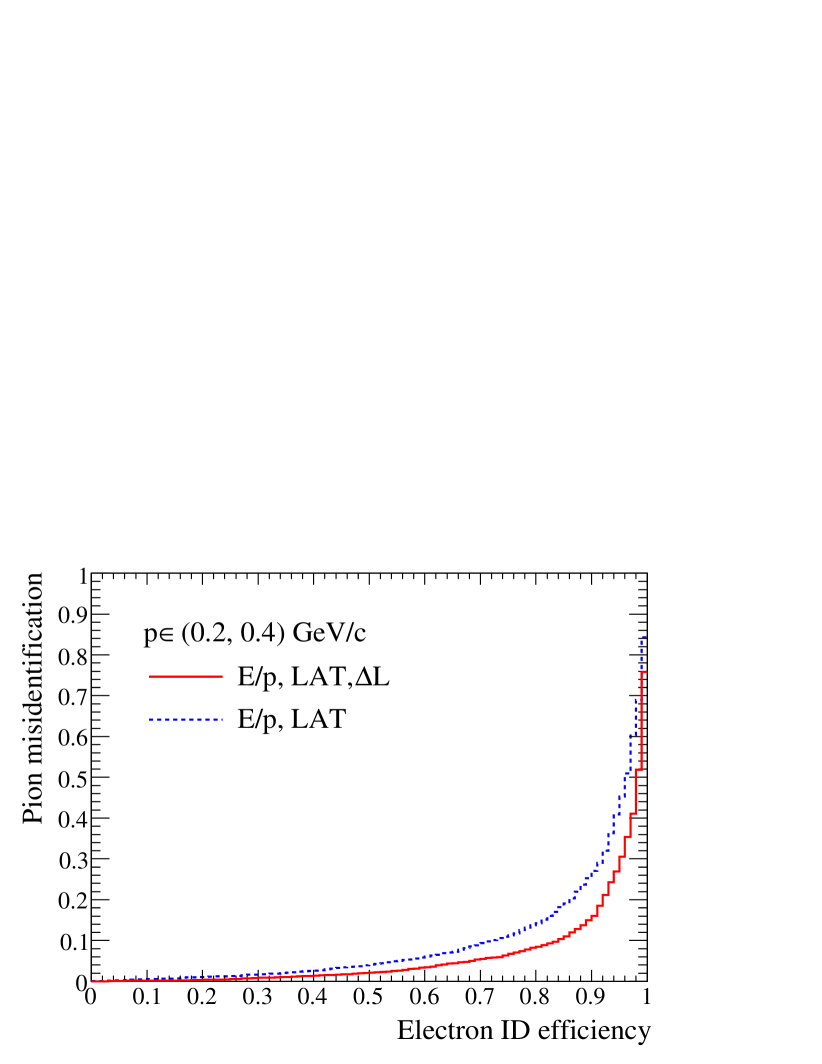
Figure 3 shows the electron efficiency vs. pion misidentification probability for a typical low momentum bin () in the forward barrel EMC. It is evident that for any given value of electron identification efficiency the likelihood function based on gives a lower pion misidentification compared to the case where is not included. Table 1 summarizes results obtained across the full kinematic range for various parts of the EMC. There is a clear improvement in the performance for the backward and forward barrel regions, while for the endcap region (where high momenta particles are mostly abundant), we find a marginal improvement. This is because the discrimination power of diminishes with increasing energy.
6 Charged Particle ID Performance
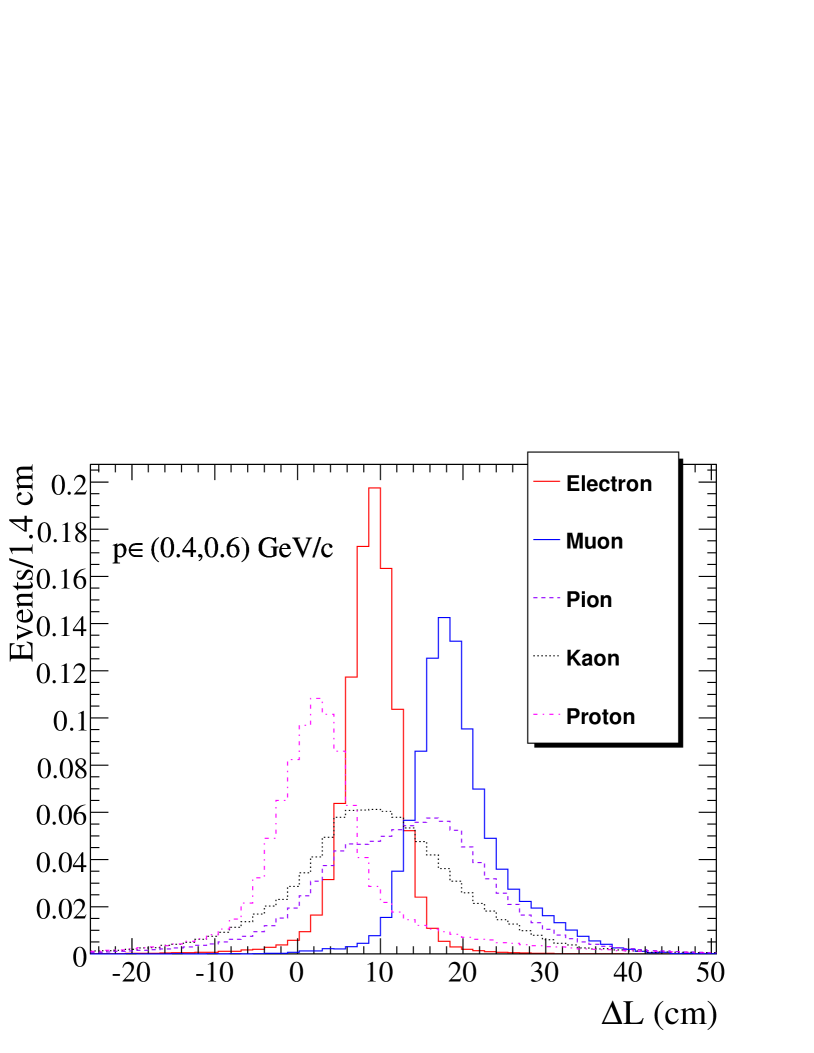
The variable can also be used to enhance general charged particle identification, as it is sensitive to the differing longitudinal shower development of different particle types. This is demonstrated in Fig. 4, which plots for different species of particles, broken down into four track-momentum bins, using the BABAR data PID control samples described in Section 4.
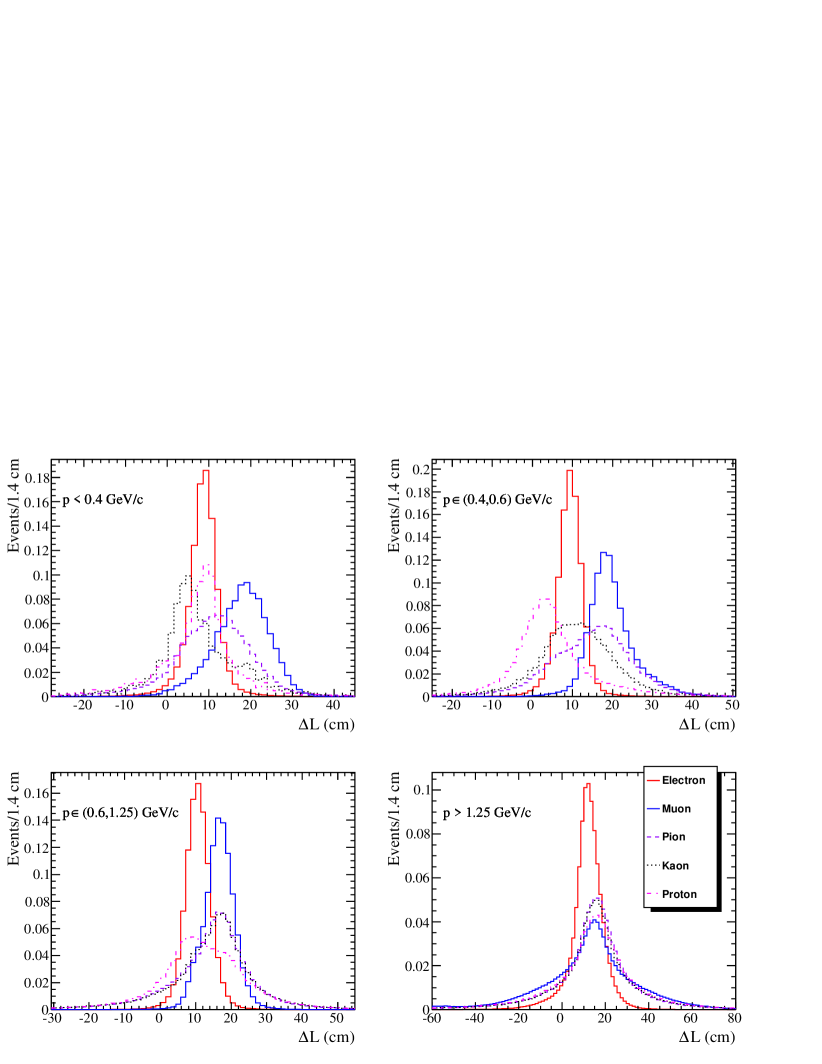
Figure 4 shows a clear distinction between the distributions of different particle species, particularly for momenta below 600 . These distributions can be basically understood in terms of the different energy loss mechanisms at work; for instance, low momentum protons are highly-ionizing, and so deposit most of their energy early in the crystals. By contrast, electrons deposit their energy near shower maximum (roughly ), while muons with momenta above 200 are minimum ionizing and so distribute their energy uniformly along their path through the EMC. Finally, pions and kaons produce broad distributions, corresponding to the large variability of hadronic showers.
In this momentum range provides 0.8 pion-muon separation222We define as the difference between the average of the muon and pion distributions divided by the quadratic average of their rms, ., compared to 1.5 separation from the DIRC, less than 0.1 separation from either DCH or SVT [8], and essentially no separation from . Thus provides an useful cross-check to the DIRC when identifying muons at these momenta, and provides the best muon-pion separation for the 15 % of the BABAR solid angle covered by tracking and calorimetry but not by the DIRC.
At momenta above , the decrease in magnetic bending reduces the angle between the track direction and the crystal axis, degrading the resolution of . Additionally, the longitudinal profile of energy deposition for different particle types tends to converge in this momentum region. Some separation power still comes from different widths of distributions for electrons compared to other particles, but this is a weak discriminant compared to other PID variables available in this momentum region.
The impact of on muon identification at BABAR has been evaluated using a powerful muon selection algorithm which uses a bagged decision tree [9] to combine many input variables333This muon selector has 30 input variables.. This algorithm was trained and evaluated using independent subsets of the data control samples described in Section 4. Compared to an older algorithm which does not use , the minimum muon momentum for which the selector has at least 50 % efficiency (at a fixed pion misidentification probability) was reduced from 800 to 270 [8]. This improvement in low momentum muon selection efficiency is expected to have a significant impact on several important BABAR physics measurements.
7 Energy Evolution of Shower Depth
Due to the exponential nature of electromagnetic shower development, we expect the shower maximum position to evolve logarithmically with energy. A standard model describing the logarithmic energy dependence of longitudinal development is given in Ref. [6]. Because is closely related to shower maximum, we also expect that to evolve logarithmically with energy as well.
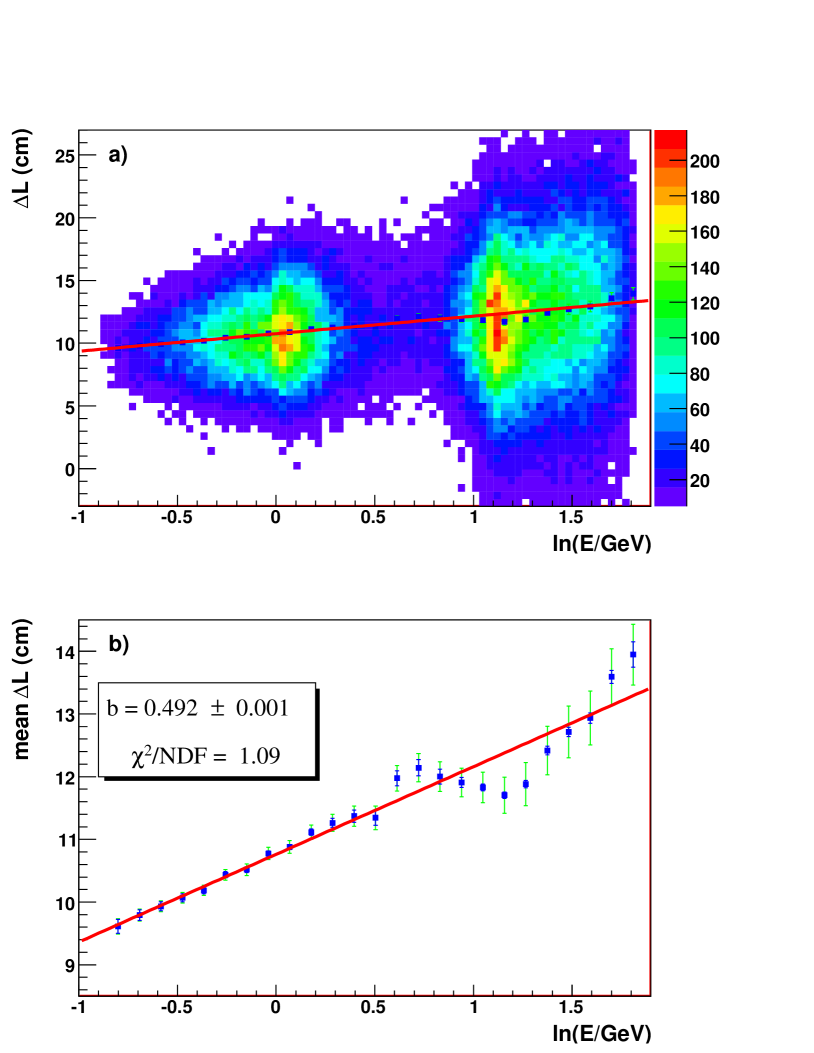
Figure 5 shows for electrons against the natural log of the electron energy in the BABAR data two-photon and Bhabha control samples described in Section 4. The electron energy is estimated as the track momentum calculated at the point where it enters the EMC. The two-photon data cluster at low energy, the Bhabha at high. The points are from slicing the data along the horizontal axis, fitting each slice to a Gaussian, and plotting the Gaussian mean value with its error. The points are fit to a function based on the shower model parameterization of for electrons described in Appendix A. This function has two free parameters: the material-dependent shower scale factor ‘’, plus an overall shift in . The fit quality is reasonable, showing consistency of our data with the model. The shift value we obtain of 0.3 cm is consistent with that expected due to the roughly 0.2 % per cm light attenuation measured in the BABAR CsI(Tl) crystals. The value of the shower scale factor we obtain is , in good agreement with the value expected for CsI(Tl) of , where the error on the expected value comes from interpolation in atomic number of the data provided in Ref. [7], plus the small residual energy dependence of this parameter over the relevant energy range.
The points in Fig. 5 show both the statistical (small bars) and total (statistical plus systematic, larger bars) errors. The dominant systematic error comes from the alignment of the EMC with respect to the BABAR tracking system, which we estimate has an uncertainty of mrad in the rotation around the beam axis. Because this misalignment can depend on the track polar angle, and because the boost of PEP-II correlates energy with polar angle, we include this systematic as a point-by-point error. Other systematic effects are from hadron backgrounds in the sample, the uncertainty in the amount of material before the calorimeter, and changes in light attenuation in the crystals due to radiation damage. These latter are largely accommodated by allowing the depth offset parameter in the fit to float.
8 Monte Carlo Performance of
We have also studied in Monte Carlo events simulated in the BABAR detector, and compare it with real data. This provides a useful test of the shower development model used in simulation.
In Fig. 6 we show distributions for different species of particles selected in simulated control samples for the intermediate momentum bin (), chosen because it shows maximum separation among various particles as discussed in Section 6. The Monte Carlo shapes are very similar to those observed in BABAR data (see Fig. 4), in this and other momentum regions.
Furthermore, we have verified the logarithmic dependence of on the incident electron’s energy in simulated samples of electrons from Bhabha and two-photon processes. Fitting the vs. distribution of these simulated electrons to the shower model function described in Appendix A gives a value for the shower scale factor , consistent with expectations for a CsI(Tl) calorimeter and with our measurements in BABAR data.
9 Conclusions
In this paper, we have presented a technique for extracting longitudinal shower development information from a crystal calorimeter in conjunction with a precision tracking system. When the derived quantity is used in electron identification, we have shown that the algorithm performance is significantly enhanced, especially in the low momentum region. We have also shown that can significantly improve particle separation for other types of particles, particularly muons and pions, in the low momentum region. By studying the energy evolution of for electrons in BABAR, we have established that it behaves consistently with expectations from a standard longitudinal shower model computation. We find that the BABAR simulation well reproduces the observed behavior.
10 Acknowledgments
The work presented in this paper could not have been accomplished without the help of many people. Many of the ideas were germinated and polished during our inspiring discussions with Helmut Marsiske. We also thank Paul Harrison, Chris Hawkes, Martin Kocian, Milind Purohit, and the members of the BABAR EMC and PID subgroups for their helpful comments and suggestions throughout this study; and BABAR and PEP-II for providing the data. The authors acknowledge the support from DOE and NSF (USA), and STFC (United Kingdom). Part of this work was supported by the Director, Office of Science, Office of High Energy Physics, of the U.S. Department of Energy under Contract No. DE-AC02-05CH11231.
Appendix A Energy-weighted shower depth
The mean longitudinal profile of the energy deposition in an electromagnetic shower can be well described by a gamma distribution [6]:
| (8) |
where is the distance measured in units of radiation length , is the energy of the incident particle and is the energy deposited by the particle at a certain distance . Here is a material-dependent shower scale factor [7], and , where denotes the shower maximum and is expressed as follows:
| (9) |
where for electron-induced showers and for photon showers. To a good approximation, the critical energy is given as GeV [for CsI(Tl), average ].
We can then solve for the energy-weighted longitudinal shower depth, , by integrating the fractional energy deposition per radiation length in Eq. (8), , with the corresponding path length :
| (10) |
Here indicates the average length of the CsI(Tl) crystal in units of and varies between 16 to 17.5 for various regions of barrel and endcap EMC. For simplicity, we took to be 17.
We note that the expression in Eq. (10) has a roughly logarithmic energy dependence [see the definition of and Eq. (9)], and that the shower scale factor is roughly independent of energy. We can therefore approximate the energy and material dependence of by Taylor expanding Eq. (10) in terms of and . Keeping only the leading linear terms:
| (11) |
where is the deviation of from a nominal value of . This expression can be used to describe the dependence on , for material with effective values near that of CsI(Tl).
References
- [1] L3 Collaboration, B. Adeva et al., Nucl. Instrum. Meth. A 289 (1990) 35; CLEO-II Collaboration, Y. Kubota et al., Nucl. Instrum. Meth. A 320 (1992) 66; KTeV Collaboration, A. Alavi-Harati et al., Phys. Rev. D 67 (2003) 012005, Erratum-ibid. D 70 (2004) 079904; Crystal Ball Collaboration, S. Prakhov et al., Phys. Rev. C 69 (2004) 045202; CMS Collaboration, “The Electromagnetic Calorimeter Technical Design Report”, CERN-LHCC-97-33; and LHCb Collaboration, “LHCb Calorimeters : Technical Design Report”, CERN-LHCC-2000-0036.
- [2] BABAR Collaboration, B. Aubert et al., Nucl. Instrum. Meth. A 479 (2002) 1.
- [3] D. Acosta et al., Nucl. Instrum. Meth. A 305 (1991) 55.
- [4] B.B. Brabson et al., Nucl. Instrum. Meth. A 332 (1993) 419.
- [5] TMVA Package, A. Höcker et al., arXiv:physics/0703039.
- [6] Particle Data Group, W.-M. Yao et al., Section 27.5 of J. Phys. G 33 (2006) 1.
- [7] Particle Data Group, W.-M. Yao et al., Figure 27.19, J. Phys. G 33 (2006) 1.
- [8] Private communication with A.V. Telnov, Princeton University and the BABAR collaboration.
- [9] “StatPatternRecognition: A C++ Package for Multivariate Classification of HEP Data”, proceedings of Computing in High Energy Physics 2006.