Clustering of Intermediate Luminosity X-ray selected AGN at 666This work is based on observations made with the 6.5 m Magellan-Baade telescope, a collaboration between the Observatories of the Carnegie Institution of Washington, University of Arizona, Harvard University, University of Michigan, and Massachusetts Institute of Technology, and at Cerro Tololo Inter-American Observatory, a division of the National Optical Astronomy Observatories, which is operated by the Association of Universities for Research in Astronomy, Inc. under cooperative agreement with the National Science Foundation.
Abstract
We present the first clustering results of X-ray selected AGN at . Using Chandra X-ray imaging and UVR optical colors from MUSYC photometry in the ECDF-S field, we selected a sample of 58 AGN candidates. From the optical data we also selected 1385 LBG at 2.8 3.8 with R 25.5. We performed auto-correlation and cross-correlation analyses, and here we present results for the clustering amplitudes and dark matter halo masses of each sample. For the LBG we find a correlation length of Mpc, implying a bias value of 3.50.3 and dark matter (DM) halo masses of log(/) = . The AGN-LBG cross-correlation yields Mpc, implying for AGN at 2.8 3.8 a bias value of 5.52.0 and DM halo masses of log(/) = . Evolution of dark matter halos in the Lambda CDM cosmology implies that today these AGN are found in high mass galaxies with a typical luminosity .
Subject headings:
galaxies:active,high-redshift — large-scale structure of universe1. INTRODUCTION
There is a wealth of evidence that nuclear supermassive black holes play a significant role in the process of galaxy formation and evolution. This has become evident in the past few years with the discovery of correlations between the properties of the massive black holes, the stellar systems that host them, and their dark matter halos (Magorrian et al., 1998,Gebhardt et al., 2000, Ferrarese, 2002).
Luminous quasars have been studied in great detail, with systematic spectroscopic studies by the Sloan Digital Sky Survey and the 2dF Galaxy Redshift Survey. These objects are rare and represent the bright end of the active galactic nuclei (AGN) luminosity function. In order to fully understand the link between the growth of supermassive black holes (SMBH) and galaxy evolution, we need to study young, high-redshift galaxies hosting AGN with more typical luminosities.
One of the basic properties of galaxy populations is their clustering strength, but there are few constraints on this quantity for fainter, high-redshift AGN. Furthermore, there are important disagreements in the literature: e.g. galaxy-AGN cross-correlation measurements at by Adelberger & Steidel (2005b) (A05b), imply a bias factor of for luminous AGN (UV luminosities between -30-25), while recent work by Shen et al. (2007) (S07) suggests a value of for sources with similar luminosities at the same redshift. For galaxies, e.g., measurements indicate a strong luminosity dependence in the clustering length (Giavalisco & Dickinson, 2001). On the other hand, for AGN there are a handful of claims that this is not the case (Croom et al., 2005, Myers et al., 2006, Adelberger & Steidel, 2005a). Determining the bias with accuracy puts important constraints on models of AGN formation and evolution, (e.g., Lidz et al., 2006, Hopkins et al., 2007) but requires spanning a broad range in luminosity and obscuration level. This is challenging using optical color selection plus spectroscopy, because the low fraction of AGN (3%) found among these candidates (Steidel et al., 2002) demands huge amounts of spectroscopy time. Using X-ray detection plus spectroscopy (e.g., Szokoly et al., 2004) provides a more efficient and unbiased selection of AGN, since their surface density is higher in X-rays than in optical images and obscuration effects are much less important. However, the unrestricted redshift range sampled by this method makes spectroscopic follow-up highly inefficient, and often prevents confirmation of dimmer, high-z AGN (R24). Hence it is difficult to obtain AGN samples suitable for clustering studies. There have been several measurements of the spatial correlation function of X-ray selected AGN at (Mullis et al., 2004, Gilli et al., 2005, Basilakos et al., 2004, Basilakos et al., 2005, Yang et al., 2006, Miyaji et al., 2007), with samples ranging from 200-500 sources. At higher redshifts, the statistics are much poorer, and consist of purely optically selected AGN. In this work, we constrain the clustering strength of an AGN sample at jointly selected by optical and X-ray photometry. We determine whether these sources cluster more or less than non-active galaxies at this redshift, and discuss their present-day descendants.
We assume a CDM cosmology consistent with WMAP results (Spergel et al., 2007) with , km s-1 Mpc-1 and . All quantities are comoving: correlation lengths scale as , number densities as and halo masses as .
2. OBSERVATIONS
The MUSYC survey was optimized to study galaxies at , with imaging depths down to the spectroscopic limit, , , , 26 (Gawiser et al., 2006b). In the ECDF-S field, in particular, the 5 limiting (AB) magnitudes achieved in these bandpasses are 26.0, 26.9, 26.4 and 26.4 respectively. The main MUSYC catalog is based on the sources detected on the combined BVR image, and aperture photometry is performed on each filter in those positions (see Gawiser et al., 2006a).
The deep Chandra observations of this field have produced four X-ray catalogs: Giacconi et al. (2002), Alexander et al. (2003), Lehmer et al. (2005), and Virani et al. (2006). The first two comprise 1 Ms of exposures inside the central region (CDF-S proper), covering an area of 0.1 deg2 (PI R. Giacconi). The Alexander et al. catalog has reported flux limits of erg cm-2 s-1 and erg cm-2 s-1 in the soft (0.5-2 keV) and hard (2-8 keV) bands, respectively. The last two catalogs come from the four 250 ks pointings that cover an area of 0.3 deg2 around the former field (PI N.Brandt). Limiting X-ray fluxes in the extended region are erg cm-2 s-1 in the soft and erg cm-2 s-1 in the hard bands, correspondingly.
The MUSYC spectroscopic follow-up program carried out with Magellan/Baade+IMACS has yielded 280 successful identifications of z 2 galaxies. Data were obtained with a resolution of R=640 (470 km/s at 5000Å) and slitlets of 1.2′′ (P. Lira et al., in prep). The broad wavelength coverage provided by IMACS, between 4000 and 9000Å, allows the detection of Ly and C IV 1549, the two most prominent ultraviolet AGN emission lines, at redshifts 2.3 4.0.
3. AGN AND LBG SAMPLES
The full set of unique X-ray counterparts is taken from the MUSYC ECDF-S X-ray catalog (Cardamone et al. 2007, submitted to ApJ), constructed joining the catalogs from Giacconi et al. (2002), Alexander et al. (2003), Virani et al. (2006) and Lehmer et al. (2005), using a likelihood procedure (Brusa et al., 2005) to match sources between the X-ray and optical (BVR-selected) catalogs.
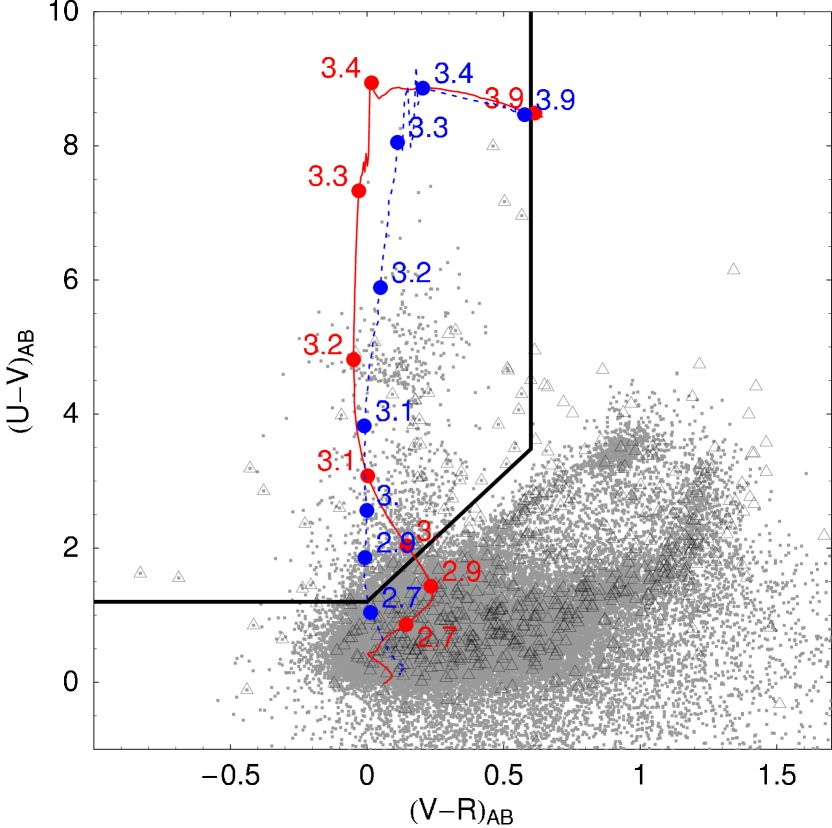
Fig. 1 shows the versus color-color plot for sources in the ECDF-S from MUSYC photometry. Lyman break color selection (‘UVR’) corresponds to the region outlined in the upper left side (Steidel et al., 1996,Gawiser et al., 2006a). For this color selection, -band fluxes are required to be detected at 1-, and are otherwise set to an upper limit equal to their 1- error. This avoids interlopers (typically dwarf stars) with uncertain photometry at the cost of incompleteness in the sample. Additionally, 25.5 is required to allow for spectroscopic confirmation. Sources presenting a drop in the filter due to intergalactic absorption, along with a blue continuum between the and filters that rules out heavily reddened lower-z objects, are expected to lie at 2.7 3.7. For XUVR selection of AGN we require an X-ray detection with counterpart UVR colors in the same region and we drop the R magnitude limit and the 1- -band requirement, since the extra requirement of X-ray emission already rules out most dwarf stars. This procedure yields 1385 LBG and 58 AGN candidates. Unobscured AGN and LBG have somewhat similar UVR colors, as can be seen in the color-color track in Fig. 1, since these colors are mainly determined by the intergalactic hydrogen absorption. Furthermore, obscured AGN are the dominant population among AGN, and since the SED of the first is dominated by their host galaxies (Treister et al., 2004, Treister & Urry, 2005), we expect the redshift distribution of our AGN sample to differ mildly from the LBG distribution. Notice that in the case of significant obscuration, we don’t expect to select AGN hosted by very red galaxies, since they will probably not be bright enough in the restframe UV.
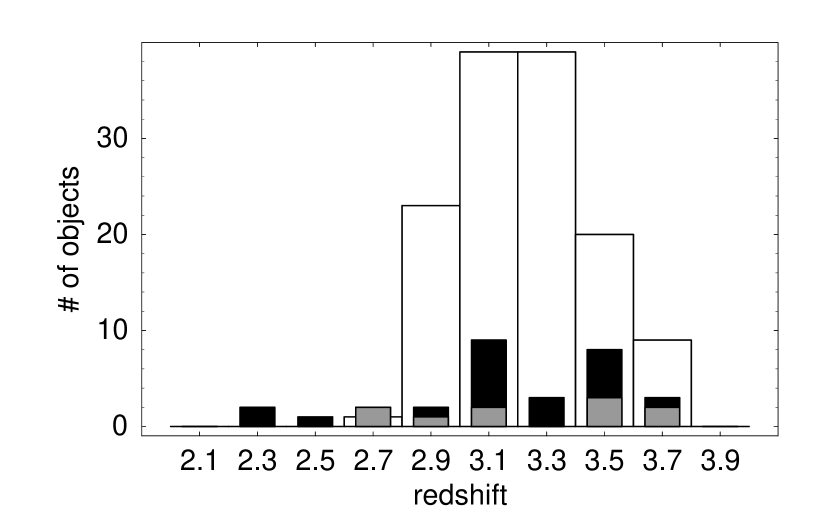
From the spectra obtained over the entire 4-field survey so far, 131 LBG and 30 AGN were identified at the target redshift 3, and in the ECDF-S in particular, 31 LBG and 11 AGN have been confirmed. While AGN in the ECDF-S were directly targeted using a joint X-ray and optical selection, in the rest of the MUSYC fields AGN have been discovered serendipitously among the UVR candidates (see Fig. 1). Fig. 2 shows the redshift histograms of the confirmed objects, which implies X-ray luminosities between and ergs/s for the entire set of AGN candidates. The Lyman-Break (UVR) selection shows a fraction of low-redshift interloper less than 10%. In the spectra of the XUVR-targeted AGN in ECDF-S, we did not observe any interlopers.
4. CLUSTERING ANALYSIS
We calculate the clustering of AGN via a two-step method, calculating the autocorrelation of LBG first, and then their cross-correlation with AGN. The main advantage of this approach is that it improves the statistics significantly, since the LBG population is much more numerous and its redshift distribution is similar to the AGN population sampled here, the AGN-LBG cross-correlation function less noisy than the AGN autocorrelation function (Kauffmann & Haehnelt, 2002). Notice that the AGN and LBG that contribute to the cross-correlation function will be those that spatially overlap. Therefore, our results will reflect the clustering of AGN in the redshift range 2.7 3.8.
For the UVR selected sources, we calculated the angular autocorrelation function using the Landy & Szalay (1993) estimator:
| (1) |
where DD, DR and RR are the data-data, data-random and random-random pairs, all normalized to integrate to 1. To estimate the angular cross-correlation between UVR-XUVR sources, we used the following cross-correlation estimator (Croft et al., 1999):
| (2) |
where now the data-data pairs are between AGN and LBG, and data-random between AGN and the optical random catalog. Notice that this estimator does not use a random catalog for the X-ray sources. The degradation of the PSF and sensitivity as a function of the off-axis angle in the Chandra data makes the X-ray survey geometry fairly complicated, but these resulting systematic uncertainties can be avoided in this cross-correlation scheme.
The estimates shown above were fitted to , where the integral constraint factor IC is included as part of the model and we assumed the usual power law for the true angular correlation function. We kept fixed, since our S/N does not allow us to put significant constraints on the slope. Fit limits have been set to avoid the one-halo term regime on small angular scales (30′′ for LBG and 60′′ for AGN based on the virial radii of their initially inferred DM halo masses of 6 and , respectively) and ending at half the field size on the larger scales, in order to avoid border effects of the estimator and where the sampling becomes poor anyway. The fit to the LBG autocorrelation function gave and the fit to the cross-correlation function , with reduced values of 1.24 and 1.21, respectively. The errors in these parameters were calculated using and correspond to 1- confidence level with 1 parameter. Fig. 3 shows the measured angular correlation functions with their corresponding best fit models. Binning over the entire fitting range gives estimates for the total signal-to-noise ratios of these measurements of 10.2 and 3.9, correspondingly. From montecarlo realizations, we estimated that the probabilities of obtaining clustering this high from unclustered populations of the same sizes are 0.1% for the LBG autocorrelation and 1% for the AGN-LBG cross-correlation.

Using smooth fits to the redshift distributions of the confirmed sources shown in Fig. 2, we deprojected the values obtained for the angular LBG autocorrelation and LBG-AGN cross-correlation amplitude using Limber’s equation. We obtained spatial correlation lengths of Mpc and Mpc respectively, where the correlation length is defined by the usual fitting form for the spatial correlation function. The random errors introduced in the deprojection are included in the error budget by approximating the redshift distributions as Gaussians and propagating the standard errors in their means and variances.
To calculate the bias factor of the AGN sample in the approximation of linear, constant bias, we used the elementary relations and , where is the variance in spheres of radius Mpc in the random field described by the corresponding auto- or cross-correlation function. Although and are highly degenerate parameter pairs, the bias factors are robust to variations in the slope (or ). Therefore, they are our preferred quantity for comparison with the literature. The bias, number densities and masses shown in Table 1 are calculated using the ellipsoidal collapse model extension of the Press-Schechter formalism by Sheth & Tormen (1999) and the extension of the Mo & White (1996) formalism by Sheth et al. (2001). These quantities were evaluated at the mean redshifts of the confirmed samples, both very close to z̄=3.2.
| bias | log() | (Mpc-3) | |
|---|---|---|---|
| LBG | |||
| AGN | - |
Note. — Confidence intervals/ranges are 1-. Masses are given in logarithm of solar masses.
5. DISCUSSION
We have measured the autocorrelation strength of z=3 LBG and the cross-correlation between these galaxies and AGN selected using both X-ray and optical data. For the LBG sample, we obtained a bias factor of 3.50.3. This is somewhat higher than the value 2.80.3 found by Adelberger et al. (2005) at . Hildebrandt et al. (2007) obtained a bias value of 3.20.2 for an equivalent LBG population, consistent with ours.
From the AGN-LBG cross-correlation and the bias calculated for the LBG, we have deduced a bias factor of 5.52 for our AGN sample. The active galaxies targeted in this study appear to cluster more than star-forming galaxies with similar restframe-UV colors. This is consistent with cosmic downsizing of AGN, implying that typical SMBH tend to sit in more massive galaxies than the “normal” galaxy population. We need greater statistics to confirm this result, since the values are consistent within the uncertainties.
A05b performed this same calculation in an optically selected and spectroscopically confirmed sample of 79 AGN between 1.6 3.7, dividing the AGN by UV luminosity into bright (25 sources with -30-25) and dim (54 sources with -25-19) samples. Although A05b does not report the autocorrelation length of the galaxy sample used to compute these values, we approximate it by averaging the result for LBG and BX galaxies presented in Adelberger et al. (2005), obtaining a bias factor of 2.60.3. From this we infer bias factors of 3.93.0 and 4.71.7 for the A05b bright and dim AGN samples. Our AGN sample has an UV magnitude range between -26 and -20, almost identical to the A05b faint AGN set, and showing the same clustering strength. In Fig. 4 these results are compared to the present estimate and to that obtained by S07 for 2250 SDSS quasars at 2.93.5.
To estimate the dark matter halo mass of the typical descendant of the halos that host these galaxy sets at the present time, we calculated the mode and width of the conditional probability distribution of the expected mass (see Hamana et al., 2006 and references therein). We took the median mass of the halo populations at as the representative value, and we report the bias values corresponding to the maximum likelihood z=0 progenitor, with uncertainties corresponding to halo masses whose likelihood is reduced by a factor . For the LBG bias of 3.5 at , we obtain a bias of at . In the nearby universe (Zehavi et al., 2005), this corresponds to the clustering of a somewhat massive galaxy, with . On the other hand, our AGN sample, with a bias of 5.5 at would have a typical halo with a bias factor of at present. Extrapolating from Zehavi et al. (2005), this corresponds to the clustering of galaxies having , which at the present time are most likely located in groups and galaxy clusters.

This confirms the result found by A05b for faint, optically selected AGN. Improving our understanding of the AGN-galaxy connection at and constraining models such as Lidz et al. (2006) and Hopkins et al. (2007) for AGN clustering, requires resolving the discrepancy in the bias estimates for bright AGN seen in Fig. 4 improving the statistics. We have show that targeting high-redshift AGN for clustering analyses can be done very efficiently by means of deep optical and X-ray imaging, and for that reason, future surveys with deep X-ray coverage will be ideal for obtaining large samples of active galaxies in restricted redshift ranges, suitable for clustering studies. Our method can be applied to these surveys to obtain enough X-ray-selected AGN to reduce the current uncertainties.
H. F. was supported by MECESUP project UCH0118, Andes Fundation fellowship C-13798, ALMA fellowship 31060003 and Fondecyt project 1040719.
References
- Adelberger & Steidel (2005a) Adelberger, K. L. & Steidel, C. C. 2005a, ApJ, 630, 50
- Adelberger & Steidel (2005b) —. 2005b, ApJ, 627, L1
- Adelberger et al. (2005) Adelberger, K. L. et .al 2005, ApJ, 619, 697
- Alexander et al. (2003) Alexander, D. M. et al. 2003, AJ, 126, 539
- Basilakos et al. (2004) Basilakos, S. et al. 2004, ApJ, 607, L79
- Basilakos et al. (2005) Basilakos, S. et al. 2005, MNRAS, 356, 183
- Brusa et al. (2005) Brusa, M. et al. 2005, A&A, 432, 69
- Croft et al. (1999) Croft, R. A. C., Dalton, G. B., & Efstathiou, G. 1999, MNRAS, 305, 547
- Croom et al. (2005) Croom, S. M. et al. 2005, MNRAS, 356, 415
- Ferrarese (2002) Ferrarese, L. 2002, ApJ, 578, 90
- Gawiser et al. (2006a) Gawiser, E. et al. 2006a, ApJS, 162, 1
- Gawiser et al. (2006b) —. 2006b, ApJ, 642, L13
- Gebhardt et al. (2000) Gebhardt, K. et al. 2000, ApJ, 539, L13
- Giacconi et al. (2001) Giacconi, R. et al. 2001, ApJ, 551, 624
- Giacconi et al. (2002) Giacconi, R. et al. 2002, ApJS, 139, 369
- Giavalisco & Dickinson (2001) Giavalisco, M. & Dickinson, M. 2001, ApJ, 550, 177
- Gilli et al. (2005) Gilli, R. et al. 2005, A&A, 430, 811
- Hamana et al. (2006) Hamana, T. et al. 2006, MNRAS, 369, 4
- Hildebrandt et al. (2007) Hildebrandt, H. et al. 2007, A&A, 462, 865
- Hopkins et al. (2007) Hopkins, P. F. et al. 2007, ApJ, 662, 110
- Kauffmann & Haehnelt (2002) Kauffmann, G. & Haehnelt, M. 2002, MNRAS, 332, 529
- Landy & Szalay (1993) Landy, S. D. & Szalay, A. S. 1993, ApJ, 412, 64
- Lehmer et al. (2005) Lehmer, B. D. et al. 2005, ApJS, 161, 21
- Lidz et al. (2006) Lidz, A. et al. 2006, ApJ, 641, 41
- Magorrian et al. (1998) Magorrian, J. et al. 1998, AJ, 115, 2285
- Miyaji et al. (2007) Miyaji, T. et al. 2007, ApJS, 172, 396
- Mo & White (1996) Mo, H. J. & White, S. D. M. 1996, MNRAS, 282, 347
- Mullis et al. (2004) Mullis, C. R. et al. 2004, ApJ, 617, 192
- Myers et al. (2006) Myers, A. D. et al. 2006, ApJ, 638, 622
- Shen et al. (2007) Shen, Y. et al. 2007, AJ, 133, 2222
- Sheth & Tormen (1999) Sheth, R. K. & Tormen, G. 1999, MNRAS, 308, 119
- Sheth et al. (2001) Sheth, R. K., Mo, H. J., & Tormen, G. 2001, MNRAS, 323, 1
- Spergel et al. (2007) Spergel, D. N. et al. 2007, ApJS, 170, 377
- Steidel et al. (1996) Steidel, C. C. et al. 1996, ApJ, 462, L17
- Steidel et al. (2002) Steidel, C. C. et al. 2002, ApJ, 576, 653
- Szokoly et al. (2004) Szokoly, G. P. et al. 2004, ApJS, 155, 271
- Treister & Urry (2005) Treister, E. & Urry, C. M. 2005, ApJ, 630, 115
- Treister et al. (2004) Treister, E. et al. 2004, ApJ, 616, 123
- Virani et al. (2006) Virani, S. N. et al. 2006, AJ, 131, 2373
- Yang et al. (2006) Yang, Y. et al. 2006, ApJ, 645, 68
- Zehavi et al. (2005) Zehavi, I. et al. 2005, ApJ, 630, 1