X-ray Emitting Ejecta in Puppis A Observed with Suzaku
Abstract
We report the detection and localization of X-ray emitting ejecta in the middle-aged Galactic supernova remnant Puppis A using five observations with the Suzaku X-ray Imaging Spectrometer to survey the eastern and middle portions of the remnant. A roughly , double-peaked region in the north center is found to be highly enriched in Si and other elements relative to the rest of the remnant. The X-ray fitted abundances are otherwise well below the solar values. While the ejecta-enhanced regions show some variation of relative element abundances, there is little evidence for a very strong enhancement of one element over the others in the imaged portion of the remnant, except possibly for a region of O and Ne enhancement in the remnant’s south center. There is no spatial correlation between the compact [O III] emitting ejecta knots seen optically and the abundance enhancements seen in X-rays, although they are located in the same vicinity. The map of fitted column density shows strong variations across the remnant that echo earlier X-ray spectral hardness maps. The ionization age (as fitted for single temperature models) is sharply higher in a ridge behind the northeast-east boundary of the remnant, and is probably related to the strong molecular cloud interaction along that boundary. The temperature map, by comparison, shows relatively weak variations.
1 Introduction
In recent years, X-ray spectral imaging has revealed X-ray emitting ejecta even in a number of very old (10,000 yr) remnants where most of the X-ray emission is from shock-heated interstellar or circumstellar matter (e.g, Hughes et al. 2003, Park et al. 2003, Hendrick et al. 2003, 2005, Borkowski et al. 2006). Puppis A is a middle-aged supernova remnant whose X-ray emission is dominated by shock-heated interstellar material. It resides in a very complex interstellar environment including large atomic and molecular clouds (Dubner & Arnal 1988, Reynoso et al. 1995) and a large-scale interstellar density gradient (Petre et al. 1982). It is, however, one of a handful of remnants in which fast-moving ( km/s) ejecta knots enriched in oxygen have been identified optically (Winkler & Kirshner 1985), and is thus a promising target for the identification of hot, X-ray emitting ejecta. The goal of the Suzaku observations reported here is to search for and to localize X-ray emitting ejecta in Puppis A.
The presence of O-enriched ejecta in Puppis A clearly indicates that the progenitor was a massive star that synthesized the oxygen hydrostatically, a conclusion that is further confirmed by the presence of an X-ray emitting compact central source, believed to be a neutron star (Petre et al. 1996, Winkler & Petre 2007). The optically emitting oxygen knots are found in the central and eastern regions of Puppis (Winkler & Kirshner 1985). More global oxgyen ejecta enrichment had been indicated by high-spectral resolution X-ray observations with the Focal Plane Crystal Spectrometer (FPCS) on the Einstein Observatory (Canizares & Winkler 1981). The O enrichment suggested by the Einstein FPCS could not be localized by it, however, as the spectra were accumulated over rather large regions of the remnant ( and diameter). The identification and localization of gas with enriched element abundances requires adequate spectral imaging. Einstein Solid-State Spectrometer observations with a 6′ aperature did not find evidence for ejecta enrichment (Szymkowiak 1985 PhD thesis), but a later survey by the ASCA Observatory (Tamura 1995 PhD thesis) did produce evidence for localized ejecta enrichment, mostly of Ne in the west and northwest. Chandra observation of a small square field at the eastern edge of the remnant, where the shock is interacting with molecular and interstellar clouds, hinted at small pockets of gas enriched with ejecta (Hwang, Flanagan, & Petre 2005).
In this paper, we present a partial X-ray imaging and spectral survey of the Puppis A supernova remnant with the CCD detectors on the Suzaku Observatory. Five observations cover about two-thirds of this large 50′ diameter remnant to the east and center, including the locations of the optically emitting O ejecta knots. Compared to ASCA, Suzaku has only slightly improved angular resolution, but much better sensitivity and spectral resolution, particularly at low energies. The Suzaku XIS also surpasses the Chandra CCDs for sensitivity and spectral resolution at low energies, a feature that is particularly important for studying the X-ray emitting O and Ne ejecta.
2 Observations and Analysis
Five observations of Puppis A were performed with the CCD-based X-ray Imaging Spectrometer (XIS) at the beginning of the AO1 guest observing phase of the Suzaku Observatory. The XIS features four separate imagers, one illuminated from the back (XIS1), the other three from the front (XIS0, XIS2, subsequently defunct, and XIS3). Details can be found in Mitsuda et al. (2007).
The exposure times were optimized for observation of the oxygen emission lines (O VII resonance at 574 eV, the dominant component of the He-like O triplet in Puppis A, and O VIII Ly at 653 eV; see Winkler et al. 1981). The observations, which are summarized in Table 1, cover most of the bright eastern and central portions of the remnant, but not the west. Given the very soft spectrum of the source and the overall high count rates of the Bright Eastern Knot (BEK), Northeast (NE) and Interior (I) fields, data from the Hard X-ray Detector on Suzaku were not telemetered, in favor of data from the XIS. Additionally for these three observations, 4s burst mode was used for the FI chips in order to further reduce the telemetry load (in this mode, the detector does not collect data for 4 s out of the normal 8 s data cycle). Shorter exposures also reduce the impact of pulse pile-up in the detector, which is likely to be an issue at the 10% level in the bright regions of the remnant. The observations were carried out without the use of charge injection to moderate the effects of radiation damage on the CCDs. We use the initial release version 0.7 of the data, after performing the data screening recommended in the Suzaku Data Reduction Guide111http://heasarc.gsfc.nasa.gov/docs/suzaku/analysis/abc.
| Field | Obs ID | Date | Coordinates | Exposure Time (ks) | FI Burst Mode |
|---|---|---|---|---|---|
| Bright Eastern Knot (BEK) | 501086010 | 2006 Apr 17 | 125.9422, -42.9626 | 16.8 | 4s |
| Northeast (NE) | 501087010 | 2006 Apr 17-18 | 125.7579, -42.7332 | 20.7 | 4s |
| Interior (Int) | 501088010 | 2006 Apr 17 | 125.5915, -42.9172 | 20.3 | 4s |
| Southeast (SE) | 501089010 | 2006 Apr 18 | 126.0121, -43.2023 | 29.8 | 4s, none |
| South (S) | 501090010 | 2006 Apr 18-19 | 125.6826, -43.1664 | 31.2 | none |
2.1 Imaging Analysis and Results
For all five fields, the full-CCD spectra are qualitatively similar. They fall off rapidly above energies of 3-4 keV, with no evidence for harder emission, and have numerous strong emission line features. These are the He blends of O (dominated by the resonance line), Ne, Mg, Si, and S, plus weak Fe L features near 827 eV corresponding to Fe XVII (cf. Winkler et al. 1981). Figure 1 shows the BI illuminated XIS1 spectrum for the South field as an example, with the prominent emission lines and blends labelled. In this and all other spectra considered here, the channels are binned to provide at least 25 counts per channel.

| Image | Pulse Heights | Energies (keV)∗ | Total Counts () |
|---|---|---|---|
| Cont 0 | 100-125 | 0.36-0.46 | 18 |
| C He | 125-145 | 0.46-0.53 | 51 |
| O VII He (Res) | 145-164 | 0.53-0.60 | 87 |
| O VIII Ly | 164-192 | 0.60-0.70 | 266 |
| Cont 1 | 192-216 | 0.70-0.79 | 259 |
| Fe L (Fe XVII) | 216-236 | 0.79-0.86 | 313 |
| Ne IX He | 236-268 | 0.86-0.98 | 573 |
| Ne X Ly | 268-300 | 0.98-1.09 | 322 |
| Cont 2 | 312-348 | 1.14-1.27 | 166 |
| Mg XI He | 348-390 | 1.27-1.42 | 175 |
| Cont 3 | 390-420 | 1.42-1.53 | 42 |
| Si XIII He | 475-538 | 1.74-1.96 | 63 |
| Si XIII He | 563-633 | 2.05-2.31 | 15 |
| S XV He | 633-710 | 2.31-2.59 | 12 |
| Cont 4 | 710-860 | 2.59-3.13 | 7.4 |
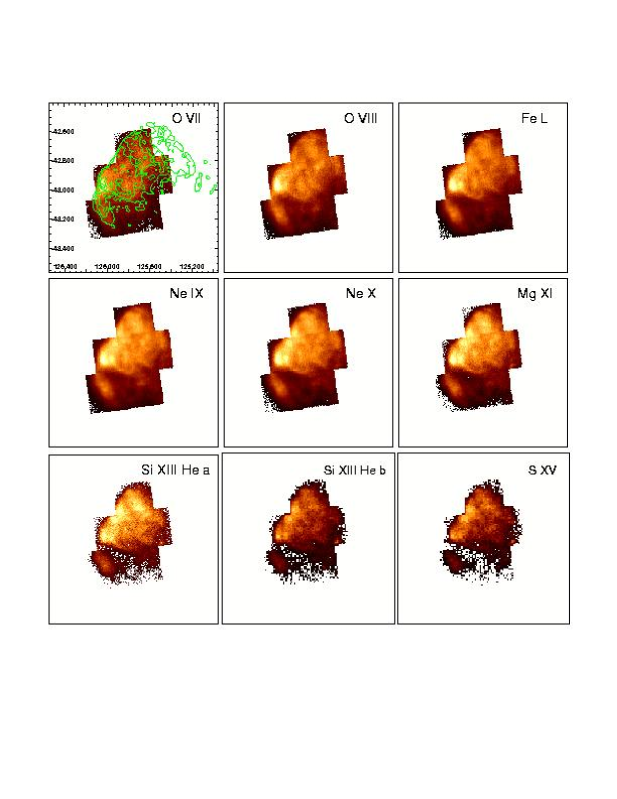
We produced energy-selected images of all the notable line features in the integrated spectrum, as well as regions of continuum emission, as summarized in Table 2. We perform a simple correction for the detector exposure by making the individual line images for each detector for each observation, then trimming several pixels at all four edges and dividing by the average exposure time; i.e., we do not correct for vignetting. No attempt was made to subtract background as the images are all bright. The final mosaicked images have 8.4′′ pixels and are scaled to a fiducial exposure time, taken to be the 16.8 ks exposure time for observation 50108600. The Si He and S He images have the fewest photons and so were binned by a further factor of four in each dimension to improve signal-to-noise.
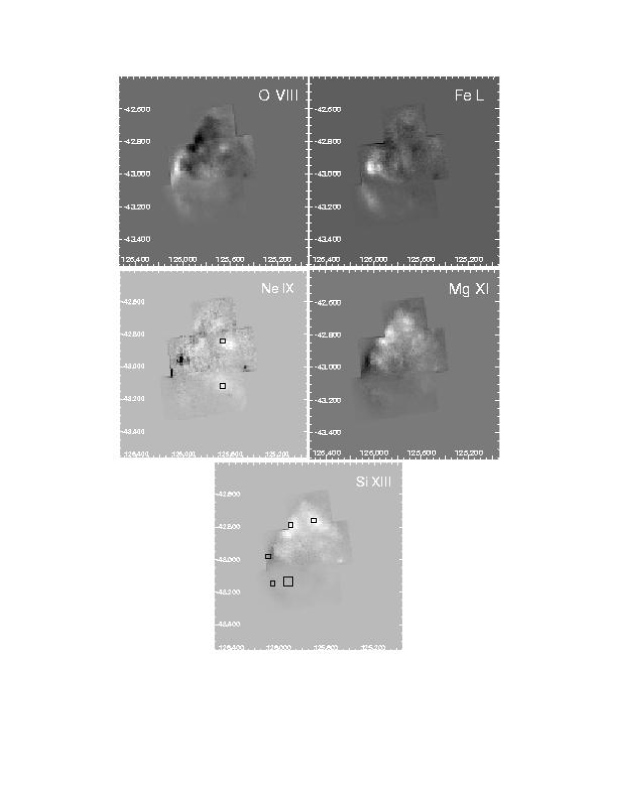
The combined mosaicked line images for all four XIS detectors are shown in Figure 2; the images mosaicked separately for the BI and FI detectors are not shown but are similar to those in the Figure. The continuum images are also not shown, but are similar to the line images in general morphology. Spatial variations in the line emission are further highlighted by difference images, five of which are shown in Figure 3. These difference images are line images with the broadband image normalized to it and subtracted. While we refer to the images in Figure 2 and 3 as “line images”, they are in reality simply energy-selected images that include any emission in the relevant energy range, whether from line or continuum. In Figure 2, the O VII image is overlaid with surface brightness contours of the ROSAT High Resolution Imager mosaic of the entire remnant (Petre et al. 1996) and the J2000 coordinates. Coordinates are also given for the images in Figure 3 to facilitate identification of morphological features discussed below.
The so-called Bright Eastern Knot (BEK), located just inside the bottom of the straight eastern shock front, is prominent in all the images. Its brightness peaks at roughly (J2000) =126.04, =-42.97 (see Figures 2 and 3). It is known to be a complicated interaction between the supernova remnant shock and multiple interstellar clouds (Petre et al. 1982, Hwang et al. 2005). Given that the eastern part of the BEK has lower temperature and ionization age conducive to stronger O line emission (Hwang et al. 2005), it is not surprising that O emission is seen to be relatively prominent at the easternmost edge of the BEK, and Ne and Fe L emission is strong in a larger region extending towards the remnant interior (Figure 3). We also point out some of the other morphological features that we will later discuss in more detail. These include the elongated region extending southward from the BEK region (SE Arm, roughly =126.05, =-43.15), and the low surface brightness region that is just west of it (SE Low SB). Extending north by northwest from the BEK is the northeast shock front (NE SF); seen by Suzaku, it is bright in the images of Ne, Mg, Si, S, but not of O. The relative prominence of lines of higher energy as opposed to oxygen lines is consistent with the harder spectra seen interior to the NE SF in ROSAT observations (Aschenbach et al. 1994, Hwang et al. 2005). The remnant’s interior is populated with additional patchy clumps of emission. The most striking of these is seen most prominently in the Si images, just inside the northernmost apex of the remnant in the Si images (it is also seen clearly in Ne, Mg, and S emission; we call this the “Si Knot” (=125.70, =-42.76). Incidentally, the neutron star in Puppis A is visible in Si and S, and in negative in the Ne IX difference image, at the lower right of the image mosaics (i.e., in the lower center of the remnant at =125.48, =-43.01).
Line-to-continuum ratio images (“line equivalent width” or EQW) can be used to make a quick assessment of whether enhancements in the images are particularly due to enhanced line emission. The continuum underlying the line emission is first estimated (either by interpolation or extrapolation from the continuum in nearby energy regions, or by extrapolating from a single adjacent continuum region), then it is subtracted from the “line” image before taking the ratio (the procedure is essentially that used by Hwang et al. 2000). We examined EQW images for O VIII Ly, Ne He, Mg He and Si XIII He with particular reference to the emission enhancements at the BEK, the northeastern shock front, and the various interior knots. None of the EQW images is bright at the BEK, which is in line with our understanding that the BEK is associated with shocked interstellar clouds. The northeast shock front is also absent from the EQW images for the same reason. Of all the features seen in the EQW images, the strongest by far is the roughly Si Knot seen in the Si, Ne, Mg, and S images. It completely dominates the Si EQW image which is shown in Figure 4. (This image is binned by a factor of four relative to the Si He line image in Figure 2.) We do not show the O, Ne, or Mg images here, in favor of the abundance maps from spectral fitting to be discussed below, but note that O and Ne EQW also appear high in a few regions, particularly in the southern portion of the Si Knot and in the SE Low SB region adjacent to the SE Arm.
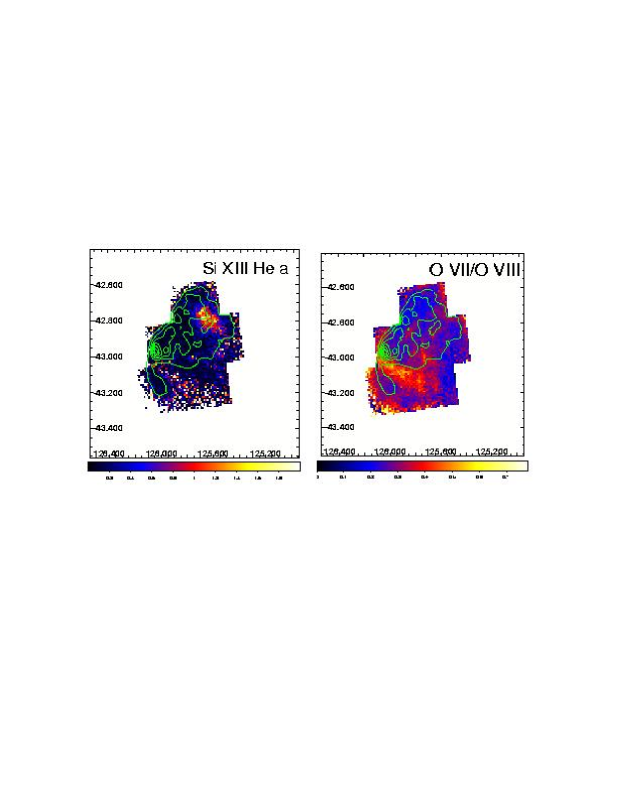
Element abundances aside, we also briefly consider the O VII Res/O VIII Ly ratio image as an example of a single-element line-ratio image that can be used to diagnose conditions in the X-ray emitting plasma (Figure 4; the analogous image for Ne is similar and not shown). Ideally the ratio should be for line emission only, but we have taken the ratio without subtracting the continuum; the true continuum level is difficult to determine at this spectral resolution, and the O VII line in particular is rather weak. The image highlights the SE Low SB region that extends southward from the BEK, as well as the eastern edge of the BEK, but cannot tell us to what extent the O VII enhancement is caused by temperature, ionization age, or column density differences. Imaging spectral observations with Chandra indicate that the BEK is composed of at least two physical components, with the easternmost of these at lower temperature, lower ionization, and higher column density (Hwang et al. 2005). Except for the higher column density, these would contribute to the observed enhancement of O VII/O VIII at the eastern edge of the BEK. Likewise for the low surface brightness region, further constraints from spectral analysis are needed to understand the enhancement observed.
3 Spectral Analysis
While the EQW images provide an easily accessible overview of where in the remnant the line emission is enhanced, a quantitative interpretation is not possible from these images alone. First, it must be known how temperature, ionization, and element abundances affect the line strengths relative to the continuum, and this depends on the underlying spectral model assumed. Moreover, the parameters of any model are not expected to be uniform throughout the remnant. Second, the continuum estimation can be accurate only if the “continuum” regions are truly line-free to start with, but this is not usually a safe assumption for lines such as those of O or Ne that lie at energies where the spectra are dense with line emission. Finally, a two-point interpolation is the only feasible method to estimate and subtract the continuum here, but it lacks sophistication and probably accuracy. EQW images are thus most likely to be useful if the line emission is very strong and well-isolated; for example, in tracing the qualitative large-scale morphology of known, strong ejecta enhancements as in Cas A (Hwang et al. 2000). They are less reliable when searching for relatively modest ejecta enhancements. To support the conclusions of the imaging analysis, it is thus necessary to turn to the X-ray spectra, as we do next.
We extracted spectra across the portion of the remnant imaged by Suzaku in a grid following the procedure used by Hwang et al. (2005) for Chandra observations of the BEK. Spectra were extracted for 259 square and rectangular regions of angular size 100-200′′, with each spectrum containing at least 10,000 counts. We focus on the spectral results for the BI chip.
The spectra were binned to 25 counts per channel and were fitted using XSPEC with nonequilibrium ionization (NEI) models for a plane parallel shock, modified by interstellar absorption using cross sections from Morrison & McCammon (1983). The models are characterized by the temperature and the limiting ionization ages; we take the lower limit for the ionization age to be fixed at cm-3 s and have fitted only for the upper limit. Element abundances were varied for O, Ne, Mg, Si (with S, Ar, and Ca linked to Si), and Fe (with Ni linked to Fe).
The spectral models must be converted to pulse-height spectra for comparison to the data. This conversion is carried out with an effective area file giving the total efficiency to detect a photon of a given energy, and a response matrix for the distribution of photon energy with pulse height. Both of these responses can vary depending on the region of the detector used and the specific observation conditions. An important time-dependent effect is the reduction in XIS low energy efficiency caused by the build-up of contaminants on the optical blocking filter (Koyama et al. 2007). This effect is included in the effective area calculation (Ishisaki et al. 2007). CCDs are also damaged by radiation with the passing of time causing degradation in the energy resolution and gain. While this effect is now ameliorated by charge injection, charge injection was not used for these early observations. We compensate by fitting the spectrum with an overall scaling factor for the gain (usually 0.993 to 0.996).
The observations were spread out over only two days, and there was no discernable change in the response matrices computed for the various observations. We use the matrix appropriate for an observation using the entire CCD chip because the current matrices do not reproduce differences in response across the detector.
The effective areas are another story. Ideally, the effective area should be computed for the specific region on the detector used for a given spectrum, but this requires time-consuming ray-tracing simulations for each spectrum. This was impractical for us given limitations in computer power and the large number of spectral regions involved. The good signal-to-noise level of our data allowed us to use relatively small spectral regions, but this makes the effective area compuations even more time-consuming. We therefore compared the results of spectral fits using several ray-tracing simulations of the effective area: five for relatively large regions ( radius) on the detector (center, top and bottom to the left and to the right) and also a smaller 2′ grid region. Using the same spectrum and response matrix, but different effective area files, we find that the temperatures remain very consistent; abundances and ionization ages vary from a few to 10 percent, and the column density variation by less than twenty percent. For all the fits presented in this paper we used the simulation for a radius region on the center of the detector, which amounts to neglecting the energy- and spatial-dependent effects of vignetting and the contaminant on the optical blocking filter. The vignetting removes photons from the edge of the detector and is more severe at high energies, while the contamination removes photons from the center of the detector and is more severe at low energies (see Ishisaki et al. 2007). The two effects tend to compensate, but the overall effect is complicated. Since the spectrum of Puppis A peaks at around 1 keV, neither effect should be too severe. Given that the variation in the spectral parameters across the remnant is significantly larger than the spread in spectral parameters that we find from using different effective area computations, we consider this to be an acceptable simplification. The biggest limitation imposed by the lack of fully correct effective area calculations throughout the remnant is that we are not able to obtain accurate model emission measures.
Given the uncertainties in the spectral response described above, we do not give numerical values of the spectral parameters obtained for the entire grid. Rather we present an overview of the fitted temperatures, ionization ages, column densities, and abundances in Figure 5, with the smoothed Suzaku broadband mosaic image contours overlaid for reference. The fitted parameters are represented for each region by the color scale. Spectra and the fitted model parameters are shown in Figure 6 and Table 3 for a small sample of interesting spectral regions.
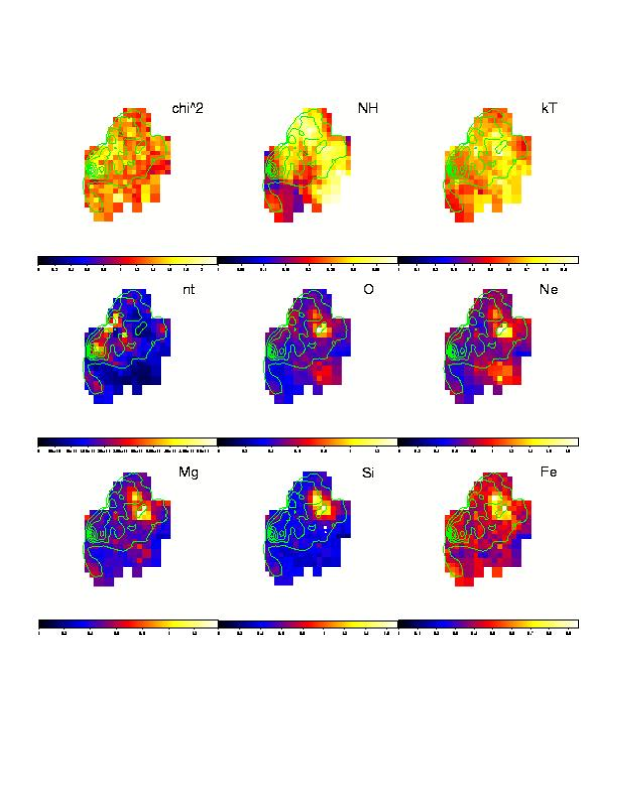
Figure 5 shows that the quality of the fits is generally fair, with all but a few values of the per degree of freedom falling below 2. While not formally acceptable in a statistical sense, we consider it acceptable given that the model is simple and many of the spectra a few tens of thousands of counts or more. Column densities are distributed mostly between about 0.13 to 0.35 cm-2, and are at the higher end of this range in the north and center, away from BEK. The regions of high absorption generally correspond to the spectrally harder regions in the ROSAT images (Aschenbach 1994). The upper ionization age is typically cm-3s, but is particularly high along a relatively narrow ridge behind the straight portion of the NE SF on to the inside of the BEK. Since the gas near the shock front should have been shocked relatively recently, these high ionization ages (which exceed cm-3s) are consistent with high gas densities. The lowest ionization ages occur in the SE Low SB region, as might be expected since the low surface brightness indicates low gas densities. The temperature map is somewhat patchy, but more uniform than the others, with temperatures distributed fairly uniformly between 0.5-0.8 keV.
The abundance maps all show a prominent double peak at the Si Knot in the north central region. Two strong peaks are seen in Mg, Si and Fe, but the southernmost of these is more prominent in O and Ne. All the fitted element abundances have their peak values in this region; these are all above solar, except for Fe. Ne and Si have higher peak abundance values than the other elements, but Ne abundances are skewed higher than the other elements throughout the remnant. In most of the remnant, O, Mg, Si, and Fe abundances are generally between 0.3 to 0.6-0.7 solar, but the Ne abundances fall mostly between 0.55-0.85 solar. Ne and Mg lines are blended with Fe L emission, so their abundances are somewhat more model-dependent than those of elements with cleaner line emission, such as Si. It should also be noted here that sub-solar abundances are the norm in Puppis A when the spectra are fitted with single-component models. For example, Tamura (1995) typically required abundances from 0.1 to 0.6 solar for the ASCA spectra.
The O and Ne abundance maps are patchier than the others. The fitted abundances are lowest in the SE Low SB region, and highest in the southern peak of the Si Knot; we refer to this as the O Knot Center in Table 3 (=125.67 =-42.84). The absence of this feature in the O EQW image (not shown here) underlines the difficulty of identifying O ejecta from the X-ray images alone; the imaging analysis is particularly difficult for lines like those of O that lie in crowded spectral regions. Only by examining the spectra could we learn that the O abundance is high at the Si Knot. Ne shows another relative enhancement in an extended region just south of the broadband contours that is also echoed more faintly by O. This region is clearly visible in the Ne difference image in Figure 3, so we refer to it as Ne Knot South in Table 3 (=125.66, =-43.12). For Mg, Si and Fe, the Si Knot is the only region with a definite element enhancement.
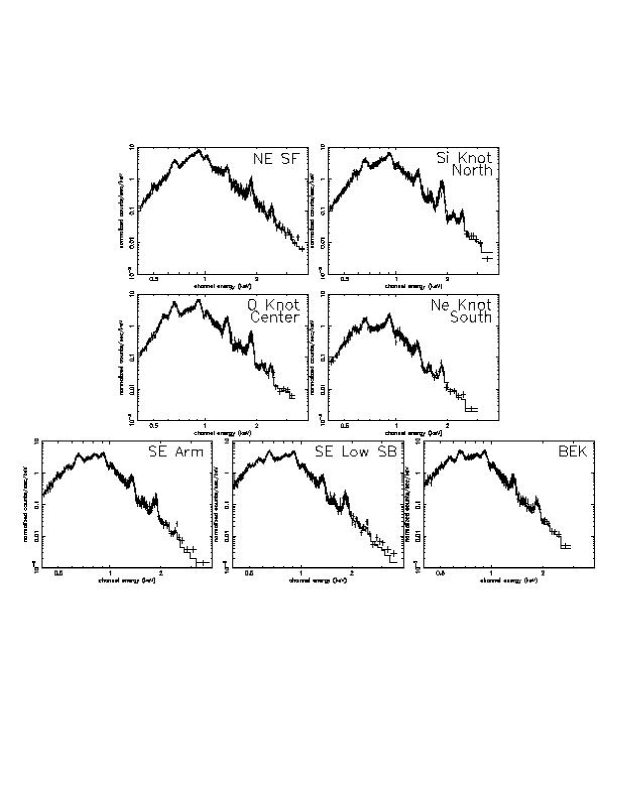
We take a closer look at a few spectra selected for their interest, in Figure 6. The top panel compares the spectrum of a region in the northern peak of the Si Knot with one in the NE SF. Both have strong Si line emission in the Si line image in Figure 2, but only the Si Knot knot has enhanced EQW (Figure 4) and enhanced Si abundance from spectral fitting. The Si He-like blend is indeed stronger at the knot. From Table 3, we see that the column densities and temperatures are similar for the two fits, whereas the NE SF has a somewhat higher ionization age. All the fitted element abundances are higher by at least a factor of two at the Si Knot compared to the NE SF, with Si being higher by a factor of four. Given that the statistical errors are quite tight, the Si Knot is clearly enriched with ejecta.
The second panel shows two spectra with O and Ne enhancements—those of the O Knot Center (the southern peak of the Si Knot) and the Ne Knot South. While the O Knot Center also has higher-than-average abundances for all the elements except perhaps Fe, the Ne Knot South does not really show evidence for significant enhancement of elements other than Ne, which is especially prominent; O is only slightly higher than average.
In the bottom panel of Figure 6, we compare regions without significant abundance enhancements—the SE Arm extending south from the BEK, the SE Low SB region, and the eastern edge of the BEK. The latter two are prominent in the O VII/O VIII ratio image, and the SE Low SB region also appears in the O VIII Ly EQW image. Enhanced O VII/O VIII in the SE Low SB region and the BEK is affirmed by the spectra, as the O VII line is clearly stronger in these regions than in the SE arm, whereas O VIII emission is comparably strong in all three regions. Enhanced O EQW in the SE Low SB region is not affirmed by the fitted O abundance, however. The explanation would appear to be that the “continuum band” used to subtract the continuum contribution (“Cont 1” at 0.70-0.79 keV from Table 2) is relatively weaker here (due in part to lower Fe abundance), which artificially enhances the O EQW. The spectral parameters given in Table 3 show that these three regions have similar columns, temperatures, and abundances. The primary difference is a lower ionization age for the SE Low SB region, which is enough to shift the ion balance in favor of He-like O and to enhance the O VII/O VIII line intensity ratio. Compared to other regions in the remnant, the SE Low SB region also has very low column density and relatively low temperature, which combines with the low ionization age to enhance O VII relative to O VIII.
| Region | N | kT | O | Ne | Si | Fe | ||
|---|---|---|---|---|---|---|---|---|
| J2000 RA, DEC | cm-2 | (keV) | cm-3s | |||||
| NE SF | 587.4, 1.41 | 0.345 | 0.708 (0.707-0.727) | 2.63e11 (2.56-2.72e11) | 0.53 (0.51-0.56) | 0.64 (0.63-0.67) | 0.41 (0.38-0.43) | 0.45 (0.44-0.47) |
| 125.89, -42.79 | ||||||||
| Si Knot | 558.6, 1.56 | 0.33 | 0.88 (0.87-0.91) | 6.5e10 (6.3-6.9e10) | 0.86 (0.84-0.89) | 1.27 (1.24-1.33) | 1.5 (1.4-1.6) | 0.94 (0.90-0.97) |
| 125.70, -42.76 | ||||||||
| O Knot Center | 510.7, 1.49 | 0.35 (0.33-0.36) | 0.77 (0.73-0.86) | 7.1e10 (6.2-7.2e10) | 1.3 (1.1-1.4) | 1.8 (1.7-2.0) | 1.3 (1.2-1.3) | 0.57 (0.54-0.65) |
| 125.67, -42.84 | ||||||||
| Ne Knot South | 271.0, 1.14 | 0.30 | 0.66 (0.64-0.68) | 5.30e10 (5.28-5.30e10) | 0.73 (0.70-0.75) | 1.41 (1.35-1.46) | 0.48 (0.39-0.54) | 0.41 (0.38-0.44) |
| 125.66, -43.12 | ||||||||
| SE Arm | 479.2, 1.45 | 0.22 | 0.50 (0.48-0.52) | 1.95e11 (1.62-2.03e11) | 0.42 (0.41-0.45) | 0.67 (0.63-0.70) | 0.47 (0.43-0.51) | 0.50 (0.45-0.54) |
| 126.05, -43.15 | ||||||||
| SE Low SB | 489.8, 1.42 | 0.173 (0.166-0.183) | 0.64 (0.61-0.68) | 8.2e10 (7.4-9.0e10) | 0.35 (0.32-0.37) | 0.61 (0.59-0.63) | 0.43 ( 0.37-0.47) | 0.39 (0.36-0.42) |
| 125.91, -43.14 | ||||||||
| BEK, east edge | 363.7, 1.23 | 0.15 (0.14-0.17) | 0.58 (0.52-0.59) | 1.1e11 (1.0-1.3e11) | 0.38 (0.35-0.40) | 0.69 (0.64-0.74) | 0.40 (0.34-0.49) | 0.43 (0.38-0.47) |
| 126.08, -42.98 |
4 Discussion
To summarize the observational results, Suzaku clearly detects X-ray emitting ejecta in Puppis A, and shows where it is located. The most striking feature of the spectral maps is the spatial correlation of the element abundances, especially at the location of the Si Knot. All the elements are found to be particularly enriched this region, with Si appearing to show the most enrichment relative to other regions. Ne, and to a lesser extent O ( but not other elements), is also enriched in the south center of the remnant.
The two peaks of the Si Knot are both regions with somewhat higher-than-average temperatures, but even a forced temperature of 0.6 keV closer to the remnant average requires clearly enhanced element abundances (Si=1.3 and O=0.65 for the weaker northern peak of the knot). We consider it more likely that the temperature difference is real and is associated with the different composition of the knot compared to its surroundings.
The spectral parameters also show strong patterns. The high column density to the north (combined with relatively uniform temperature) echoes the patterns seen in spectral hardness by ROSAT. There is some hint that the fitted column densities may be correlated with detector position in the two northernmost fields (covering the northern peak and the interior southwest of it), with the center of the detector giving higher values. The other fields do not give the same impression, however, and the large-scale differences in column density are certainly robust. The ridge of high ionization age that follows the boundary of the northeast shock front is qualitatively consistent with the strong interaction of the blast wave seen in that region. Radio HI observations show a very large molecular cloud whose straight edge fits against the X-ray boundary of the remnant (Reynoso et al. 1995). The blast wave will be strongly decelerated as it propagates through the dense cloud, but the reflected shock will be associated with higher temperature gas (cf. Levenson et al. 2002). The difference in ionization age is a factor of several on the ridge compared to the region behind it, and implies a comparable density difference assuming that the shock times are roughly the same. Higher angular resolution observations would be useful to make more reliable quantitative estimates, but in any case, the relative narrowness of the ridge seems to suggest that there was a sudden increase in the ambient gas density, which presumably occured at the boundary of the molecular cloud.
The Chandra study of the BEK region in Puppis A showed that there are significant spectral differences even within the BEK. The eastern 0.5′ of the region is a compact knot having different spectral parameters from the portion of the BEK to the interior. These differences are unfortunately not accessible to this study, being on too small an angular scale compared to the angular resolution of the spectral grid. Nevertheless, it is encouraging to see that other, somewhat larger scale spectral features seen in the BEK region by Chandra are also seen by Suzaku. For example, there is a clump of high ionization age gas inside the main part of the BEK which corresponds well with the bottom end of the “ridge” of high ionization age in the Suzaku map. The increase in temperature just north of the BEK is also reproduced by the Suzaku analysis. The only sufficiently large angular-scale spectral feature that we did not see reproduced in the Suzaku spectral images is the higher column density gas, not only at the eastern edge of the BEK, but also at the eastern boundary above and below it. We do not have a complete explanation for this, but it may be related in part to the contaminants that build up on CCDs, since these reduce low energy sensitivity and can be masked as increased absorption column densities; this is relevant for both the Suzaku and Chandra CCDs.
The overall subsolar element abundances also require some comment. As noted earlier, similarly low abundances had been obtained by Tamura (1995) in his analysis of ASCA X-ray spectra, but there are otherwise no indications that the interstellar medium around Puppis A has depleted element abundances. Dust depletion is a possibility, given the brightness of the remnant at infrared wavelengths, and the excellent correlation of infrared and X-ray morphologies (Arendt et al. 1990). Dust is clearly present in the remnant and is apparently collisionally heated. The signature of dust depletion in the X-ray emission would be higher Ne abundance to that of O, Mg, Si, and Fe, since Ne is not depleted onto dust grains as are these other elements. The Ne abundance does have a tendency to be slightly higher than that of O in Puppis A, but so is the Si abundance. Moreover, the Ne abundance in CCD-resolution spectra is subject to additional uncertainty because the Ne lines are blended with the complicated Fe L line emission. In the south-central Ne knot of Puppis A, the fitted Ne abundance is near the solar value and significantly enhanced relative to the other elements; perhaps this is a region where dust depletion is important. The Ne abundance is nevertheless generally fitted at subsolar values, however, so it would appear that the overall abundances are indeed subsolar, independent of any depletion of some of the elements onto dust grains.
Element abundances obtained from an overly simple spectral model may be inaccurate, but there are no definite indications of additional components in Puppis A that would, if present and unaccounted for, result in artifically lower element abundances. Neither is Puppis A an isolated incidence of low abundances inferred for the ISM-phase of a supernova remnant. The Cygnus Loop in particular has yielded extremely low ISM-phase abundances of 0.1-0.2 solar to analysis using data from ASCA (Miyata et al. 1994), Chandra (Levenson et al. 2002, Leahy et al. 2004), XMM-Newton (Tsunemi et al. 2007) and Suzaku (Miyata et al. 2007). Finally, the interstellar medium in the Magellanic Clouds is known to have subsolar abundances that are in fact reproduced by Sedov models fitted to the entire remnant spectrum (Hughes et al. 1998)222Plane-parallel shocks should provide a good approximation to Sedov models (Borkowski et al. 2001)..
4.1 Lack of Widespread O Enrichment
The modest O ejecta enrichment seen with Suzaku is at odds with the significant enrichment of O and Ne relative to Fe that was reported by Canizares & Winkler (1981; hereafter CW81). In most regions of Puppis A, we do not see O significantly enhanced relative to Fe, even where O is enhanced above its average value. This echoes earlier spectral studies of Puppis A with the Einstein Solid-State Spectrometer (Szymkowiak 1985) and the ASCA Solid-State Imaging Spectrometer (Tamura 1995), neither of which found a significant O/Fe enrichment anywhere in Puppis A. The FPCS has also reported enrichments of O relative to Fe for other sources, including M87 and the supernova remnant N132D. For M87, XMM-Newton Reflection Grating Spectrometer observations indicated a O/Fe abundance ratio of 0.5 (Sakelliou et al. 2002), compared to the factor of 3-5 enrichment reported by the FPCS (Canizares et al. 1982). For N132D, ASCA finds that O/Fe is roughly solar (Hughes, Hayashi, & Koyama 1998), in contrast to values of twice solar or higher as deduced from Einstein observations (Hwang et al. 1993).
The Einstein FPCS observations were the first high-resolution X-ray spectra ever obtained of non-solar cosmic sources—and the FPCS observation of Puppis A was the very first of these. The FPCS used a number of different crystals to scan limited energy ranges around a feature of interest. The calibration was thus challenging, and not fully optimal because the calibration data files taken just prior to launch were unusable. The final calibration was based on extensive, earlier laboratory measurements333Mark Schattenburg, private communication. For M87, the relative abundance estimate was based on the O VIII Ly line at 654 eV and the Fe XVII line at 826 eV, for which two different crystals were required to scan the separate lines, adding to the calibration uncertainties. This uncertainty is eliminated for the observations of Puppis A and N132D since a single crystal was used to scan the O VIII Ly (816 eV) and Fe XVII lines for the relative abundance determination. There is added uncertainty, however, in that this is a crowded spectral region, and the relatively weak Ly line had to be modelled carefully.
For Puppis A, the assumptions made by CW81 to interpret their spectra were reasonable enough at the time, but updated X-ray observations and atomic physics show some possible pitfalls. These can be summarized as arising from (1) the assumption of a single-component (i.e., single temperature, single ionization age) plasma within the large FPCS apertures (2) comparison to a solar coronal spectrum with a temperature distribution that turns out not to be appropriate for most of Puppis A (3) the assumption that Fe XVII is always the dominant Fe ion species when O VII and O VIII ions coexist. (1) Spectral maps of Puppis A, including the one in this work, clearly show a wide variety of temperatures, column densities, and ionization timescales throughout the remnant. (2) From the same maps, we see that temperatures in Puppis A are relatively high, averaging near 0.6 keV. By contrast the solar coronal spectrum used to calibrate the FPCS observations peaked at roughly 0.2 keV (3) Evaluation of the ion populations using the NEI models in XSPEC show that O VII, O VIII, and Fe XVII do not necessarily coexist as assumed, particularly at temperatures below kT=0.2 keV and, more pertinently for this discussion, at temperatures above kT=0.6-0.7 keV. The same evaluation of ion populations show that they can vary by factors of at least 3-5 in the optically thin NEI models, particularly when ionization effects are also taken into account.
Given the foregoing, we believe that the current Suzaku abundance results are more accurate, the high spectral resolution of the FPCS notwithstanding.
4.2 Spatial Correlations
Although the peak abundances for the different elements vary from subsolar (Fe) to nearly twice solar (Ne and Si), the abundance maps all have the same general appearance, with the double-peaked Si Knot being the most prominent feature throughout. At the southern peak, all the elements with line emission have element abundances that are significantly higher than average, and reach their highest values (in this survey). The northern peak of this knot is relatively weaker for O, Ne, and Mg compared to Si, but when the errors on the fitted abundances are considered (Table 3), there is no significant difference in the Si/O abundance ratio at the northern vs the southern peak. The presence of Si ejecta at a radius comparable to that of O ejecta is certainly interesting, because supernova ejecta may be either hydrostatic or explosive in origin; O is synthesized completely hydrostatically by the progenitor before the explosion, and Si in the inner layers of the exploding star. Thus Si originates close to the center of the explosion, but has been propelled outward in the northern region of Puppis A and mixed with O and Ne ejecta.
Most of the fast optically emitting ejecta [O III] knots reported by Winkler et al. (1985) are in the eastern half of Puppis A observed with Suzaku. The bulk of them lie 25 to 90 degrees east of north, at 5′ to 9′ from the explosion center determined from their proper motions (this center is indicated in the Si map subpanel of Figure 5). Many of the optical knots are part of a large (roughly ) tangle of [O III] filaments lying to the south and east of the southern peak of the X-ray Si Knot. A smaller clump of optical knots touches the X-ray knot at its southeastern boundary. Thus, while the optically emitting O ejecta are in the general vinicity of the O element abundances identified through the X-ray spectral fits, there is no close physical correspondence between the optical and X-ray emitting ejecta. On the whole, the X-ray and optically emitting O ejecta appear to be spatially disjoint.
It is clear from the Suzaku observations that the Si knot is the only example of significant Si ejecta enhancement in the eastern half of Puppis A. In a result simultaneous with the preparation of this paper, Katsuda et al. 2007 (in preparation) independently confirm the Si enhancement here using XMM-Newton data, which provides complementary coverage to Suzaku of the western half of the remnant. They survey a larger fraction of the remnant, but do not find other regions with substantial Si ejecta enrichment. If we allow that the average interstellar element abundances near Puppis A are below the solar value, it would appear that Fe is enhanced at the Si Knot as well, since the fitted Fe abundances are higher here than elsewhere in the remnant. The Si Knot is thus the only recognizable structure that contains significant amounts of any explosively synthesized ejecta, whether Si or Fe. Unlike the case in Cas A, where there is evidence for physical separation of the Si and Fe ejecta (Hughes et al. 2000), Puppis shows Si and Fe ejecta that appear to be coincident with each other, as well as being mixed with lower Z elements.
4.3 Knot Ejecta Mass Ratios
The north central knot being the cleanest sample of ejecta in the remnant, we consider how its element abundances compare to the predictions of nucleosynthesis models. We convert the fitted element abundances in Table 3, which are by number relative to the solar values of Anders & Grevesse (1989), to the ratio of the element mass relative to that of Si. The observed mass ratios are compared to various calculations of core-collapse supernova nucleosynthesis by Woosley & Weaver (1994), Thielemann et al. (1996), Rauscher et al. (2002) and Limongi & Chieffi (2003).
Nucleosynthesis calculations are complex, and are sensitive to the treatment of the stellar and nuclear physics, some of which is not yet fully understood. For these reasons, models have yet to converge in detail on what the element mass ratios should be for a progenitor of given mass. The models we consider predict that a Type II explosion for a 25 M⊙ progenitor should produce 0.1-0.3 M⊙ Si ejecta, with the models of Thielemann et al. giving Si masses at the low end of this range. Considering the various model calculations for abundances of O, Ne, Mg, and Fe relative to Si, we do not find perfect agreement with the observed mass ratios, but progenitors between 15 and 25 M⊙ appear to be generally indicated. In no case do we find a plausible model for a progenitor more massive than 30 M⊙, whereas models are seldom computed for masses below about 15 M⊙.
Of course, this particular knot need not even be a representative sample of the global ejecta abundances, but at the least it is reassuring that the high abundances of O, Ne and Mg relative to Si require a core-collapse rather than a thermonuclear explosion.
It is challenging to put tight constraints on the progenitor of Puppis A from the X-ray observations because the remnant is relatively old and most of the X-ray emission is dominated by interstellar material, some of which is highly structured as dense clouds. Even where ejecta are present, they are mixed with ISM, but complex models cannot always be reliably constrained using moderate-resolution X-ray spectra. We have only considered simple one-component models. Technically, the presence of a second component could skew the derived ejecta, but this should tend to increase the element abundances. We found that if we did attempt to add a second thermal component representing emission behind the blast wave (hence with the blast wave abundances fixed at 0.4 solar), the fitted ejecta abundances increased overall by a factor of two or so; the temperature and ionization age for the Si Knot did not change much, increasing by no more than 10-20%. We chose not to use two-component fits throughout because the spectra generally cut off above 2-3 keV, and we considered it difficult to put believable constraints on a second component. In any case, this is a conservative assumption for identifying ejecta enhancements, as we have pointed out.
In spite of the remnant’s advanced age, the ejecta in this mature remnant are tantalizing to pursue for the hints it may give to the explosion that formed it. Ideally, better angular resolution is desirable since Chandra observations (Hwang et al. 2005) have hinted at relatively small localized regions with abundance enhancements. These may contribute to the patchy, low-level enhancements seen with Suzaku. Aside from the X-ray emitting Si Knot, the remaining Si may either already be shocked and cooled, shocked and diluated, or still unshocked. If the former, we might hope to see it in optical emission, but optical [S II] emission in Puppis A resembles H emission rather than the X-ray Si emission, and appears more likely to be associated with blast wave emission (P. F. Winkler, private communication). Shocked and diluted Si will be difficult to detect with the significant dilution by the ISM expected for Puppis A after 4000 years. Roughly 0.1 M⊙ of Si is present in a few hundred solar masses of interstellar material at 0.4 solar abundances. Unshocked ejecta might be revealed by infrared observations, but the available data are unfortunately insufficient for identifying ejecta (Arendt et al. 1990). We hope that future observations will shed interesting light on the ejecta in Puppis A.
References
- (1) Anders, E., & Grevesse, N. 1989, Geo. et Cosmo. Acta, 53, 197
- Arendt et al. (1990) Arendt, R. G., Dwek, E., Petre, R., Dickel, J. R., Roger, R. S.,Milne, D. K., & Kesteven, M. J. 1990, ApJ, 350, 266
- Aschenbach (1994) Aschenbach, B. 1994, New Horizon of X-ray Astronomy, ed. F. Makino & T. Ohashi, 103
- (4) Borkowski, K. J., Hendrick, S. P., & Reynolds, S. P. 2006, ApJ, 652, 1259
- (5) Borkowski, K. J., Lyerly, W. J., & Reynolds, S. P. 2001, ApJ, 548, 820
- (6) Canizares, C. R., & Winkler, P. F. 1981, ApJ, 246, L33
- (7) Dubner, G. M, & Arnal, E. M. 1988, A&AS, 75,363
- (8) Fesen, R. A., et al. 2006, ApJ, 636, 859
- (9) Hendrick, S. P., Borkowski, K. J., & Reynolds, S. P. 2003, ApJ, 593, 370
- (10) Hendrick, S. P., Reynolds, S. P., & Borkowski, K. J. 2005, ApJ, 622, L117
- (11) Hughes, J. P., Ghavamian, P., Rakowski, C. E., & Slane, P. O. 2003, ApJ, 582, L95
- (12) Hughes, J. P., Hayashi, I., & Koyama, K. 1998, ApJ, 505, 732
- (13) Hwang, U., Flanagan, K. A., & Petre, R. 2005, ApJ, 635, 355
- (14) Hwang, U., Holt, S. S., & Petre, R. 2000, ApJ, 537, L119
- (15) Hwang, U., Hughes, J. P., Canizares, C. R., & Markert, T. H. 1993, ApJ, 414, 219
- (16) Ishisaki, Y., et al. 2007, PASJ, 59, S113
- (17) Koyama, K., et al. 2007, PASJ, 59S, 23
- (18) Leahy, D. 2004, MNRAS, 351, 385
- (19) Levenson, N. A., Graham, J. R., & Walters, J. L. 2002, ApJ, 576, 798
- (20) Limongi, M., & Chieffi, A. 2003, ApJ, 592, 433
- (21) Mitsuda, K. et al. 2007, PASJ, 59, 1
- (22) Miyata, E., et al. 1994, PASJ, 46, L101
- (23) Miyata, E., et al. 2007, PASJ, 59, S163
- (24) Morrison, R., & McCammon, D. 1983, ApJ, 270, 119
- (25) Park, S., Hughes, J. P., Burrows, D. N., Slane, P. O., Nousek, J. A., Garmire, G. P., 2003, ApJ, 598, L95
- (26) Petre, R., Canizares, C. R., Kriss, G. A., & Winkler, P. F. 1982, ApJ, 258, 22
- Petre et al. (1996) Petre, R., Becker, C. M., & Winkler, P. F. 1996, ApJL, 465, L43
- (28) Rauscher, T., Heger, A., Hoffman, R. D., & Woosley, S. E. 2002, ApJ, 576, 323
- (29) Reynoso, E. M., Dubner, G. G., Goss, W. M., & Arnal, E. M. 1995, AJ 110, 318
- (30) Sakelliou, I., et al. 2002, A&A, 391, 903
- (31) Szymkowiak, E. 1985, University of Maryland PhD Thesis
- (32) Tamura, K. 1995, Osaka University PhD Thesis
- (33) Teske, R. G., & Petre, R. 1987, ApJ, 314, 673
- (34) Thielemann, F.-K., Nomoto, K., & Hashimoto, M. 1996, ApJ, 460, 408
- (35) Tsunemi, H., et al. 2007, ApJ, in press, arXi:0710.1135
- (36) Winkler, P. F., et al. 1981, ApJ, 246, L27
- (37) Winkler, P. F., & Kirshner, R. P. 1985, ApJ, 299, 981
- (38) Winkler, P. F., & Petre, R., 2007, ApJ, 670, 635
- (39) Woosley, S. E., & Weaver, T. A. 1994, ApJS, 101, 181