Corresponding author, email: miwa9@lambda.phys.tohoku.ac.jp, Present address: ]Department of Physics, Tohoku University, Sendai 980-8578, Japan
Present address: ]Research Center for Nuclear Physics (RCNP), 10-1 Mihogaoka, Ibaraki, Osaka, 567-0047, Japan
Present address: ]Department of Physics, Osaka Electric Communication University, Osaka 558-8585, Japan
Present address: ]Department of Physics, Tohoku University, Sendai 980-8578, Japan
Present address: ]Department of Physics, Kyoto University, Kyoto 606-8502, Japan
Present address: ]KEK, High Energy Accelerator Research Organization, Tsukuba 305-0801, Japan
Present address: ]Research Center for Nuclear Physics (RCNP), 10-1 Mihogaoka, Ibaraki, Osaka, 567-0047, Japan
Present address: ]RIKEN, 2-1 Hirosawa, Wako, Saitama 351-0198, Japan
Present address: ]Present address: KEK, High Energy Accelerator Research Organization, Tsukuba 305-0801, Japan
Present address: ]Department of Physics, Kyoto University, Kyoto 606-8502, Japan
Search for via reaction with a 1.2 GeV/ beam
Abstract
The was searched for via the reaction using the 1.2 GeV/ beam at the K6 beam line of the KEK-PS 12 GeV Proton Synchrotron. In the missing mass spectrum of the reaction, no clear peak structure was observed. Therefore a 90 % C.L. upper limit of 3.5 b/sr was derived for the differential cross section averaged over 2o to 22o in the laboratory frame of the reaction. This upper limit is much smaller than the theoretical calculation for the -channel process where a is exchanged. From the present result, either the -channel process is excluded or the coupling constant of gK∗NΘ is quite small.
pacs:
12.39.Mk, 13.75.Jz, 14.20.-cI Introduction
Since the first report giving evidence of the existence of an exotic baryon LEPS , many papers from both theoretical and experimental aspects have been published review ; Goeke . The was observed as a narrow resonance of a system, giving its minimum quark content as . Therefore, if the would exist, it could have interesting consequences for non-perturbative QCD. The first observation by the LEPS collaboration was confirmed by several experiments DIANA ; CLAS ; SAPHIR ; CLAS2 ; nu ; HERMES ; ZEUS ; COSY ; SVD ; C3H8 . However, null results were also reported from several high energy experiments where they searched for the with much higher statistics HyperCP ; HERA-B ; ALEPH ; BES ; BABAR ; CDF ; SPHINX . Moreover, some of the initial positive evidence was refuted by the same collaboration with higher statistics CLAS3 ; CLAS4 ; COSY2 . On the other hand, the LEPS and DIANA collaborations have shown new evidence supporting its existence. The LEPS collaboration shows a narrow peak in the missing mass spectrum of the reaction LEPS2 . The DIANA collaboration confirmed its initial positive evidence with two times larger statistics DIANA2 . In this controversial situation, it is quite important to perform other experimental searches that would reveal the production mechanism of the by using various reactions.
If the exists, one of its most remarkable features would be its narrow width. The observed width is consistent with the experimental resolution in all positive experiments. Moreover reanalyses of the past -nucleon elastic scattering restricted the width to be less than a few MeV/ Arndt . Cahn and Trilling calculated the width from the result of the DIANA experiment, where the was observed via the charge exchange channel of , and obtained the width of 0.9 0.3 MeV/ Cahn . Such narrow width is unusual for a hadron resonance. In order to understand the narrow width, theoretical models were proposed that take into account an additional correlation between quarks Diakonov ; JaffeWilczek ; Lipkin ; Kishimoto ; Enyo ; Hiyama . The different dynamics of several models results in different values of the spin and parity. Therefore experimentally, if the exists, it is quite important to determine its spin and parity to understand the nature of the and hence its quark dynamics. For this purpose, experiments with high statistics are needed. Hadronic reactions fulfill these requirements, because the production cross section via a hadronic reaction is expected to be much larger than that of a photoproduction reaction. Theoretically, the cross section of the reaction is expected to be 80b Oh2 .
High-resolution spectroscopy is another important point. Because the width of the is expected to be narrow, high resolution is essential in order to measure its width with high experimental sensitivity. Therefore we were motivated to do an experiment using a beam and a high resolution spectrometer to search for the with high statistics.
A different experiment, the E522 collaboration, reported a search for the via the reaction e522 , finding a bump structure near 1.53 GeV/ in the missing mass spectrum off the . The statistical significance of the bump was 2.5 - 2.7 and was not sufficient to claim the existence of the . The upper limit of the production cross section was found to be 3.9 b. This reaction is just the inverse reaction of . In both reactions, the same coupling constants are used in the production diagrams. A deeper understanding on the production mechanism can be obtained by considering both experimental results.
Theoretical calculations in hadronic models using effective interaction Lagrangians and form factors were made by several authors Ko ; Oh ; Oh2 ; Hyodo ; Hyodo2 . They studied the production mechanism in and reactions near the production threshold comprehensively. In general all calculations predict a large production cross section for the reaction. For the production process, they took into account both the t-channel process, where was exchanged, and the u-channel process, which includes intermediate states. In these calculations, unknown coupling constants, gKNΘ and gK∗NΘ were used. Therefore measurements of both and reactions are useful to compare with theory.
In this paper, we show the results of a search for the via the reaction. We discuss the production mechanism considering both experimental results of and reactions.
II Experiment

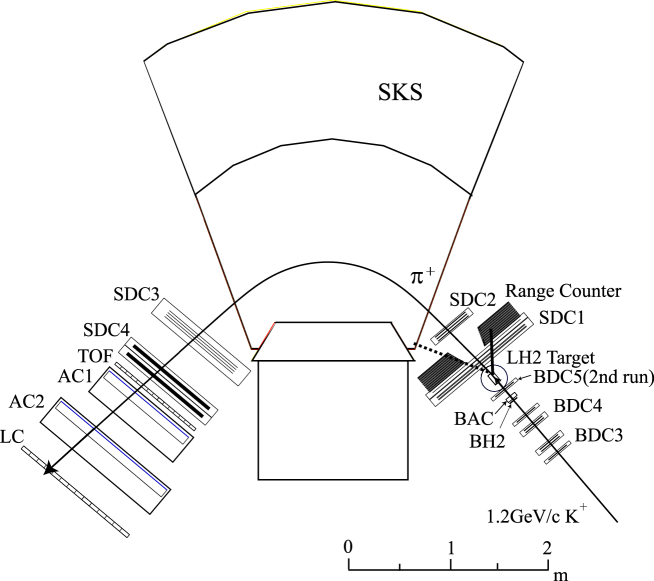
In order to search for the via the reaction using a high-resolution spectrometer called SKS SKS , an experiment has been performed at the K6 beam line of the KEK 12 GeV proton synchrotron (KEK-PS E559). Data were taken in two separated periods; one month in June 2005 (1st run) and two weeks in December 2005 (2nd run). We searched for the using the missing mass technique by detecting incident beam particles and an outgoing using the K6 beam line spectrometer and the SKS spectrometer, respectively. Originally, the K6 beam line and SKS spectrometer were constructed for high-resolution spectroscopy of hypernuclei using high intensity beam particles Hotchi ; Hashimoto . The advantage of the present experiment is the excellent mass resolution of 2.4 MeV/ (FWHM) which is comparable to the expected width of the . In this reaction, a large background is present, which originates from and productions with cross section of 5mb Bland , in addition to decays of the incident beam. The SKS provides good mass resolution leading to high sensitivity. The experimental setups of the K6 beam line and SKS spectrometers are shown in Fig. 1 and 2.
In the present experiment, for the first time a beam was used in this beam line. The central momentum of the beam was set to 1.2 GeV/, which was the maximum momentum of the K6 beam line. The K6 beam line supplied various mass-separated secondary beams using an electrostatic separator with two correction magnets. The ratio in the beam was about 0.1. The incident particle was defined by two hodoscopes (BH1, BH2) placed about 9 m apart. Protons in the beam were rejected at the trigger level using a time difference of 7 ns between protons and ’s. In order to reject beam ’s in the online trigger, an Aerogel Cherenkov counter (BAC), whose index of refraction was 1.06, was installed just upstream of a liquid hydrogen target system. The efficiency was 98.70.1% for 1.2 GeV/ ’s, while the overkill rate for ’s was 3.00.2%. Each incident particle was analysed with the K6 beam line spectrometer which consisted of a QQDQQ magnet system and drift chambers (BDC1234) located upstream and downstream of these magnets. The bending angle was 60 degree. The expected momentum resolution was =0.047% (FWHM).
| Reaction | Beam | Target | Number of beam (1st) | Number of beam (2nd) |
|---|---|---|---|---|
| () | 1.2GeV/ | LH2 | ||
| () | 1.2GeV/ | LH2 | ||
| () | 1.2GeV/ | empty | ||
| () | 1.1GeV/ | LH2 |
A newly developed liquid hydrogen target had a cooling system using a liquid helium. The hydrogen vessel was made from PET (Polyethylene Terephthalate) for the cylinder, and Mylar for the end caps. The target was 6.87 cm in diameter and 12.5 cm in length. During the experimental period, the volume and pressure of the target were monitored and fluctuated less than 1%.
The scattered ’s were detected with the SKS spectrometer located at forward angles. The magnetic field was 1.6 T, where the momentum of the central trajectory was 0.52 GeV/. The SKS covered the angular region smaller than 25∘ and had an acceptance in the laboratory frame of 0.11 sr for particles whose momentum was 0.46 - 0.60 GeV/. The momentum of each outgoing particle was analysed with four drift chambers (SDC1234) located upstream and downstream of the SKS magnet. The momentum resolution was estimated to be =0.42% (FWHM) from the difference of momenta analysed by both spectrometers for beam-through events. For particle identification, trigger counters (TOF, AC12, LC) were placed downstream of SDC4. Both TOF and LC hits were required to select a in the online trigger. Outgoing protons were rejected using LC. The LC efficiency was typically 95% for ’s. In offline analysis, the mass was reconstructed from the momentum and the time-of-flight between BH2 and TOF.
In order to suppress background events, we modified the detector setup around the target as shown in Fig. 2. For background events, there are hadronic reactions such as and . The total cross section of each reaction has been measured to be 3.750.32 mb and 1.060.20 mb, respectively Bland . However, the most serious background came from decay events of beam particles. Although the kinematical distribution of these two-body decays was out of the SKS acceptance, three-body decays ( and ) could be a large background which was ten times larger than that from hadronic reactions. Therefore the rejection of these decay events was crucial in the search for the . The decay events were separated from the reaction events using the difference of the angular distribution and the number of charged particles emitted in each event. For the three-body decays of the , one or three charged particles were emitted in the forward angle within 20∘, whereas two or four charged particles were emitted in the hadronic reaction events with final states or . When a was detected by the SKS, other charged particles were emitted at large angles (0 - 100 degrees for a and 0 - 50 degrees for a proton). Therefore, in order to detect all possible charged particles and measure the angle, a large acceptance drift chamber (SDC1) whose effective area was 1200mm1200mm was installed just downstream of the LH2 target. The SDC1 covered from 0 to 60 degrees. The SDC1 consisted of five planes (X,X’,Y,Y’,U). The maximum drift lengths were 4.5mm and 9.0mm for X, X’, Y and Y’ planes and U plane, respectively. The SDC1 measured the angle using hit information and vertex position obtained from trajectories of the and the . The decay events were suppressed in the offline analysis using SDC1. In order to improve the signal-to-noise ratio to detect an emitted , a range counter (RC) which had the same effective area with SDC1 was installed just downstream of SDC1. The RC consisted of 10 layers of plastic scintillators and 9 layers of brass absorbers, placed alternately. The thicknesses of the scintillator and the brass absorber were 8mm and 9mm, respectively. Each scintillator layer was segmented horizontally into 5 segments. The light from the scintillator was collected from PMT’s attached on the top and bottom ends. In order to avoid the scattering of outgoing ’s detected with SKS from the material of RC, there was a hole at the entrance region to the SKS magnet.
In total, and beam particles were irradiated in the 1st and 2nd runs, respectively. In addition to () events, we took () events in order to estimate some of cut efficiencies. The mass scale and resolution were calibrated using a peak produced via the reaction using a 1.1 GeV/ beams. The obtained data are summarized in Table 1.
III Analysis & Results
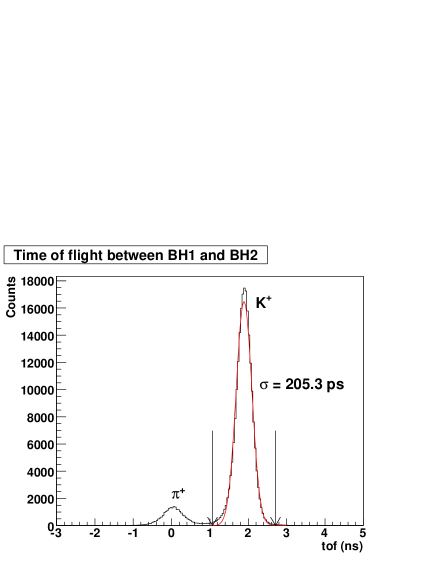
The analysis of beam particles consisted of the identification of particles and the analysis of the momentum. The incident beam particles were identified with time-of-flight between BH1 and BH2 as shown in Fig 3. A typical time difference of the and was 1.9 ns. The time resolution after a correction using the ADC was ps. We selected a region to identify particles. The beam momentum was reconstructed using hit information of the drift chambers and a third order transfer matrix.
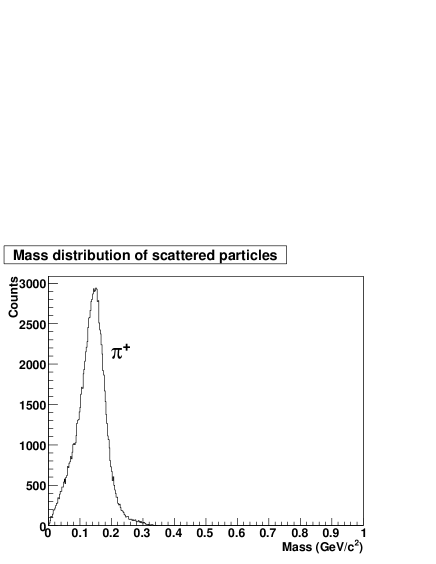
The trajectory of each scattered particle was reconstructed from its position in the drift chambers and a field map of the SKS magnet. The straight tracks were defined by fitting locally upstream and downstream of the SKS magnet. These local tracks were connected using the Runge-Kutta method Runge-Kutta . Tracks of reduced were selected as good tracks. In order to determine the limit, the peak width of the was checked for each reduced region. The cut position was determined as a region where a reasonable resolution (less than 3.3 MeV/ (FWHM)) was obtained. From the reconstructed mass distribution, the scattered ’s were clearly selected as shown in Fig. 4.
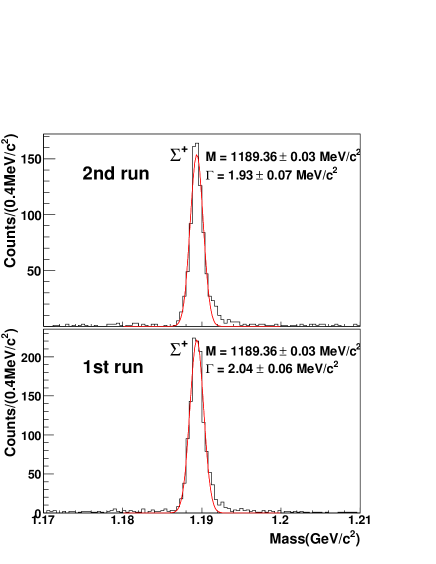
The validity of the analyses of both spectrometers was confirmed using the reaction taken for calibration with a 1.1 GeV/ beam. The missing mass spectra of the reaction are shown in Fig. 5 for the 1st and 2nd runs, where clear peaks of are identified. The obtained widths for both runs are consistent with the expected value of 1.98 MeV/ from a Monte Carlo simulation considering the momentum resolution of =0.047% (FWHM) and =0.43% (FWHM) for the K6 and SKS spectrometers. The absolute value of the momentum of outgoing particle was adjusted to make the peak consistent with its known value. The mass shift from the known value was 1 MeV/ which corresponded to 3 MeV/ correction of the momentum. This momentum correction corresponds to 2 MeV/ shift for the peak position of the . From Monte Carlo simulations, the missing mass resolution for the was estimated to be 2.4 MeV/ (FWHM). Because the peak positions of the are consistent for the 1st and 2nd runs, the missing mass resolution of the is not expected to decrease by adding the missing mass spectra of the 1st and 2nd runs.
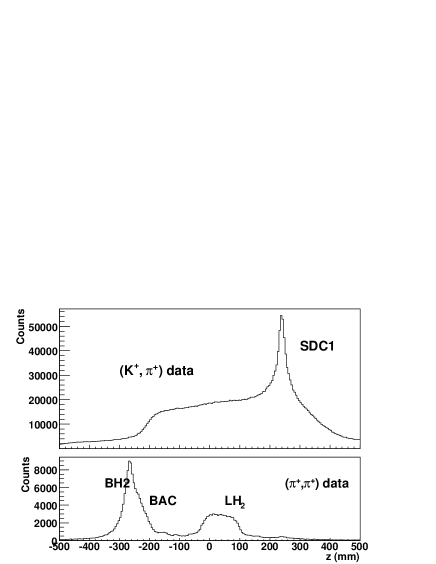
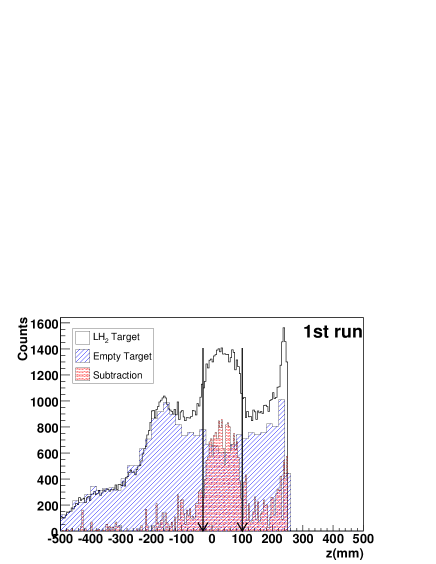
The vertex position was reconstructed at the point of the distance of closest approach between the incident and the scattered tracks. Fig. 6 shows the distribution of the vertex positions of the () and () data. In the vertex distribution of the () data, the image of the LH2 target, as well as BH2 and BAC, are clearly seen. On the other hand, in the () data, we could not recognized the LH2 target because almost all events of the () data are decay events. The peak structure around mm, which corresponded to the position of SDC1, was due to miscalculated events of beam particles that decayed between SDC1 and SDC2. In order to suppress these decay events, we used information on the number of tracks just after the target and their angles. In order to detect all possible charged particles, a large acceptance chamber (SDC1) was installed. Tracks other than measured with SKS were reconstructed from the hit information of SDC1 and the 1st layer of RC, and the reconstructed vertex position. Because more than two charged particles were emitted at large angles for hadronic reaction, the number of tracks just after the target was required to be more than two. When the number detected by SDC1 was two, i.e. one more particle other than detected with SKS, the angle of the second particle was required to be larger than 10∘. When the number was more than three, the angles of the second and third particles were required to be more than 15∘ and 23∘, respectively. The cut positions of these angles were determined so as to make a maximum, where is the number of hadronic reaction events and is the decay events in the vertex region between the arrows in Fig. 7. Fig. 7 shows the vertex distribution after this analysis of SDC1. The vertex of the LH2 target was seen once the decay events were removed. The hatched histogram shows the empty target data which is normalized using the beam flux. The dotted spectrum shows the subtraction of histograms of the LH2 target data and the normalized empty target data. The subtracted spectrum shows the net contribution of the reaction at the LH2 target. The number of reaction events are and , respectively, for the 1st and 2nd runs.
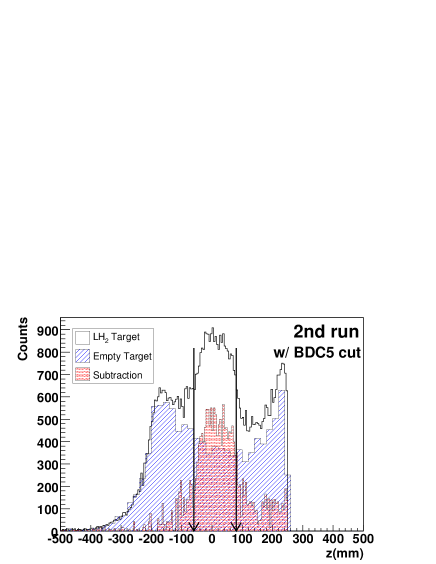
Using the analysis of SDC1, 95% of decay events at the target region were removed. As shown in Fig. 7, there are still decay events. One can test whether the amount of decay events is consistent or not by comparing with a Monte Carlo simulation. Based on the Monte Carlo simulation where efficiencies of the chambers were taken into account, the suppression factor for the decay events was estimated to be 98%. The reason of this inefficiency was that one of the pions from three-body decay disappeared by the interaction with the LH2 target or materials around the target. The from decay also created mistaken tracks and decreased the efficiency. From this study, we found that there is 3% difference between the real data and the simulation. To explain this difference, we considered whether the ’s, which were produced at BH2 or BAC via hadronic reactions such as , could contribute to the vertex distribution, because the ’s which decayed into at the target region made a miscalculated vertex at the cross point between the and the beam. In the 2nd run, in order to remove these events, a new drift chamber (BDC5) with two planes (X, X’) was installed between the target and BAC. We applied the following cuts. At first, the hit position of BDC5 was required to be consistent with the extrapolated position from the track defined with BDC34. We also required the multiplicity of BDC5 to be one. The bottom figure in Fig. 7 shows the vertex distribution applied the BDC5 cut in the 2nd run, which shows a slight improvement of the ratio. However there is still about 2% inconsistency between the analysis and the simulation. This could be due to the imperfection of the Monte Carlo simulation, since we could not reproduce the complex LH2 target system where some materials were not installed. Another possible reason is incompleteness of the analysis of SDC1. We took this 2% inconsistency into account as the systematic error of the efficiency of the SDC1 analysis described in the following paragraph.
| cut | efficiency(%) (1st run / 2nd run) | |
|---|---|---|
| beam on-target factor | 84.53.5 / 96.21.6 | |
| beam decay factor | 96.70.1 / 95.70.1 | |
| tracking efficiency of beam particle | 95.30.3 / 95.60.3 | |
| LC efficiency | 95.50.2 | |
| TOF efficiency | 100. | |
| decay factor | 85.20.2 | |
| interaction factor | 942 | |
| SdcIn tracking efficiency | 87 1 | |
| SdcOut tracking efficiency | 92.90.3 | |
| Sks tracking efficiency | 950.7 | |
| Sdc1 analysis efficiency | 69.43.7 | |
| vertex cut efficiency | 85.2 / 85.0 | |
| BDC5 cut efficiency | —— / 91.60.2 | |
| acceptance at lab. frame | 0.11sr. |
The efficiency of the SDC1 analysis for the events was also checked by this Monte Carlo simulation. Because charged particles other than in SKS were required to be detected by SDC1, the acceptance of the chamber must be considered for these particles and the tracking efficiency of the SDC1 analysis. In this simulation, we assumed the following three kinds of angular distributions of in the center of mass system;
-
1.
flat distribution,
-
2.
forward peak distribution ((1)/2),
-
3.
backward peak distribution ((1)/2),
where is the angle of in the center of mass (c.m.) system. For the decay distribution of , a flat distribution was assumed. The branching ratios of and were assumed to be 50%, 25% and 25%, respectively. Between these distributions, the difference was small and the efficiency was estimated to be 69.43.7%. The error consisted of two parts. The first one is the deviation between the different angular distributions. The other one is the 2% uncertainty of tracking analysis using SDC1 as described in the previous paragraph.
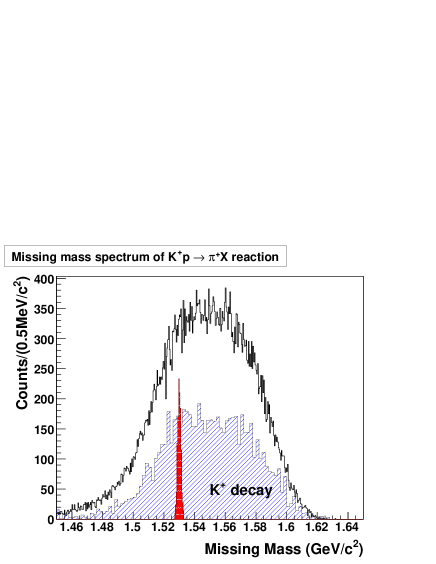
Fig. 8 shows the missing mass spectrum of the reaction after selecting the LH2 target regions using the vertex distribution. In this figure, the data of the 1st and 2nd runs are added. The hatched histogram shows the empty target data, which are normalized using the beam flux. This spectrum shows the contribution from the decays in the region between the arrows in Fig. 7. The dotted spectrum shows the expected spectrum assuming that the width of the is 0 MeV/, the total cross section of the reaction is 50 b and the angular distribution of the is isotropic in the c.m. system. In the present experiment, no significant peak was observed. We also obtained the differential cross section averaged over 2o to 22o in the laboratory frame. The differential cross section is defined by the following equation,
| (1) | |||||
where the ’s and ’s represent the correction factors and efficiencies whose typical values are summarized in Table 2.
The represents the ratio of the number of ’s which hit the LH2 target to that of ’s identified from the time-of-flight between BH1 and BH2. Because the horizontal size of the beam at the target region was comparable with the target size, part of the beam particles did not pass through the target. The ’s are estimated to be 84.5 3.5% and 96.2 1.6% for the 1st and 2nd runs, respectively, using data taken with a KBEAM trigger where there was no bias of scattered particles. Because the beam center was slightly shifted from the target center in the 1st run, the in the 1st run was smaller than that in the 2nd run. The coefficient, , represents the correction factor due to the decay in flight of the beam particles between BH2 and the LH2 target. The ’s were estimated to be 96.7 0.1% and 95.7 0.1% for the 1st and 2nd runs, respectively. In the 2nd run, BH2 was moved to upstream in order to install BDC5. Therefore the of the 2nd run was smaller than that of the 1st run.
The represents the tracking efficiency for the incident particles, estimated by the ratio of the number of events accepted as a good trajectory to that of good beam particles defined using the time-of-flight between BH1 and BH2 and the energy deposit at BH2. The ’s were obtained to be 95.30.3 and 95.60.3 for the 1st and 2nd runs, respectively.
The and represent the efficiencies of LC and TOF counters, respectively. The LC and TOF were segmented horizontally into 14 and 15 segments, respectively. These efficiencies are estimated for each segment using data taken in the trigger condition without LC and TOF. The typical value of was 95.50.2%. In order to obtain the cross section, the efficiency of the segment through which the outgoing passed was used. The typical value of the was almost 100%.
The coefficient, , represents the correction factor due to the decay-in-flight of the . In the offline analysis, we required the hits of the LC and TOF corresponding to the trajectory obtained by the tracking routine using SDC34. From Monte Carlo simulations, we found that events where ’s decayed after SDC4 could be analyzed as good events, because the angle of the from the decay was less than 4∘. Therefore the was calculated event by event using the flight length from the vertex point to the exit of SDC4. The typical value of was 85.20.2%. The coefficient, , represents the correction factor due to the interaction rate of in the materials of the target and the SKS spectrometer. The factor was calculated with the Monte Carlo simulation based on GEANT4. The value of was found to be 942%.
The coefficients, and , represent the efficiencies of the local tracking upstream and downstream of the SKS magnet. The was estimated from Monte Carlo simulations to be 871%. Typically there were multiple hits in SDC1 because it was designed to detect many charged particles at once. Therefore hits of SDC1 and SDC2 which did not originate from a single particle were connected in the tracking routine and finally rejected by the further analysis. The was estimated using the data of five beam-through runs where the beams of fixed momentum from 0.475 to 0.525 GeV/ were directly analyzed with the SKS spectrometer. The efficiency was constant for all horizontal positions of the outgoing particle. The was obtained to be 92.90.3%. The coefficient, , represents the efficiency of the Runge-Kutta tracking which calculates the trajectory of the outgoing particle by connecting local tracks. The was estimated by using scattered protons selected only using TOF and LC. The efficiency depended on the slope in the vertical plane (dy/dz) of the outgoing particle at the target. For small slope (dy/dz 0), the was 950.7%. For large slope (dy/dz ), the was 891%. The efficiency was corrected according to the slope of each trajectory.
The coefficient, , represents the efficiency of the SDC1 analysis described in the previous paragraph. The was obtained to be 69.43.7%.
The coefficient, , represents the efficiency of the vertex cut. In order to estimate this value, we used the vertex distribution of the () events, because the target image could be identified more precisely. The values are 85.2% and 85.0% for the 1st and 2nd runs, respectively. The coefficient represents the efficiency of the BDC5 analysis applied only in the 2nd run. This value was also estimated by using the () data from the ratio of the number of events within the target region in the vertex distribution with and without the BDC5 cut. The value of is 91.60.2%.
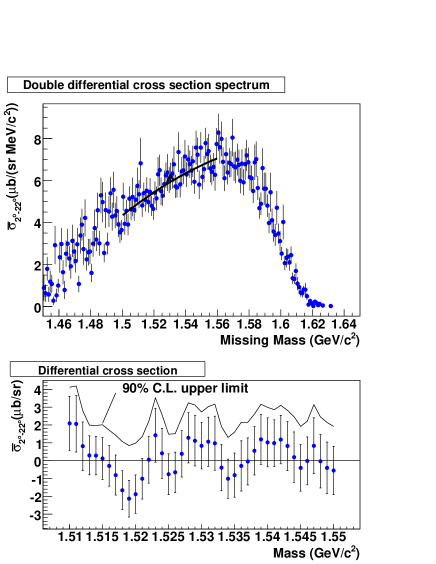
Bottom figure: The upper limits of the differential cross section of the reaction averaged over 2o to 22o in the laboratory frame as a function of the mass of the . The data points show the value and the error of the differential cross section obtained from the area of the fitted Gaussian function. The line shows the 90% C.L. upper limit of the differential cross section.
Because some of efficiencies depended on the trajectory of the particle, these efficiencies were calculated event by event. The differential cross section averaged over 2o to 22o in the laboratory frame was calculated using the following equation,
| (2) |
Fig. 9 shows the differential cross section versus missing mass which also shows no peak structure. This spectrum includes the contribution of decay events which exist between the arrows in Fig. 7. The error includes both of the statistical and systematic errors. We derived a 90 % C.L. upper limit of the differential cross section of the reaction. As shown in the top figure of Fig. 9, we fitted this spectrum with a background using a 2nd order polynomial function and a Gaussian peak with a width of 2.4 MeV/ (FWHM) which is the expected resolution for the . The differential cross section was calculated from the area of the Gaussian function. The bottom figure of Fig. 9 shows the values and the errors of the differential cross section as a function of the peak position. The solid line in the bottom figure of Fig. 9 shows the 90 % C.L. upper limit of the differential cross section considering that this distribution is based on Gaussian statistics. This 90 % C.L. upper limit is less than 3.5 b/sr for almost all mass region.
IV Discussion
The experimental results are now compared with theoretical calculations. A production mechanism based on both the present results of the reaction and the results of the reaction will be discussed.


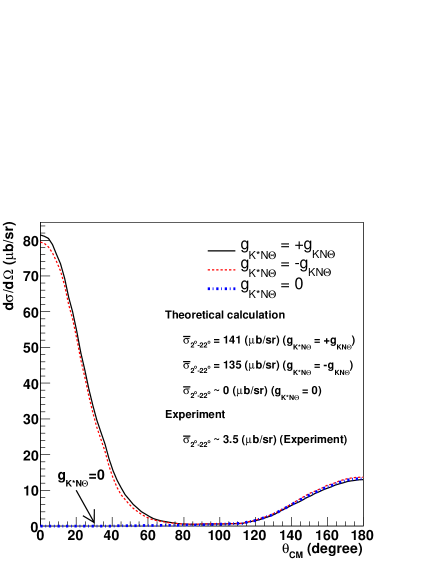
In the reaction, it is possible to consider a -channel process where is exchanged and a -channel process where is an intermediate state as shown in Fig. 11. Fig. 12 shows the differential cross section calculated by Y. Oh et al. using an effective interaction Lagrangian Oh2 . Their calculation is controlled by two coupling constants, and . The coupling constant is related to the decay width of the . They assumed that was 1.0 which corresponds to a decay width of 1.03 MeV/. On the other hand, there is no experimental information about . Therefore they calculated in three cases where , and . If there is the -channel process (), the differential cross section would have a forward peak distribution as shown by the solid and dashed lines in Fig. 12. The calculated differential cross section averaged over 2∘ to 22∘ in the laboratory frame () is about 140 /sr in this case. The experimental upper limit of 3.5 b/sr is much smaller than this theoretical value. Therefore the -channel process is excluded by the present results. On the other hand, if the -channel process does not exist and only the -channel process exits, the differential cross section shows a backward peak distribution as shown by the dot-dashed line in Fig. 12. In this case, the is almost 0 /sr. Our experiment is not sensitive enough to exclude the -channel process.
The E522 collaboration reported an upper limit of the cross section of the reaction of 3.9 b at the 90% confidence level assuming that the is produced isotropically in the center of mass system. In the reaction, the -channel and -channel processes are considered as shown in Fig. 11. The cross section is controlled by the same coupling constants, and , which are used for the reaction. In order to explain the small cross section, the following two things are possible: 1) The coupling constant is small; 2) Although the coupling constants and are sizable, the total cross section becomes small due to a destructive interference between two amplitudes of and . From the result of the reaction, is considered to be quite small. Therefore it is unlikely that the cross section is small due to the interference. If is small, then the width of is quite narrow.

Hyodo and Hosaka studied the production mechanism taking into account the importance of two-meson couplings Hyodo2 . They calculated the production cross section of the and reactions for both and using the Feynman diagrams shown in Fig. 13. They obtained the scalar and vector coupling constants of , and , using flavor SU(3) symmetry and the decay width of the . Without a two-meson coupling, all of the amplitudes for the production are proportional to the coupling, which is fixed by the supposed small decay width of the . However, even with an extremely narrow width of the , a sizable cross section can be obtained using the two-meson coupling determined from the decay width of . These coupling constants have uncertainty due to the experimental uncertainties in the branching ratio. They restricted the coupling constants to be consistent with the upper limit of the cross section of the reaction. Moreover the relative phase between scalar and vector coupling constants could not be determined solely from the decay width of the . This relative phase is quite important because it determines the interference term of these two amplitudes. If and have the same phase, the two amplitudes interfere constructively for the channel, while in the case it gives destructive interference. On the other hand, if and have the opposite phase, the situations for constructive and destructive interference reverse. Considering the small cross section obtained in the reaction, these data suggest the latter case. Then, the cross section of the reaction could be large. They calculated total cross sections of 2.5 mb and 110 b in the cases of and , respectively. The ’s are 600 b/sr and 50 b/sr in each case. The experimental upper limit of 3.5 b/sr is much smaller than these calculations. If they take the same phase for and in order to explain the cross section of the reaction, the cross section of the becomes large due to the constructive interference, which is inconsistent with the experimental result. Therefore this model can not explain both of the experimental results simultaneously.
In summary, we have searched for the via the reaction using a 1.2 GeV/ beam at the K6 beam line of the KEK-PS 12 GeV Proton Synchrotron. In the missing mass spectrum of the reaction, no clear peak structure was observed. A 90 % C.L. upper limit of the differential cross section, averaged over 2∘ to 22∘ in the laboratory frame of the reaction, is obtained at 3.5 b/sr. From the present experiment and the experiment by the E522 collaboration, it is found that both of the production cross sections from the and reactions are small. From the small differential cross section at the forward angles of the reaction, the -channel process, where a is exchanged, is excluded. Therefore the small cross section of the reaction cannot be explained by the destructive interference between two amplitudes due to the couplings and . In order to explain the small cross section, the coupling constant must be small. The model by Hyodo and Hosaka which explains the result of the reaction also cannot explain the present result.
V Acknowledgments
We would like to express our thanks to staffs of KEK PS and beam channel group for their support to provide beam with the excellent condition during the experiment. We would like to thanks to RIKEN Radiation Laboratory for the usage of RIKEN-CCJ computer system. Some of the authors (K. M.) and (S. D.) thank to the Japan Society for the Promotion of Science (JSPS) for support. One author (K.H.) thanks the National Science Foundation for support. This work was supported by the Grant-in-Aid for the 21st Century COE ”Center for Diversity and Universality in Physics” from the Ministry of Ministry of Education, Culture, Science and Technology (MEXT) of Japan. This work was supported by the Grant-in-Aid for Specially Promoted Research (No.15001001) from the Ministry of Education, Culture, Science and Technology, Japan.
References
- (1) T. Nakano et al., Phys. Rev. Lett. 91, 012002 (2003).
- (2) K.H. Hicks, Prog. Nucl. Part. Phys. 55, 647 (2005).
- (3) K. Goeke, H.-C. Kim, M. Praszalowicz and G.-S. Yang, Prog. Nucl. Part. Phys. 55, 350 (2005).
- (4) DIANA Collaboration, V.V. Barmin et al., Phys. Atom. Nucl. 66, 1715 (2003).
- (5) CLAS Collaboration, S. Stepanyan et al., Phys. Rev. Lett. 91, 252001 (2003).
- (6) SAPHIR Collaboration, J. Barth et al., Phys. Lett. B 572, 127 (2003).
- (7) CLAS Collaboration, V. Kubarovsky et al., Phys. Rev. Lett. 92, 032001 (2004).
- (8) A. E. Asratayn, A.G. Dolgolenko and M.A. Kubantsev, Phys. Atom. Nucl. 67, 682 (2004).
- (9) HERMES Collaboration, A. Airapetian et al., Phys. Lett. B 585, 213 (2004).
- (10) ZEUS Collaboration, S. Chekanov et al., Phys. Lett. B 591, 7 (2004).
- (11) COSY-TOF Collaboration, M. Abdel-Bary et al., Phys. Lett. B 595, 127 (2004).
- (12) SVD Collaboration, A. Aleev et al., arXiv:hep-ex/0401024.
- (13) P.Zh. Aslanyan et al., arXiv:hep-ex/0403044.
- (14) Hyper-CP Collaboration, M.J. Longo et al., Phys. Rev. D70, 111101(R) (2004).
- (15) HERA-B Collaboration, I. Abt et al., Phys. Rev. Lett. 93, 212003 (2004).
- (16) ALEPH Collaboration, S. Schael et al., Phys. Lett. B 599, 1 (2004).
- (17) BES Collaboration, J.Z. Bai et al., Phys. Rev. D 70, 012004 (2004).
- (18) BABAR Collaboration, B. Aubert et al., hep-ex/0502004.
- (19) CDF Collaboration, D.O. Litvintsev et al., Nucl. Phys. B (Proc. Suppl.) 142, 374 (2005).
- (20) SPHINX Collaboration, Yu.M. Antipov et al., Eur. Phys. J. A21, 455 (2004).
- (21) PHENIX Collaboration, C. Pinkenburg et al., J. Phys. G : Nucl. Part. Phys. 30:S1201 (2004).
- (22) CLAS Collaboration, M. Battaglieri et al., Phys. Rev. Lett. 96 042001 (2006) .
- (23) CLAS Collaboration, B. McKinnon et al., Phys. Rev. Lett. 96 212001 (2006) .
- (24) COSY-TOF Collaboration, M. Abdel-Bary et al., Phys. Lett. B 649, 252 (2007).
- (25) T. Nakano et al., J. Phys. G: Nucl. Part. Phys. 32 S77 (2006).
- (26) DIANA Collaboration, V.V. Barmin et al., hep-ex/0603017 .
- (27) R.A. Arndt, I.I. Strakovsky, and R.L. Workman, Phys. Rev. C 68, 042201(R) (2003).
- (28) R.N. Cahn and G.H. Trilling, Phys. Rev. D 69, 011501(R) (2004).
- (29) D. Diakonov, V. Petrov, M. Polyakov, Z. Phys. A 359, 305 (1997).
- (30) R. Jaffe, F. Wilczek, Phys. Rev. Lett. 91, 232003 (2003).
- (31) M. Karliner, H.J. Lipkin, Phys. Lett. B 575, 249 (2003).
- (32) T. Kishimoto and T. Sato, hep-ex/0312003.
- (33) Y. Kanada-En’yo, O. Morisatsu and T. Nishikawa, hep-ph/0410221.
- (34) E. Hiyama, H. Suganuma and M. Kaminura, arXiv:0707.4044.
- (35) Y. Oh, H. Kim, and S.H. Lee , Phys. Rev. D 69, 074016 (2004).
- (36) KEK-PS E522 Collaboration, K. Miwa et al., Phys. Lett. B 635, 72 (2006).
- (37) T. Fukuda et al., Nucl. Instr. Meth. A 361, 485 (1995).
- (38) H. Hotchi et al., Phys. Rev. C 64, 044302 (2001).
- (39) O. Hashimoto, H. Tamura, Prog. Nucl. Part. Phys. 57, 564 (2006).
- (40) R.W. Bland et al., Nucl. Phys. B 13, 595 (1969).
- (41) J. Myrheim and L. Bugge, Nucl. Instrum. Methods. 160 (1979) 43.
- (42) W. Liu and C.M. Ko , Phys. Rev. C 68, 045203 (2003).
- (43) Y. Oh, H. Kim, and S.H. Lee , Phys. Rev. D 69, 014009 (2004).
- (44) T. Hyodo, A. Hosaka, and E. Oset, Phys. Lett. B 579, 290 (2004).
- (45) T. Hyodo, and A. Hosaka, Phys. Rev. C72, 055202 (2005).