Measurement of the absolute branching ratios for semileptonic decays with the KLOE detector
Abstract:
Using a sample of over 600 million decays collected at the DAΦNE collider, we have measured with the KLOE detector the absolute branching ratios for the charged kaon semileptonic decays, () and (). The results, and , are inclusive of radiation. Accounting for correlations, we derive the ratio . Using the semileptonic form factors measured in the same experiment, we obtain = .
1 Introduction
At present, the determinations of and provide the most precise verification of the unitarity of the CKM matrix. The relation can be tested with an absolute accuracy of few parts per mil using as measured in nuclear beta decays and as derived from semileptonic kaon decays. Since it was already known in 1983 that [1] and today is [2], will be ignored in the following. All experimental inputs to — branching ratios (BRs), lifetimes, and form factors — can be measured with the KLOE detector. Using tagging techniques, we have already measured the complete set of inputs for decays [3, 4, 5, 6], BR() for the [7], and the absolute BRs for [8] and [9] decays. Here, we report on the measurement of the absolute BRs for the decays () () and () (). Our measurements, which make use of a tagging technique, are fully inclusive of final-state radiation.
2 Experimental setup
The data were collected with KLOE detector at DAΦNE, the Frascati factory. DAΦNE is an collider which operates at a center of mass energy of 1020 MeV, the mass of the meson. Positron and electron beams of equal energy collide at an angle of (), producing mesons with a small momentum in the horizontal plane, MeV. mesons decay 49% of the time into nearly collinear pairs; the detection of a meson (the tagging kaon) therefore signals the presence of a (the tagged kaon) independently of its decay mode. This technique is called tagging in the following. The results presented here are based on an integrated luminosity of about 410 delivered by DAΦNE in 2001-02, corresponding to pairs produced.
The KLOE detector consists of a large cylindrical drift chamber surrounded by a lead scintillating-fiber electromagnetic calorimeter. A superconducting coil around the calorimeter provides a 0.52 T field. The drift chamber (DC) [10] is 4 m in diameter and 3.3 m long. The momentum resolution for tracks at large polar angles is . The vertex between two intersecting tracks is reconstructed with a spatial resolution of 3 mm. The calorimeter (EMC) [11] is divided into a barrel and two endcaps. It is segmented in depth into five layers and covers 98% of the solid angle. Energy deposits nearby in time and space are grouped into calorimeter clusters. The energy and time resolutions are and , respectively. The trigger [12] uses only calorimeter information. Two energy deposits above threshold ( MeV for the barrel and MeV for endcaps) are required. Recognition and rejection of cosmic-ray events is also performed at the trigger level. Events with two energy deposits above a 30 MeV threshold in the outermost calorimeter plane are rejected.
To reject residual cosmic rays and machine background events, we use an offline software filter (FilFo) that exploits calorimeter information before tracks are reconstructed. As an example, the filter tests the hypothesis that time difference between pair of clusters be compatible with the time of flight of a muon crossing the detector. The response of the detector to the decays of interest and the various background sources were studied by using the KLOE Monte Carlo (MC) simulation program [13]. Changes in machine parameters and background conditions are simulated on a run-by-run basis in order to properly track the frequent changes in machine operation. The MC sample of decays used for the present analysis corresponds to an integrated luminosity of about 480 ; the sample for the other meson final states is equivalent in statistics to 90 of integrated luminosity.
3 Method of measurement
The use of a tagging technique allows the measurement of absolute branching ratios. Reconstruction of one of the two-body decays () and () in an event signals the presence of a ; this provides a clean, counted sample of decays from which to select signal events ( or decays). Let be the number of events identified as or in a given tagged sample, and the total number of tagged events in the sample. The branching ratio of each signal decay, or , can be determined as:
| (1) |
where is the identification efficiency for semileptonic decays, given the tag. This efficiency includes the detector acceptance (), and the reconstruction and selection efficiencies for events ().
is corrected for losses of from nuclear interactions in the material traversed by kaons before entering the DC. This material includes the beam pipe (50 m of Be and 500 m of AlBe-met, an alloy of 40% of Be and 60% of Al) and the inner DC wall (750 m of C and 200 m of Al). The probability of interaction in the KLOE setup is negligible () for , while it is 3.4% for , as estimated by MC. Therefore, this correction is necessary only for samples tagged by decays.
The quantity , which we refer to as the tag bias in the following, accounts for the slight dependence of the reconstruction and identification efficiency for the tagging (or ) decay on the decay mode of the tagged kaon. Both and , are evaluated from MC, with corrections evaluated from data and MC control samples.
4 Tag selection
In the center of mass, the two kaons are produced back-to-back with momentum MeV. Since the has a transverse momentum of 13 MeV, in the laboratory frame ranges between 120 MeV and 133 MeV. The decay length is 95 cm. Before entering the DC, kaons have to pass through the beam pipe and through the DC inner wall, and lose about 5 MeV of energy. As a result, for kaons in the DC is about 100 MeV, and the decay length is reduced to about 75 cm.
Two-body decays are observed as vertices in the drift chamber between an incoming track (the kaon) and an outgoing track of the same charge. Kaons are identified as tracks with momentum 70130 MeV whose point of closest approach to the collision point (IP) lies inside a cylinder 10 cm in radius and 20 cm in length along the -axis.111 and are the coordinates on the plane perpendicular to the beam axis; is the coordinate along the beam axis. The kaon decay vertex must be reconstructed within a fiducial volume (FV) defined as a cylinder of radius 40150 cm and length 130 cm, centered on the IP and coaxial with the beams. A kaon has a probability of decaying in the FV as determined by MC. The combined reconstruction efficiency for the kaon and secondary tracks connected with a vertex (which we refer to as the decay chain in the following) is about 0.6 as estimated by MC.
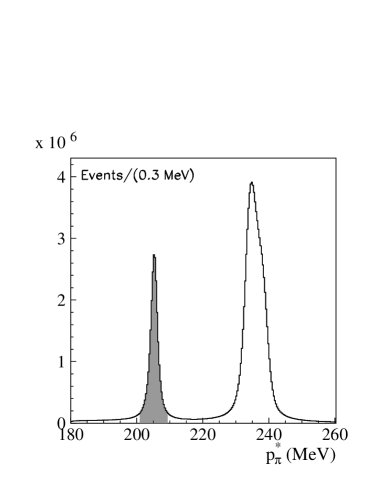
The momentum of the secondary track is computed in the kaon rest frame using the muon and pion mass hypotheses, and , respectively. The resulting momentum distributions are shown in Fig. 1. events are identified as having 231241 MeV (the shaded area of Fig. 1, left), while event candidates are identified as having 201209 MeV (as in Fig. 1, right). The tails in the distributions are due to resolution effects, and some residual semileptonic contamination on the left of the peak.

The secondary track is extrapolated to the calorimeter surface and associated to a calorimeter cluster, if possible. The association is based on the distance between the impact point of the track on the calorimeter and the nearest cluster; a cut is made on the component of this distance in the plane orthogonal to the direction of incidence of the track. The efficiency and the acceptance for the extrapolation, together with the efficiency for the association, is about 0.7 as estimated by MC.
To reduce the tag bias, we require the tagging decay to satisfy the calorimeter trigger by itself. decays can independently generate a trigger when the muon incident on the calorimeter traverses two nearby trigger sectors. This happens in about 30% of events with identified decays. For the remaining events identified as containing a decay (referred to as the sample in the following) the tag bias correction is large (). We use these events only as a control sample. For events, the calorimeter trigger can be satisfied by the two photon clusters from the . To identify events, we require the to be reconstructed as follows. For each cluster with E50 MeV not associated to any track, the kaon decay time is calculated using the cluster time and the distance between the decay vertex and the cluster position: . This time should have the same value for two photons from the same decay, so we require the presence of two clusters for which (see Sect. 2). Using the energies and the positions of the two clusters, the invariant mass is calculated and a 3 cut (18 MeV) about the nominal value of the mass is used to identify the from a decay. The calorimeter trigger is satisfied if the two identified photons fire two different trigger sectors. The combined probability for a decay to be identified and to independently satisfy the trigger is about 0.25 as determined by MC.
The overall efficiency for the identification of the tagging kaon ranges between 4.4% and 5.7% depending on the sample. In the data set analyzed, about 60 million tagging decays were identified and divided into the four independent tag samples listed in Table 1.
| Tag sample | ||||
|---|---|---|---|---|
| Ntag |
MC studies show that the contamination due to decays other than is negligible.
5 Tag bias
Ideally, the efficiency for the identification of a tagging kaon would not depend on the decay mode of the tagged kaon. In reality, however, the geometrical overlap of the “tag” and “signal” parts of the event and the fact that the trigger, offline background filter (FilFo), and tracking procedures look at the event globally, make the separation into two distinct topologies arbitrary. The tagging efficiency is not completely independent of the decay mode, and the tag bias must be precisely determined. The factor in Eq. 1 is defined as
| (2) |
where () is the tagging efficiency given that the tagged kaon evolves to a final state . In the sum, indexes all possible outcomes occurring with probability for the signal kaon, including not only all decay modes, but also possibly nuclear interactions with the beam pipe or inner DC wall. If the efficiency () were the same for all , would be equal to unity. As noted in Sect. 4, one of the main sources of tag bias is the dependence of the trigger efficiency on the decay mode of the tagged kaon; the requirement that the tagging kaon independently satisfy the trigger makes =1, decreasing the tag bias. refers to the tag bias from other sources, and can be estimated only by using the MC. The values of for each combination of tag and signal decay mode are listed in Table 2.
| 0.9694(1)(5) | 1.0137(3)(5) | 0.9884(1)(5) | 1.0328(2)(3) | |
| 0.9756(1)(5) | 1.0210(4)(5) | 0.9963(1)(5) | 1.0371(2)(3) |
The values of range from about 0.97 to 1.04, depending on the tag sample used, and include a small correction due to differences in the performance of the cosmic-ray veto and offline background filter in data and in MC. The determination of the systematic errors is discussed in Sect. 7.
6 Search for semileptonic decays
For the selection of signal events, we require the reconstruction of the vertex between the kaon and secondary tracks in the DC, and of two clusters from a originating at this vertex. The criteria are the same as those used for identification of the tagging decay. The average efficiency for complete reconstruction of the decay chain is 60% as evaluated by MC. This estimate is corrected for differences between data and MC in the tracking efficiency using data and MC samples of events as described in Sect. 7. The average correction factor applied to the MC efficiency is 0.87.
The secondary track is extrapolated to the calorimeter and geometrically associated to a cluster. The efficiency for the association is more than 99% for events and about 91% for events. Both have been estimated using MC. The correction due to data-MC discrepancies is 0.4% for (measured using a sample of events, as described in [5]), and 2% for . The latter value is obtained by combining the corrections measured using samples of (see [6]) and events.
The fiducial volume efficiency, , is about 56%, as in the tag selection, and, for ’s, is corrected for nuclear interactions. This correction has been checked using data, because of lack of knowledge of -nuclear interaction cross sections for 1 GeV. Since the geometrical efficiency for the detection of decays depends on the lifetime so do the values of the BRs: , where ns, the current world average value [2].
To reject the abundant two body decays, we require MeV for signal events. Only poorly reconstructed and decays and events with an early decay survive this cut. The procedure used to identify the associated to the decay vertex is similar to that used in the selection of decays, the only difference being that for signal events we require MeV for each cluster. The efficiency for identification (including EMC acceptance and cluster efficiency) is about 0.57 as estimated by MC. The single-photon detection efficiencies for data and MC are evaluated as a function of photon energy using events; their ratio is used to correct the MC efficiency. The average correction factor is 0.98.
After selection, the sample is composed mainly of semileptonic decays, with residual contamination from and () decays. To reject events in which the decays to before entering the DC, we evaluate the lepton momentum using the mass hypothesis () in the center of mass of the . The momentum is defined as the missing momentum at the decay vertex, . By requiring MeV, we reject about 95% of decays while retaining about 83% of and 78% of events, as estimated by MC. The contamination from events is reduced by requiring , calculated using the mass hypothesis, to be less than 90 MeV. After the above cuts, the contamination from non- events is about 2.1% in each tag sample, and consists of 1.4% decays and 0.7% decays; for , a contamination of 0.3% from nuclear interactions is also present.
| 0.0957(11)(6) | 0.0815(13)(4) | |
| 0.0989(16)(6) | 0.0848(19)(4) | |
| 0.0983(12)(6) | 0.0841(9)(4) | |
| 0.1008(18)(6) | 0.0867(20)(4) |
The overall efficiencies for reconstruction and identification of events ( in Eq. 1), including data-MC corrections, are listed by decay and tag type in Table 3. The statistical errors account for both the MC statistics and the statistics of the control samples used to estimate the data-MC efficiency corrections. The uncertainties from control sample statistics represent the largest contributions (about 1%) to the total errors on the BR measurements. In particular, for the dominant uncertainty is from the tracking correction, while for , the uncertainties from the tracking and muon cluster corrections are at the same level. Further details are given in Sect. 7.
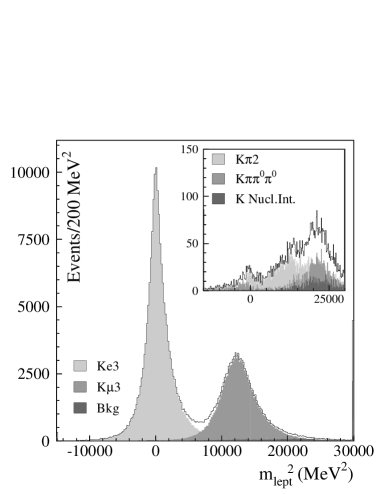
To isolate and decays, the lepton is identified using a time-of-flight technique. Specifically, if the secondary track is given the correct mass assignment, the kaon decay time estimated using the cluster associated to this track () must be equal to the decay time estimated from the photon clusters from the (). We calculate as , where is the arrival time of the cluster associated to the secondary track and and are the velocity and length for this track, respectively. The lepton mass is then obtained by imposing :
where is the momentum in the laboratory frame. The distribution is shown in Fig. 2 left for signal and background MC events. The and signals are evident. There is a residual background of 2%; this is not visible in the distribution and is shown in the inset. and decays contribute to the broad background distribution. For ’s, nuclear interactions also contribute. The small peak at equal zero is due to the incorret association of the track with a background cluster.
| NKe3 | 101 733 (411) | 34 109 (243) | 108 125 (430) | 33 887 (243) |
|---|---|---|---|---|
| NKμ3 | 55 919 (339) | 18 999 (200) | 59 730 (358) | 18 923 (205) |
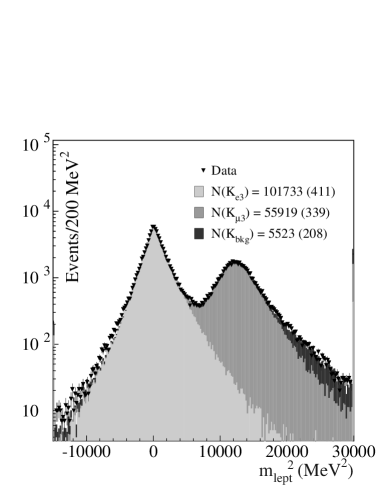
The numbers of signal events are obtained from a fit to the data spectrum with a linear combination of the MC distributions for decays, decays, and background. The fit parameters are the numbers of signal and background events. The result of the fit for the -tagged sample is shown in figure 2, right. The results for each of the four tag samples are summarized in Table 4. For all samples, the fit gives a 1% correlation between the numbers of and events.
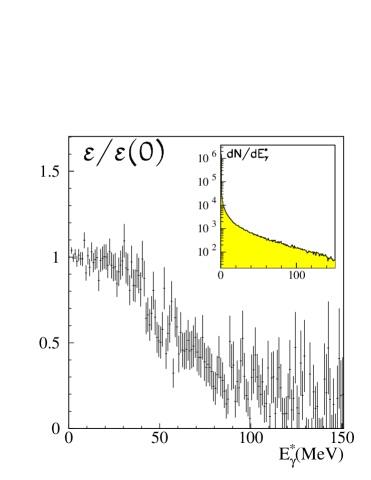
Since kinematic closure of the event (=0) is not required for the identification of signal decays, events with radiation are included (). However, the acceptance for such events depends on the photon energy. The MC simulation includes final-state radiation [14], and allows the photon-inclusive reconstruction efficiency to be determined for and events. The inclusion of radiation effects in the final state modifies the shape of the distributions used as inputs to the fit used to count signal events, improving the fit quality. The MC efficiency for events as a function of the photon energy in the rest frame, , is shown in Fig. 3. The fraction of events with greater than a reference energy is important only for decays. For MeV, for example, this fraction is 2.8% for decays and 0.1% for decays.
7 Systematic uncertainties
The systematic uncertainties in the BR measurements are listed in Table 5. All sources of systematic error have been evaluated for each tag sample and for each decay.
| Branching ratio | ||
|---|---|---|
| Source | Fractional statistical error (10-2) | |
| Event counting | 0.3 | 0.3 |
| Tag bias | 0.1 | 0.1 |
| 0.7 | 0.8 | |
| 0.2 | 0.4 | |
| Total statistical | 0.8 | 0.9 |
| Source | Fractional systematic error (10-2) | |
| Event counting | 0.2 | 0.1 |
| Tag bias | 0.3 | 0.3 |
| 0.6 | 0.5 | |
| Stability | 0.2 | 0.5 |
| 0.2 | 0.2 | |
| Total systematic | 0.7 | 0.8 |
| Total | 1.1 | 1.2 |
To evaluate the corrections to the decay-chain, photon-cluster, and lepton-cluster efficiencies (, , and , respectively), one or more control samples have been selected, and the efficiencies have been measured using these samples. Each efficiency is evaluated in bins of a suitable set of physical variables, and the ratio of data and MC efficiencies is inserted into the MC. The corrected signal efficiency is obtained by averaging over MC event distributions.
The decay-chain reconstruction efficiency correction has been measured using a control sample of events identified in the tag sample. The correction has been parameterized as a function of the kaon polar angle (), the decay vertex position (), and the lepton momentum (). The average data/MC correction is 0.87 and is mainly due to data-MC differences in the reconstruction efficiency for the kaon track. The large energy loss of the in the DC gas222The DC gas is 90% helium and 10% isobutane. is underestimated in the MC, which results in a higher efficiency for kaon track reconstruction. To check the reliability of the correction applied, the events in each tag sample have been divided into equally populated and statistically independent subsamples with less than and greater than 80 cm, and with less than and greater than . We find that the correction is larger () for the samples with 80 cm or than it is for the complementary samples with 80 cm or (). The branching ratios measured using the full sample and in the two subsamples for each decay and tag type coincide within the errors. The systematic error has been taken to be half of the difference between the BRs measured for the two subsamples in . The fractional uncertainty in the BR measurements from is about 0.54% for and about 0.44% for , respectively.
The correction for the single lepton-cluster association efficiency is for electrons and for muons. Both lepton-cluster and decay-chain corrections strongly depend on . We have checked the stability of the BR measurements when is additionally required to be greater than 50, 70, and 90 MeV. We obtain a systematic error of about 0.2% for BR(), and a negligible error for BR().
The correction takes into account differences between data and MC in the cluster reconstruction efficiency for low-energy photons. The single-photon detection efficiencies are evaluated from control samples of events, which are selected using DC information only. A photon from decay is identified by requiring that its energy and time of flight be consistent with kinematics. This provides a good estimate of the momentum of the second photon. The efficiency is obtained as the probability for the second photon to be found in a cone with opening angle about the expected direction. Each photon in the MC is weighted with the data/MC ratio of single-photon detection efficiencies evaluated as a function of photon energy. We have studied the effects on the correction when the value of the opening-angle cut is varied between and and when the cut on the miminum energy for photon clusters is varied between 10 and 40 MeV. We obtain a contribution to the uncertainties on the BRs of about 0.2% from photon-cluster systematics.
In order to evaluate the systematic error associated with the fit procedure, we have performed various studies using the control sample (see Sect. 4). First, we use MC distributions in for and taken from the sample without applying the background-rejection cuts, which can in principle modify the shape of the distributions. We perform an additional check using and fit shapes obtained directly from data. Electron and muon cluster can be distinguished by exploiting the EMC granularity. Cuts on the profile in depth of the energy deposited in the lepton cluster allow the selection of (energy mainly deposited in the first EMC plane) or (muons behave like minimum ionizing particles in the first plane while they deposit a sizeable fraction of their kinetic energy from the third plane onward) events. This allows to obtain and fit shapes directly from data. We have tested the stability of the results when using these shapes. Finally, we have checked that the results are stable against changes in the histogram binning and fit range. From these studies, we estimate the fractional systematic uncertainty associated with the fit procedure to range from 0.1% to 0.4%, depending on the decay mode and tag type.
has been computed using the MC. For decays, is corrected for losses due to nuclear interactions. In this case, a contribution to the systematic error is evaluated from the difference between the corrections measured for MC and data. Actually, a suitable selection of events provides a sample containing interacting on the beam pipe and on the inner DC wall, and therefore allows comparison of the effects of nuclear interaction in data and MC. We obtain a fractional contribution of 0.37% for tagged events and 0.69% for tagged events.
The tag bias includes the effect of the FilFo and cosmic-ray veto (CV) filters. The FilFo correction has been measured for each tag sample separately. It is about 0.1% for -tagged events and about 1.5% for -tagged events. The systematic error has been conservatively taken to be equal to the correction itself. For the CV, the measured correction ranges from 0.04% to 0.09%, depending on the tag sample; we assign a systematic error equal to half the value of the correction itself. Finally, since losses to nuclear interactions contribute to the value of , we assign an additional fractional error of 0.1% for the - and -tagged samples.
Last, we use the MC to check the stability of the results with respect to variations of each of the cuts used to increase the purity of the samples. Moving the cut from 50 to 70 MeV changes the efficiency from 0.89 to 0.77 and the efficiency from 0.87 to 0.70, while inducing variations of 0.1% and 0.4% in the resulting and BRs, respectively. We have performed similar studies for the and cuts, giving a total contribution to the fractional systematic error of 0.17% for and 0.49% for .
8 Results
The four determinations of the and branching ratios are listed in Table 6. The fractional uncertainties range from 1.5% to 2.1% for BR() and from 1.5% to 2.7% for BR().
| Tagging decay | ||||
|---|---|---|---|---|
| 0.04953 (74) | 0.04930 (103) | 0.04968 (76) | 0.05024 (102) | |
| 0.03217 (63) | 0.03223 (87) | 0.03233 (49) | 0.03275 (86) |
Averaging the results for each charge state, we obtain:
and
The between the measurements of and is 0.17/1 (probability 0.68); for and it is 0.12/1 (probability 0.73). The final averages are:
The for the four independent measurements for each tag type is 1.62/3 for decays (probability 0.65) and and 1.07/3 for decays (probability 0.78). Our final BR results have a fractional uncertainty of 1.1% for and 1.2% for decays; all contributions to the error are summarized in Table 5. The dominant contribution to the total error is from the statistics used to estimate the correction to the efficiency.
All of the averages and values quoted above are calculated with all correlations between measurements taken into account. While the correlation between the numbers of and events induced by the fit procedure is low (about 1%), a significant correlation arises from the corrections to the tag bias, which are equal for the two channels, as well as from the data/MC corrections for the tracking and the clustering efficiencies, and finally, from the selection cuts. Excluding the contribution from the uncertainty in the value of the lifetime, the total error matrix for the final measurements of and is
corresponding to a correlation coefficient between the errors on and of 62.7%.
With this correlation taken into account, we evaluate the ratio from our results for and . We obtain . This value has a fractional error of about 1.0% and is in agreement with the theoretical prediction, =0.6646(61) [15].
Using the PDG value for the lifetime [2] and the KLOE values for the semileptonic form factors [6], we obtain
The average is = 0.21410.0013, including the correlations between the BR measurements and the use of the same lifetime value for both decays. Using = 0.961(8) from [16], is 0.2223(23). With [17], we find , so that the first-row test of the unitarity of the CKM matrix is satisfied at the level of .
Acknowledgments
We thank the DAΦNE team for their efforts in maintaining low background running conditions and their collaboration during all data-taking. We want to thank our technical staff: G.F. Fortugno and F. Sborzacchi for their dedicated work to ensure an efficient operation of the KLOE Computing Center; M. Anelli for his continuous support to the gas system and the safety of the detector; A. Balla, M. Gatta, G. Corradi, and G. Papalino for the maintenance of the electronics; M. Santoni, G. Paoluzzi, and R. Rosellini for the general support to the detector; C. Piscitelli for his help during major maintenance periods. This work was supported in part by EURODAPHNE, contract FMRX-CT98-0169; by the German Federal Ministry of Education and Research (BMBF) contract 06-KA-957; by the German Research Foundation (DFG), ’Emmy Noether Programme’, contracts DE839/1-4; by INTAS, contracts 96-624, 99-37; and by the EU Integrated Infrastructure Initiative HadronPhysics Project under contract number RII3-CT-2004-506078.
References
- [1] CUSB Collaboration, C. Klopfenstein et al., Phys. Lett. B 130 1984 444.
- [2] Particle Data Group, W.-M. Yao et al., Journal of Physics, G33, 1 (2006).
- [3] F. Ambrosino et al., [KLOE Collaboration], Phys. Lett. B 632 2006 43.
- [4] F. Ambrosino et al., [KLOE Collaboration], Phys. Lett. B 626 2005 15.
- [5] F. Ambrosino et al., [KLOE Collaboration], Phys. Lett. B 636 2006 166.
- [6] F. Ambrosino et al., [KLOE Collaboration], JHEP 07 12:105, 2007.
- [7] F. Ambrosino et al., [KLOE Collaboration], Phys. Lett. B 636 2006 173.
- [8] F. Ambrosino et al., [KLOE Collaboration], Phys. Lett. B 632 2006 76.
- [9] F. Ambrosino et al., [KLOE Collaboration], Phys. Lett. B 597 2004 139.
- [10] M. Adinolfi et al., [KLOE Collaboration], Nucl. Instrum. Meth A 488 2002 51.
- [11] M. Adinolfi et al., [KLOE Collaboration], Nucl. Instrum. Meth A 482 2002 364.
- [12] M. Adinolfi et al., [KLOE Collaboration], Nucl. Instrum. Meth A 492 2002 134.
- [13] F. Ambrosino et al., [KLOE Collaboration], Nucl. Instrum. Meth A 534 2004 403.
- [14] C. Gatti, Eur.Phys.J.C, 45, 417 (2006).
- [15] FlaviaNet Working Group on Kaon Decays, contributed to 4th International Workshop on the CKM Unitarity Triangle, Nagoya, Japan 12-16 Dec 2006, hep-ex/0703013.
- [16] H. Leutwyler, M. Roos, Z. Phys. C, 25 1984 91.
- [17] I.S. Towner, J.C. Hardy, arXiv:0710.3181 [nucl-th] (2007).