Galaxy evolution in the high redshift, colour–selected cluster RzCS 052 at
Abstract
We present deep and imaging of the colour-selected cluster RzCS 052 and study the color-magnitude relation of this cluster, its scatter, the morphological distribution on the red sequence, the luminosity and stellar mass functions of red galaxies and the cluster blue fraction. We find that the stellar populations of early type galaxies in this cluster are uniformly old and that their luminosity function does not show any sign of evolution other than the passive evolution of their stellar populations. We rule out a significant contribution from mergers in the buildup of the red sequence of RzCS 052. The cluster has a large () blue fraction and and we infer that the evolution of the blue galaxies is faster than an exponentially declining star formation model and that these objects have probably experienced starburst episodes. Mergers are unlikely to be the driver of the observed colour evolution, because of the measured constancy of the mass function, as derived from near-infrared photometry of 32 clusters, including RzCS 052, presented in a related paper. Mechanisms with clustercentric radial dependent efficiencies are disfavored as well, because of the observed constant blue fraction with clustercentric distance.
keywords:
galaxies: luminosity function, mass function – galaxies: formation — galaxies: evolution — galaxies: clusters: general — galaxies: clusters: individual RzCS 052 Galaxies: elliptical and lenticular, cD1 Introduction
The existence of a tight, and apparently universal, color-magnitude relation for galaxies in nearby clusters (e.g. Bower, Lucey & Ellis 1992; Andreon 2003; Lopez-Cruz, Barkhouse & Yee 2004; McIntosh, Rix & Caldwell 2005; Eisenhardt et al. 2007 and references therein) implies that the majority of the stellar populations of early-type cluster galaxies were formed at over relatively short timescales. Studies of clusters at high redshift, then, should allow us to witness the earlier stages of galaxy evolution, leading to the establishment of the present day luminosity function, color-magnitude relation and morphological mixtures. A classical example of this kind of studies is the detection of a blueing trend among galaxies in clusters at by Butcher & Oemler (1984).
Until large samples of high redshift () clusters become available, detailed ‘case studies’ of individual objects may provide useful clues to the evolution of galaxy populations at half the Hubble time and beyond. Several studies have analyzed a number of such objects in detail (Blakeslee et al. 2003, 2006; Homeier et al. 2005, 2006; Holden et al. 2006; Mei et al. 2006a,b), using both ground-based imaging and spectroscopy and high-resolution imaging with the Advanced Camera for Surveys (ACS) on the Hubble Space Telescope (HST). These observations reiterate that the cluster early-type populations appear to be composed of old stellar populations which were probably in place at high redshift.
Most of the studied high redshift clusters are selected from the X-ray catalogs, which may pre-select objects that have already formed a deep potential well. An alternative strategy is to use clusters selected via the prominent red sequence of early type galaxies (Gladders & Yee 2000). Several clusters have already been identified using the galaxy colours or their spectral energy distributions (Andreon et al. 2005; Stanford et al. 2005).
Here we focus on RzCS 052 (J022143-0321.7), a rich (Abell class 2 or 3) cluster selected via a modified red sequence method, with a measured redshift of and a velocity dispersion of km s-1 and a modest X-ray luminosity of ergs s-1 in the [1-4] keV band. Details about this objects and its properties may be found in Andreon et al. (2007). Because RzCS 052 is less X-ray luminous than clusters at similar redshift, and therefore does not possess a massive X-ray atmosphere, this object allows us to carry out a study of galaxy evolution in a different cluster environment and isolate the effects of gas on galaxy properties (Moran et al. 2007).
The layout of the paper is as follows. We present the data reduction and analysis in the next section. Section 3 discusses the red sequence galaxies. Section 4 deals with the blue galaxies in RzCS 052. Finally, we summarize our results in Section 5. We adopt the concordance cosmological parameters , and km s-1 Mpc-1. Magnitudes are quoted in their native photometric system (Vega for , SDSS for and instrumental for Megacam data). Results of our stochastical computations are quoted in the form where is the posterior mean and is the posterior standard deviation.
2 The data
The data set used here consists of a 2.4ks band image and a 1.4ks band image obtained in July 2006, as part of the pre-imaging for deep spectroscopy of RzCS 052, using the FOcal Reduction Spectrograph (FORS2) imaging spectrograph at the European Southern Observatory (ESO) 8.2m Very Large Telescope (VLT, progr. 075-A0175). FORS2 has a field of view. The typical seeing in these images varies between and , with 5 completeness limits (in apertures, equivalent to a 24 kpc aperture), computed as in Garilli, Maccagni & Andreon 1999) of and mag. The data were reduced and calibrated as usual except for the band calibration, which is not part of ESO’s routine calibrations. This was bootstrapped from the CTIO discovery image for this cluster presented in Andreon et al. (2007), in turn calibrated using standard stars (Smith et al. 2002). Both CTIO and FORS2 have negligible colour terms (if any) with respect to the standard system, as verified by observing a Sloan Digital Sky Survey (SDSS) region with CTIO and with FORS2.
Additional high-resolution imaging for RzCS 052 was obtained from the HST archive, which contains a 12ks -band (F850LP) ACS image of this object (PID: 10496). The image was retrieved from the archive and processed through the Multidrizzle algorithm to remove hot pixels and cosmic rays (Koekemoer et al. 2002). The area sampled by ACS is about 2.2 Mpc2, and 1/5th of the FORS2 area. These data are used for our morphological study of galaxy populations in RzCS 052. Morphologies are estimated by eye (by SA), as usual. For this reason, 20 % of the estimated types are in error, on average (Dressler et al. 1994, Couch et al. 1994, Andreon & Davoust 1997). Our magnitude limit for morphological typing, mag, is conservatively set at about 1.5 mag brighter than similar works (e.g., Blakeslee et al. 2006; Mei et al. 2006a,b) to limit the incidence of typing errors.
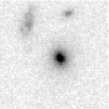
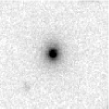
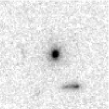
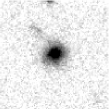
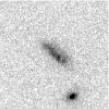
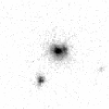
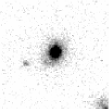
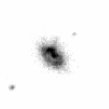
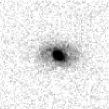
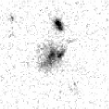
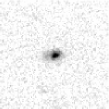
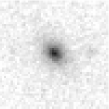
Successful spectroscopy for around 54 galaxies, 21 of which turns out to be cluster members (have a velocity offset less than twice the computed cluster velocity dispersion), was obtained from VLT and Gemini GMOS spectra (see Andreon et al. 2007 for details). The morphology of the 16 confirmed members that are in the ACS image is shown in Fig 1.
The spectroscopic sample is far from complete and, for our purposes, we need to discriminate statistically against fore- and back-ground interlopers. In order to avoid systematic biases introduced by the use of heterogenous observational data for cluster and control field (see e.g. Andreon et al. 2006a), we use two and FORS2 fields (progr. 073.A-0564) having similar depth and seeing to our pre-imaging frames. In order to calibrate the -band photometry we make use of a third archival program (072.C-0689) which acquired some -band imaging of a region overlapping the SDSS (also including standard stars) during the same nights.
Finally, in order to provide a local () reference, we use our observations of Abell 496 at (Struble & Rood 1999) taken (for another project) in December 2005 with Megacam (Boulade et al. 2003) at CFHT under photometric conditions. Megacam has a field of , and our images have seeing between and FWHM. As for RzCS 052, the statistical discrimination of interlopers is performed by using a control field, which observations have been interspersed to Abell 496 observations. Data are reduced as usual and are at least 5 mag deeper than needed for this project.
We produce the object catalog and carry out photometry using the Source Extractor software (SExtractor – Bertin & Arnout 1996). For RzCS052, photometry is carried out in (diameter) apertures, while colours are computed in (diameter) apertures. Abell 496 photometry uses, instead, isophotal corrected magnitude (as “total mag” proxy) and 3 arcsec aperture for colours. Colours are corrected for minor differences (0.05 mag, or less) in seeing, as in Andreon et al. (2004a).
Table 1 lists coordinates, magnitude, colour and morphology of RzCS 052 spectroscopic members.
| RA | DEC | morph. | ||
|---|---|---|---|---|
| 02:21:36.21 | -03:24:56.0 | 21.71 | 0.29 | |
| 02:21:37.08 | -03:24:28.4 | 21.41 | 0.25 | |
| 02:21:37.60 | -03:21:38.0 | 22.00 | 0.04 | late |
| 02:21:38.85 | -03:23:40.7 | 22.47 | -0.10 | late |
| 02:21:39.60 | -03:22:00.9 | 21.50 | 0.34 | early |
| 02:21:40.32 | -03:19:03.4 | |||
| 02:21:40.46 | -03:18:35.6 | |||
| 02:21:41.13 | -03:24:41.2 | 23.13 | -0.70 | |
| 02:21:41.73 | -03:23:35.2 | 22.72 | -0.37 | compact |
| 02:21:42.04 | -03:21:54.1 | 21.90 | 0.25 | late |
| 02:21:42.14 | -03:20:07.0 | 21.65 | 0.15 | late |
| 02:21:42.52 | -03:22:43.6 | 22.81 | -0.25 | late |
| 02:21:42.81 | -03:22:48.8 | 22.16 | 0.32 | late |
| 02:21:43.15 | -03:21:15.2 | 21.16 | 0.09 | late |
| 02:21:43.87 | -03:21:06.0 | 21.35 | 0.27 | early |
| 02:21:43.96 | -03:20:27.9 | 23.21 | 0.17 | late |
| 02:21:44.85 | -03:22:04.3 | 21.10 | 0.32 | late |
| 02:21:44.90 | -03:21:44.5 | 21.34 | 0.25 | late |
| 02:21:45.21 | -03:21:25.5 | 21.78 | 0.27 | late |
| 02:21:45.24 | -03:20:44.3 | 22.31 | 0.29 | early |
| 02:21:48.33 | -03:20:48.6 | 21.82 | 0.16 | late |
Some galaxies have no morphological type or colour because they are outside the ACS or FORS2 field of view.
3 The red-sequence galaxies of RzCS 052
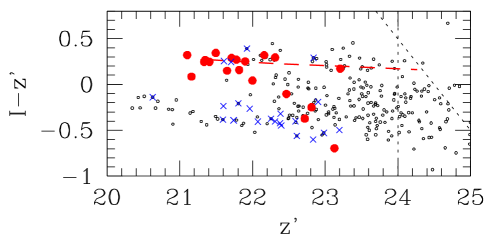
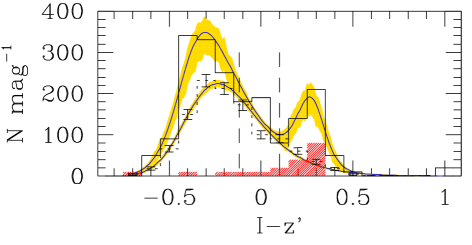
The left-hand panel of Figure 2 shows the vs. color-magnitude diagram of galaxies within of the cluster center. This is equivalent to the restframe vs. . The familiar red sequence and the blue cloud of star-forming galaxies can be clearly identified, even without marking the spectroscopic members. It is easier to identify these features in the colour histogram shown in the right-hand panel of Fig. 2. The narrow peak above the normalized background at represents the red sequence, while the broad feature at bluer colours is due to the blue cloud galaxies.
The line in the left panel of Figure 2 is the predicted color-magnitude relation from Kodama & Arimoto (1997), assuming a formation redshift of and total stellar masses between 0.5 and 2 . These models provide a good fit not only to the present relation, but also to the relation in the discovery image and to the color-magnitude relations of the 18 clusters analyzed by Andreon et al (2004a). This implies that red sequence galaxies in RzCS 052 appear to be dominated by old stellar populations, similar to those in other high redshift clusters, although the precise can vary between 2 and 11 depending on model assumptions (see sec 3.3 of Andreon et al. 2004a).
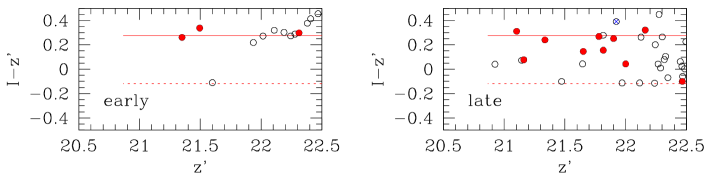
The intrinsic scatter about the color-magnitude relation provides a further clue to the star formation history of these objects. We calculate the dispersion for the 13 galaxies classified as early-type from the HST images and having mag (see Fig 3) using three methods: a) from the measured interquartile range without any outlier clipping; b) using the biweight estimator of scale (Beers et al. 1990) and c) by fitting an Student- distribution, i.e. by Bayesian-fitting an overdispersed version of the Gaussian, in order to account for outliers (Gelman et al. 2004). Once corrected for the photometric errors, as measured by SExtractor, the intrinsic scatter is about mag, which is consistent with the local values (e.g. Bower, Lucey & Ellis 1992; Andreon 2003; Eisenhardt et al. 2007). Following Mei et al. (2006a,b) we can transform this scatter into a mean luminosity-weighted age corresponding to for both galaxy formation scenarios considered by Mei et al. (2006a,b). This is consistent with the usual interpretation that the majority of the stellar populations in the red sequence galaxies were formed during rapid starbursts at high redshift.
It is important to emphasize that the the colour range over which the slope and scatter of the CMR are computed must not be too narrow, otherwise this will result in an artificial low value of the intrinsic scatter. For instance, for a sample of galaxies uniformly distributed in colour, i.e. neither old nor synchronized at all, are selected in a 0.3 mag colour range (as in the ACS cluster survey, e.g. Mei et al. 2006a,b), which has an effective (accounting for the colour-magnitude slope) width of 0.2 mag, then the measured dispersion is mag (). Finding a colour scatter that is small but compatible with an uniform distribution is, therefore, inconclusive about the star formation history in samples severely colour pre-selected. Our estimate of the colour scatter in RzCS 052 is unaffected by the colour pre-selection, because we have considered galaxies up to away from the colour–magnitude relation.
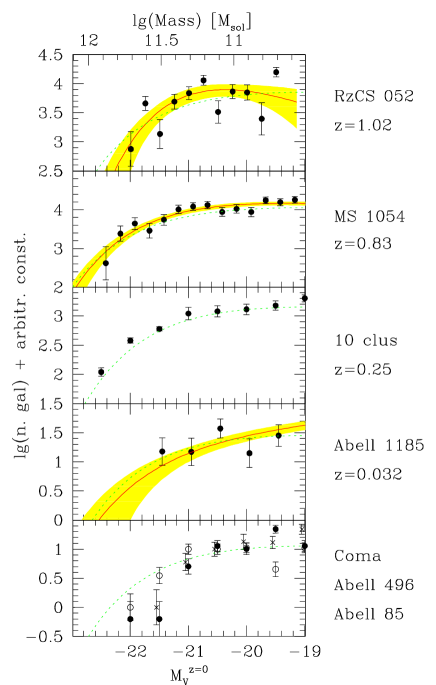
Figure 3 shows the colour-magnitude diagram of galaxies classified as early-type (left panel) and late-type (right panel). The difference in the colour scatter is notable between the two morphological classes, even in the restricted color range studied. Many of the red late-type galaxies are spectroscopic members (marked by solid points), many, from control field observations, are expected to be interlopers. The RzCS 052 red spirals may be analogs of the anemic spirals encountered in low redshift clusters (e.g. Andreon 1996 and reference therein) or of the massive disks of old stars at described by Stockton, Canalizo & Maihara (2004). It is however unclear whether this represents evidence of morphological evolution on the red sequence, because there are several spirals also lying on the red sequence in the Coma cluster (Andreon 1996, Terlevich, Caldwell & Bower 2001), even inside the cluster core. We are presently investigating their nature (Covone et al., in preparation).
Even if the stellar populations of red sequence galaxies are uniformly old, it is still possible that these objects are built via dissipationless mergers of low mass spheroids (the so-called ‘red’ or ‘dry’ mergers). Pairs of close spheroids have been identified in MS1054.3-03 by van Dokkum (1999) and Tran et al. (2005) or in RDCS 0910+54 by Mei et al. (2006a). However, if red mergers are important in the buildup of the red sequence, we should observe a gradual increase in the mean mass of red galaxies with decreasing redshift. According to De Lucia et al. (2006) galaxies more massive than accrete about one half of their mass since , which should make their luminosity fainter than the passively evolved local value by about mag at (and also change the faint end slope, ).
In order to test for the luminosity evolution, we derive the rest-frame band luminosity and mass function of red galaxies in RzCS 052. Red galaxies are defined as being redder than , but we note that adopting the valley between red and blue clouds ( mag, see right panel of Figure 2) identical results are found. Magnitudes were evolved to assuming a Bruzual & Charlot (2003, BC03) single stellar population (SSP) 11.3 Gyr old at (i.e. ) and a Salpeter initial mass function. We also compute a (stellar) mass function using the same BC03 model. The luminosity function is calculated following Andreon, Punzi & Grado (2005), accounting for the background contamination, estimated from control fields, and performing the luminosity function computation without binning the data and computing errors without the restrictive hypothesis that they (only) add up in quadrature.
Figure 4 shows the rest-frame -band luminosity function of RzCS 052 and compares it with the luminosity functions of 16 clusters (see Figure for details). There are 42 red statistical members in the RzCS 052 LF.
In our sample of 16 clusters, we find no evidence of evolution in the luminosity (and mass) function of red galaxies to once the passive evolution of the stellar populations is accounted for, as also found by many previous studies (e.g. De Propris 1999, 2007, Andreon 2006a), but for a sample dominated and not entirely composed by, red galaxies. We can therefore rule out a significant contribution from mergers to the buildup of the red sequence for galaxies with at in our cluster sample as the majority of their stellar mass is already in place. We emphasize once more that we assumed a star formation history to convert luminosity to mass, but any assembly history: the conversion from luminosity to stellar mass holds whether galaxies formed monolithically or assembled hierarchically. A factor two increase in mass due to mergers should move points 0.75 mag to the left in Fig. 4 going from top to bottom.
Our finding, based on mass estimates derived from V-band rest frame magnitudes of a red-selected sample, is in good agreement with previous studies. For example, in the field, Wake et al. (2006) find no evidence for any additional evolution in the luminosity function of luminous red galaxies beyond that expected from a simple passive evolution model. Bundy, Ellis and Conselice (2005) find little evolution at the high mass end of the mass function of morphological early-type galaxies ( % of which with photometric redshifts): in particular the value of early-type galaxies is the same at the highest and lowest redshift bin.
One caveat is that our sample consists of just two high redshift clusters (MS1054 and RzCS 052); however, in both cases, cluster galaxies are more massive than the predictions of hierarachical assembly models and have luminosities consistent with early assembly and no subsequent growth, via merging or star formation. At very least, models must accomodate both merger-driven and merger-free red sequence build up.
There is moderate evidence that RzCS 052 data points fluctuate too much around the best fit model, i.e. that the Poisson model for the likelihood should be updated with a more complex model that allows its variance to be different from (larger than, in our case) its mean. However, such complex (and yet to be determined) statistical model will not considerable move the RzCS 052 luminosity function to the right by about 0.75 mag, because the new model will change the width of point error bars, not the value of points themselves, i.e. it will not make our high redshift galaxies twice fainter and less massive, which is what we need to reconcile data with a merger-driven evolution. In particular, many red galaxies in the first magnitude bin are spectroscopic members (see Fig 2), and any analysis intricacy can make these red massive galaxies disappear from the sample.
4 The blue cloud galaxies in RzCS 052
We now focus on the blue cloud galaxies. We characterize these objects via the traditional blue fraction. Our definition of the blue fraction differs, however, from the conventional definition by Butcher & Oemler (1984) subsequently used by most studies. We define a galaxy as blue if it is bluer than a BC03 model with and Gyr. This galaxy will be bluer by 0.2 mag in than red sequence galaxies at the present epoch (which would be a blue galaxy by the original definition). We also require that this galaxy be brighter than exponential declining () or simple stellar populations (SSP) models having mag at the present epoch (this avoids objects momentarily brightened by starbursts).
The rationale behind this choice is described in detail in Andreon et al. (2006b) but in essence we attempt to account for the different star formation histories of galaxies of different masses. To understand this better, let us consider a cluster of galaxies formed at the same time, but with star formation histories (i.e., e-folding times) dependent on galaxy mass, as in the original downsizing picture of Heavens et al. (2004). It is obvious that the blue fraction in this cluster will change with redshift even if there is no increase in the star formation rate due to the cluster environment. Our approach attempts to identify ‘extra’ star formation above and beyond the increase in the blue fraction due to the younger mean age of the Universe and the secular increase in the star formation rate with redshift.
We compute the blue fraction accounting for background galaxies (i.e. in the line of sight, and not belonging to the cluster) using our control fields following the Bayesian methods introduced in Andreon et al. (2006b), for both a luminosity selected sample and a mass selected sample. For the latter we adopt a mass threshold of , and a definition of mass given by the integral of the star formation rate over .
We computed the blue fraction for RzCS 052 members and also for two nearby galaxy clusters Abell 496 () and Abell 85 (), in order to make a comparison with . These two clusters have velocity dispersions, and thus masses, almost identical to RzCS 052: (Rines et al. 2005) and (Rines & Diaferio 2006). For Abell 496 we both used our Megacam data, and and catalogues published by McIntosh et al. (2005), also used to derive the blue fraction of Abell 85. All virial radii are consistently derived from using eq. 1 in Andreon et al. (2006b).
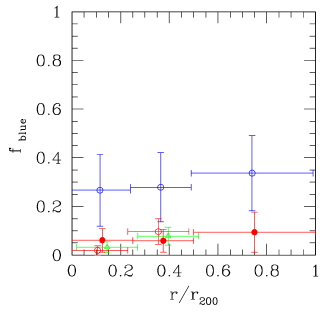
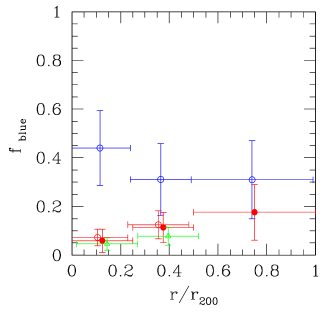
The two independent determinations of Abell 496 turn out to agree each other and agree with the blue fraction of Abell 85 (see Fig. 5).
Figure 5 shows that the blue fractions of RzCS 052, Abell 496 and Abell 85 members does not show a large change with radius (both if the sample is luminosity or mass selected). This result suggests that, whatever mechanism is changing the galaxy properties, it seems to affect in a similar way all the environments within one virial radius. Therefore, mechanisms with a substantial different efficiency at the center and at one virial radius are disfavored. Among them, we mention tidal compression of galactic gas (e.g. Byrd & Valtonen 1990), that by interaction with the cluster potential can alter the star formation rate, and tidal truncation of the outer galactic regions by the cluster potential (e.g. Merritt 1983, 1984), that should remove the gas supply, after eventually a last episode of star formation.
The fraction of blue galaxies is similar for mass– and luminosity– selected samples in all three clusters, and is lower in nearby clusters than in RzCS 052. A redshift-dependent blue fraction is favored, with respect to redshift-independent one, with odds, i.e. there is positive evidence of a change in the blue fraction between and . Abell 496 has and for luminosity- and mass- selected sample within , whereas the respective values for RzCS 052 are and .
The observed evolution in the blue fraction from to does not take place because the fraction of red galaxies decreases with redshift (as shown above, the mass function of the red galaxies is consistent with pure passive evolution). The change of the blue fraction is therefore related to the blue population itself, and it is not a reflex of a change in the red population.
Due to the particular definitions of blue fraction adopted in this work, our finding is qualitatively different from other (apparently similar) claims of a large fraction of blue galaxies at high redshift (e.g. Butcher & Oemler 1984) that, instead, does not account for the increase in the blue fraction due to the younger mean age of the Universe and the secular increase in the star formation rate with redshift. We are stating that we observe a blueing in excess to the one expected in a younger universe, and thus some more mechanism is working in addition to the flow of the time to make galaxies blue.
Blue galaxies might merge to form galaxies on the red sequence, but this would conflict with both the observed evolution of the mass function of galaxies on the red sequence presented in the previous section and the constant mass function of galaxies in 32 clusters, including RzCS 052, at , which is the unique scenario not excluded by Andreon (2006a), and the preferred scenario in other studies (e.g. De Propris et al. 1999; 2007). The only remaining possibility is that the blue galaxy evolution is faster than our library of models used to describe their star formation history ( models), i.e. that blue galaxies in RzCS 052 are experimenting a vigorous star formation history, possibly involving starbursts (perhaps short-lived). This same suggestion is pointed out by the analysis of the rest-frame blue LF of 24 clusters at in Andreon et al. (2004a): values are not aligned on a common evolutionary track (see their Fig 8), but scatter off as much as 1 mag, a clear indication of a complex star formation history.
Since RzCS 052 has a low x-ray emission (see Andreon et al. 2007) than other clusters with an x-ray bright intracluster medium, gas-related quenching mechanisms, such as ram pressure stripping (e.g. Gunn & Gott 1972; Byrd & Valtonen 1990; Quilis, Moore & Bower 2000), turbulent and viscous stripping (Nulsen 1982), thermal evaporation (Cowie & Songaila 1977) and pressure-triggered star formation (Dressler & Gunn 1983), will be much less efficient (e.g. Treu et al. 2003), making unlikely that something that lacks, the gas, play a role in making RzCS 052 galaxies bluer than expected. On the other side, an opposite conclusion can be drawn: the relative lack of gas in RzCS 052 (and therefore less effective quenching) compared to the x-ray bright clusters allows for more extended and vigorous star formation and therefore RzCS 052 has a large blue fraction because the lack of the gas that ultimately ends star formation in infalling galaxies.
5 Conclusions
We presented new results on morphology, mass assembly history, role of environment and colour bimodality of galaxies in the colour selected, modest x-ray emitter, cluster RzCS 052 at , as derived from VLT, HST, and optical data, supplemented by a coarser analysis of a large sample of about 45 clusters, from to (16 in the context of the evolution of red galaxies shown in Fig. 4, and 32 used to constraint the fate of the blue population in Sec 4).
We found that the colour distribution of RzCS 052 is bimodal. Analysis of the morphological mix, slope and intercept of the colour-magnitude relation, and of the mass function shows that RzCS 052 red galaxies differs only by age from their local counterparts and that mergers play a minor role in building massive (down to ) red galaxies in studied clusters, from to today.
The situation is remarkably different for blue galaxies. The blue fraction, once accounted for the younger age of stellar populations at high redshift and for the higher star formation rate there, is larger in RzCS 052 than in nearby similar clusters, highlighting perhaps for the first time that something, in addition to the flow of the time, is making galaxies bluer at high redshift.
Mergers are unlikely to be the driver of the observed colour evolution between and , because of the measured constancy of the mass function, as derived from Spitzer photometry of 32 clusters in Andreon (2006). Mechanisms requiring a substantial intracluster medium, such as ram pressure stripping, are ruled out as well as direct driver, because of the very modest x-ray emission in RzCS 052. Mechanisms with a substantial different efficiency at the center and at one virial radius are strongly disfavored, because of the observed constant blue fraction.
Acknowledgments
SA would like to thank Oscar Straniero, Diego de Falco, Nelson Caldwell, Giovanni Covone and Kodama Tadayuki for their help during the preparation of this paper. We thank the referee for his/her careful advices. It is also a pleasure to acknowledge the hospitality of the University of Bristol, where early discussions about this work took place. SA acknowledge financial contribution from contract ASI-INAF I/023/05/0.
We acknowledge observations taken at ESO (75.A-0175), HST (progr. 10496), CFHT (2005BD96).
References
- Andreon (1996) Andreon, S. 1996, A&A, 314, 763
- Andreon (2003) Andreon, S. 2003, A&A, 409, 37
- Andreon (2006) Andreon, S. 2006a, A&A, 448, 447
- Andreon (2006) Andreon, S. 2006b, MNRAS, 369, 969
- Andreon & Davoust (1997) Andreon, S. & Davoust, E. 1997, A&A, 319, 747
- Andreon et al. (2004) Andreon, S., Willis, J., Quintana, H., Valtchanov, I., Pierre, M., & Pacaud, F. 2004a, MNRAS, 353, 353
- (7) Andreon, S., Punzi, G., Grado, A., 2005, MNRAS, 360, 727
- Andreon et al. (2005) Andreon, S., Valtchanov, I., Jones, L. R., Altieri, B., Bremer, M., Willis, J., Pierre, M., & Quintana, H. 2005, MNRAS, 359, 1250
- Andreon et al. (2006) Andreon, S., Cuillandre, J.-C., Puddu, E., & Mellier, Y. 2006a, MNRAS, 372, 60
- Andreon et al. (2006) Andreon, S., Quintana, H., Tajer, M., Galaz, G., & Surdej, J. 2006b, MNRAS, 365, 915
- (11) Andreon, S., et al. 2007, MNRAS, in press
- Barrientos et al. (2004) Barrientos, L. F., Gladders, M. D., Yee, H. K. C., Infante, L., Ellingson, E., Hall, P. B., Hertling, G. 2004, ApJ, 617, L17
- Beers et al. (1990) Beers, T. C., Flynn, K., & Gebhardt, K. 1990, AJ, 100, 32
- Bertin & Arnouts (1996) Bertin, E., & Arnouts, S. 1996, A&AS, 117, 393
- Blanton (2006) Blanton, M. R. 2006, ApJ, 648, 268
- Blakeslee et al. (2006) Blakeslee, J. P., et al. 2006, ApJ, 644, 30
- Boulade et al. (2003) Boulade, O., et al. 2003, Proc. SPIE, 4841, 72
- Bower et al. (1992) Bower, R. G., Lucey, J. R., & Ellis, R. S. 1992, MNRAS, 254, 589
- Butcher & Oemler (1984) Butcher, H., & Oemler, A., Jr. 1984, Apj, 285, 426
- Byrd & Valtonen (1990) Byrd, G., & Valtonen, M. 1990, ApJ, 350, 89
- Bruzual & Charlot (2003) Bruzual, G., & Charlot, S. 2003, MNRAS, 344, 1000
- Couch et al. (1994) Couch, W. J., Ellis, R. S., Sharples, R. M., & Smail, I. 1994, ApJ, 430, 121
- Cowie & Songaila (1977) Cowie, L. L., & Songaila, A. 1977, Nature, 266, 501
- De Lucia et al. (2006) De Lucia, G., Springel, V., White, S. D. M., Croton, D., & Kauffmann, G. 2006, MNRAS, 366, 499
- de Propris et al. (1999) de Propris, R., Stanford, S. A., Eisenhardt, P. R., Dickinson, M., & Elston, R. 1999, AJ, 118, 719
- De Propris et al. (2007) De Propris, R., Stanford, S. A., Eisenhardt, P. R., Holden, B., & Rosati, P. 2007, AJ, in press (astro-ph/0702050)
- Dressler & Gunn (1983) Dressler, A., & Gunn, J. E. 1983, ApJ, 270, 7
- Dressler et al. (1994) Dressler, A., Oemler, A. J., Butcher, H. R., & Gunn, J. E. 1994, ApJ, 430, 107
- Eisenhardt et al. (2006) Eisenhardt, P. R., De Propris, R., Gonzalez, A., Stanford, S. A., Dickinson, M. E., & Wang, M. C. 2007, ApJS, in press (astro-ph/0611873)
- Garilli et al. (1999) Garilli, B., Maccagni, D., & Andreon, S. 1999, A&A, 342, 408
- (31) Gelman, A., Carlin, J., Stern, H., Rubin, D., 2004, Bayesian Data Analysis, Chapman & Hall/CRC
- Gladders & Yee (2000) Gladders, M. D. & Yee, H. K. C. 2000, AJ, 120, 2148
- Gunn & Gott (1972) Gunn, J. E., & Gott, J. R. I. 1972, ApJ, 176, 1
- Heavens et al. (2004) Heavens, A., Panter, B., Jimenez, R., Dunlop, J. 2004, Nature, 428, 625
- Holden et al. (2006) Holden, B. P. et al. 2006, ApJ, 642, L123
- Homeier et al. (2005) Homeier, N. L. et al. 2005, ApJ, 621, 651
- Homeier et al. (2006) Homeier, N. L. et al. 2006, ApJ, 647, 256
- Kodama, Arimoto, Barger, & Arag’on-Salamanca (1998) Kodama, T., Arimoto, N., Barger, A. J., & Arag’on-Salamanca, A. 1998, A&A, 33 4, 99
- Koekemoer et al. (2002) Koekemoer, A. M., Fruchter, A. S., Hook, R. N., & Hack, W. 2002, in The 2002 HST Calibration Workshop : Hubble after the Installation of the ACS and the NICMOS Cooling System, Proceedings of a Workshop p.337, 337
- Lopez-Cruz et al. (2004) Lopez-Cruz, O., Barkhouse, W., Yee, H. K. C. 2004, ApJ, 614, 679
- McIntosh et al. (2005) McIntosh, D. H., Zabludoff, A. I., Rix, H.-W., & Caldwell, N. 2005, ApJj, 619, 193
- Mei et al. (2006) Mei, S., et al. 2006a, ApJ, 644, 759
- Mei et al. (2006) Mei, S., et al. 2006b, ApJ, 639, 81
- Moran et al. (2007) Moran, S. M., Ellis, R. S., Treu, T., Smith, G. P., Rich, R. M., & Smail, I. 2007, ApJ, in press (arXiv:0707.4173)
- Merritt (1984) Merritt, D. 1984, ApJ, 276, 26
- Merritt (1983) Merritt, D. 1983, ApJ, 264, 24
- Nulsen (1982) Nulsen, P. E. J. 1982, MNRAS, 198, 1007
- Pierre et al. (2004) Pierre, M. et al. 2004, JCAP, 9, 11
- Quilis et al. (2000) Quilis, V., Moore, B., Bower, R. G. 2000, Science, 288, 1617
- Rines et al. (2005) Rines, K., Geller, M. J., Kurtz, M. J., & Diaferio, A. 2005, AJ, 130, 1482
- Rines & Diaferio (2006) Rines, K., & Diaferio, A. 2006, AJ, 132, 1275
- Secker et al. (1997) Secker, J., Harris, W. E., & Plummer, J. D. 1997, PASP, 109, 1377
- Smail et al. (1998) Smail, I., Edge, A. C., Ellis, R. S., & Blandford, R. D. 1998, MNRAS, 293, 124
- Smith et al. (2002) Smith, J. A. et al. 2002, AJ, 123, 2121
- Stanford et al. (2005) Stanford, S. A., et al. 2005, ApJ, 634, L129
- Stockton et al. (2004) Stockton, A., Canalizo, G., Maihara, T. 2004, ApJ, 605, 37
- Struble & Rood (1999) Struble, M. F., & Rood, H. J. 1999, ApJS, 125, 35
- Terlevich et al. (2001) Terlevich, A. I., Caldwell, N., & Bower, R. G. 2001, MNRAS, 326, 1547
- Tran et al. (2005) Tran, K.-V. H., van Dokkum, P., Franx, M., Illingworth, G. D., Kelson, D. D., & Schreiber, N. M. F. 2005, ApJ, 627, L25
- Treu et al. (2003) Treu, T., Ellis, R. S., Kneib, J.-P., Dressler, A., Smail, I., Czoske, O., Oemler, A., & Natarajan, P. 2003, ApJ, 591, 53
- van Dokkum et al. (1999) van Dokkum, P. G., Franx, M., Fabricant, D., Kelson, D. D., Illingworth, G. D. 1999, ApJ, 520, L95