11email: [ptb;johnal;xilouris;cgoudis]@astro.noa.gr 22institutetext: Astronomical Laboratory, Department of Physics, University of Patras, 26500 Rio-Patras, Greece.
22email: pechris@upatras.physics.gr 33institutetext: Technological Education Institute of Crete, General Department of Applied Science, P.O. Box 1939, GR-710 04 Heraklion, Crete, Greece.
33email: fotis@physics.uoc.gr
First optical detection from the supernova remnant G 15.11.6
Deep optical CCD images of the supernova remnant G 15.11.6 were obtained and filamentary and diffuse emission has been discovered. The images, taken in the emission lines of HN ii, [S ii] and O iii, reveal filamentary and diffuse structures all around the remnant. The radio emission at 4850 MHz in the same area is found to be well correlated with the brightest optical filaments. The IRAS 60m emission may also be correlated with the optical emission but to a lesser extent. The flux calibrated images suggest that the optical emission originates from shock-heated gas ([S ii]/H 0.4), while there is a possible H ii region ([S ii]/H 0.3) contaminating the supernova remnant’s emission to the east. Furthermore, deep long–slit spectra were taken at two bright filaments and also show that the emission originates from shock heated gas. An O iii filamentary structure has also been detected further to the west but it lies outside the remnant’s boundaries and possibly is not associated to it. The O iii flux suggests shock velocities into the interstellar clouds” 100 km s-1, while the S ii ratio indicates electron densities up to 250 cm-3. Finally, the H emission has been measured to be between 2 to 7 erg s-1 cm-2 arcsec-2, while the lower limit to the distance is estimated at 2.2 kpc.
Key Words.:
ISM: general – ISM: supernova remnants – ISM: individual objects: G 15.11.61 Introduction
Supernova remants (SNRs) play an important role to understand the SN mechanism, the interstellar medium (ISM) and their interaction. Most of the SNRs have been detected in radio from their non–thermal synchrotron emission. Observations of SNRs in X–rays allow us to directly probe the hot gas inside the primary shock wave, while optical observations offer an important tool for the study of the interaction of the shock wave with dense material found in the ISM. New searches in optical waveband continue to identify Galactic SNRs (e.g. Boumis et al. bou02 (2002), bou05 (2005); Mavromatakis et al. mav02 (2002), mav05 (2005)) while in the last decade, observations in X–rays have also detected new Galactic SNRs (e.g. Seward et al. sew95 (1995); see also Green gre06 (2006) for a complete catalogue).
G 15.1–1.6 is not a well known SNR, and was first detected by Reich et al. (rei88 (1988)) in the Effelsberg 2.7 GHz survey and the radio image was published by Reich et al. (rei90 (1990)). It is classified as a shell–type SNR, with a spectral index of 0.8. Its angular size is 30′ 24′and using the brightness–to–diameter (–D) relationship the distance of the remnant was calculated at 5.7 kpc (Green gre06 (2006)). Radio surveys of the surround area do not reveal any pulsar to by associated with G15.1–1.6 while it has not been detected optically in the past.
In this paper we report the optical detection of G 15.1–1.6. We present images of the remnant in the HN ii, [S ii] and [O iii] emission lines. Deep long slit spectra were also acquired in a number of selected areas. In Sect. 2 we present information about the observations and data reduction, while the results of the imaging and spectroscopic observations are given in Sect. 3. In Sect. 4 we discuss the optical properties of this SNR, while in Sect. 5 we summarize the results of this work.
2 Observations
A summary and log of our observations is given in Table 1. In the subsections below, we describe the details of these observations.
2.1 Imaging
2.1.1 Wide–field imagery
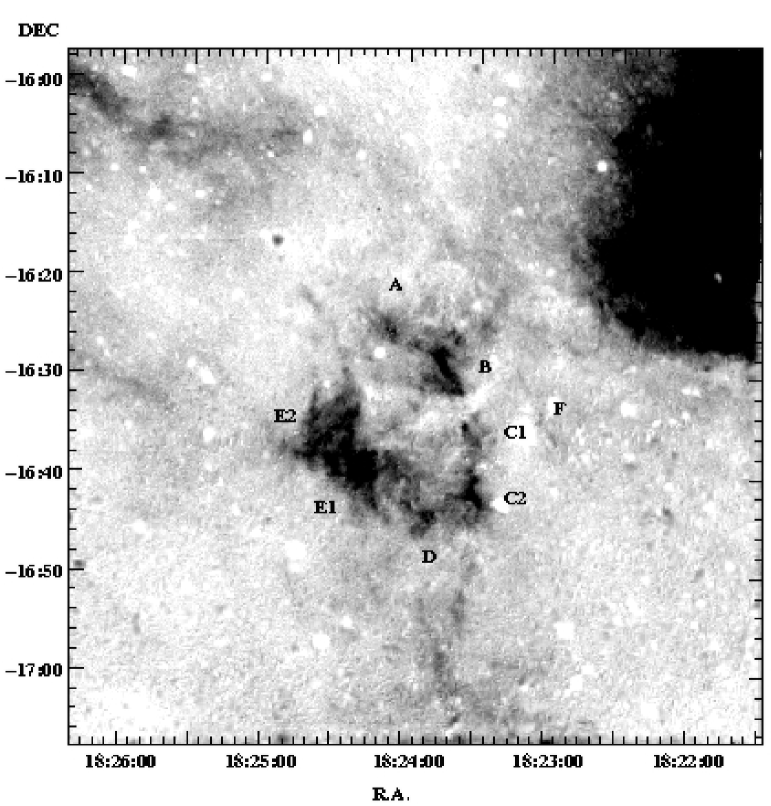
G 15.1–1.6 was observed with the 0.3 m Schmidt–Cassegrain (f/3.2) telescope at Skinakas Observatory, Crete, Greece in June 11, and August 27, 28, and 30, 2005. The data were taken with a 1024 1024 Thomson CCD with a pixel size of 19 m resulting in a 70′ 70′ field of view and an image scale of 4″ per pixel. The area of the remnant was observed with the HN ii, [S ii] and [O iii] filters. The exposure time was set at 2400 sec for each observation and at continuum red and blue filters the exposure time was 180 s. The continuum subtracted images of the HN ii and [O iii] emission lines are shown in Figs. 1 and 2 respectively.
The IRAF and MIDAS packages were used for the data reduction. All frames were bias subtracted and flat–field corrected using a series of twilight flat–fields. Using the continuum images multiply with a proper factor, we subtracted the stars in order to present the remnant. For the absolute flux calibration, the spectrophotometric standards stars HR5501, HR7596, HR7950, HR8634 and HR9087 (Hamuy et al. ham92 (1992)) were used. The astrometric solution for all data frames were calculate using the Hubble Space Telescope (HST) Guide Star Catalogue (Lasker et al. las99 (1999)). All the equatorial coordinates quoted in this work, refer to epoch 2000.
2.1.2 High–resolution imagery
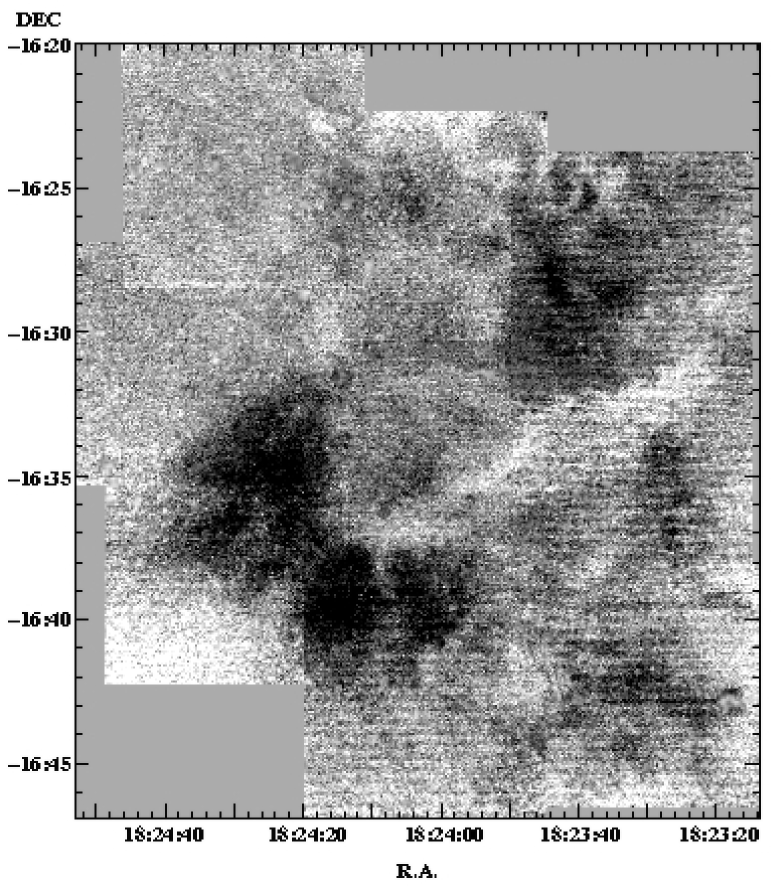
Optical images at higher angular resolution of G 15.11.6 were also obtained with the 1.3 m (f/7.7) Ritchey– Cretien telescope at Skinakas Observatory in July 4–7 and 8–10, 2007, using the H+[N ii] and the O iii interference filters, respectively. The detector was a 1024 1024 SITe CCD with a field of view of 8.5 8.5 arcmin2 and an image scale of 0.5″ per pixel. Nine exposures through the H+[N ii] and O iii filters each of 2400 s and nine corresponding exposures in the continuum, each of 180 s, were taken. During the observations, the “seeing” was varying between 0.8″and 1.5″while the full width at half maximum (FWHM) of the star images was between 1.2″and 2.1″. The continuum–subtracted mosaic of the H+[N ii] and O iii images are shown in Figs. 3 and 4, respectively.
2.2 Spectroscopy
The 1.3 m Ritchey–Cretien (f/7.7) telescope at Skinakas Observatory was used to obtain low dispersion long–slit spectra at June 4 and 5 and September 7, 2005. The exposure time was 3900 s, except for G 15.1–1.6 north area, which was 7800 s. The data were taking with a 1300 lines mm -1 grating and a 2000 800 (13 m) SITe CCD covering the range 4750Å – 6815Å. The spectral resolution is 8 pixels and 11 pixels full width at half maximum (FWHM) for the red and blue wavelengths, respectively. The airmass of the object was varying between 1.6 and 1.7. The slit has a width of 77 and length of 79 and in all cases was oriented in the south–north direction. The coordinates of the slit centers of each spectrum are given in Table 1. For the absolute calibration the spectrophotometric standard stars HR4468, HR5501, HR7596,HR7950, HR8634 and HR9087 were used. The data reduction was performed by using the IRAF package.
3 Results
3.1 The HN ii, S ii and O iii emission line images
Optical filamentary and diffuse emission is detected for the first time for this remnant with several thin and curved filaments found all around the remnant. The most interesting regions lie in the north–west, west and south–east where complex filamentary structures exist. In Table 2, we present typical average fluxes measured in several locations within the field of G 15.11.6. The detected S ii emission appears more diffuse and less filamentary than in the HN ii image, however, its morphology is similar to that in the HN ii therefore, it is not shown here.
Starting from the north, a bright filament 2′ long (named A in Fig. 1) is present with its center approximately at 18h24m04s and –16°25′47″. This filament lies a few arcminutes to the north–east of the very bright 4′ filamentary structure (named B) which is between 18h23m49s, –16°27′26″ and 18h23m36s, –16°30′55″. In particular, there is a very bright filament 3′ long and 1.2′ wide with 1′diffuse emission in its south. South–west of this filament appears a fainter one (C1) at 18h23m34s, –16°35′08″ which is up to 1′ long separated by a 2.5′ gap with area B. This gap is due to the existence of a dark region in the area (probably created by dust – supported also by the IRAS map) preventing the detection of optical emission from the SNR. Further to the south, there is a prominent bright structure which appears also strong and is designated as filament C2. This structure (3′ long, 40″ wide) lies at 18h23m30s, –16°41′56″. To the south, there is fainter 1′ long emission (named D) which has strong S ii emission like the filament in area A (S ii/H 0.7). The east structure consists of two main parts; a very bright one which covers an area of 44 arcmin2, centered at 18h24m17s, –16°39′36″ (E1) and a more complex but less bright between 18h24m38s, –16°31′28″ and 18h24m20s, –16°37′51″ (E2). Diffuse emission is also present close to the filamentary structures as well as the centre of SNR. All filamentary structures have the same curvature which supports that they all belong to G 15.11.6. It is interesting to note the existence of two very thin long filaments to the north of E2 extending for 10′ and join to a 2.5′single filament. Similar filaments also apear to the north–east of area A. Both seem to follow the infrared emission but the low resolution of the latter do not allow a detailed investigation.
The detected O iii emission (Figs. 2, 4) appears less filamentary and more diffuse than in the HN ii image. In Table 2 typical O iii fluxes are listed. Significant differences between the HN ii and O iii images are present for many of the filaments. In particular, to the north, west and south areas (A, B, C and D) in contrast to the bright filaments found in HN ii, the O iii displays a different morphology with much fainter diffuse emission. Only within area B, there is a bright O iii filament centred at 18h23m43s, –16°28′30″ which lies exactly at the same position with the brigth one in HN ii. Further to the west, there is a bright O iii filament (named F) separated to a very thin one (30″wide) at 18h23m10s, –16°31′25″ and a wider complex structure at 18h22m59s, –16°35′49″. This filament does not have HN ii counterpart and at the same location only very faint diffuse emission is found. However, it is not correlated with the 4850 MHz radio map (Fig. 6) of G 15.1 and probably does not belong to remnant. On the other hand, the bright HN ii emission found to the east (area E) appears also bright but less filamentary in O iii. Finally, a similar situation appears both in O iii and HN ii in the areas where weak and diffuse emission is found.
All images being flux calibrated provide a first indication of the nature of the observed emission. An examination of the diagnostic ratio S ii/H shows that the emission from the brightest parts of the remnant originates from shock–heated gas since we estimate ratios S ii/H of 0.4–0.6, which are in agreement with our spectral measurements (Sect. 3.2). The north and south areas (A and D) show S ii/H0.7. A photoionization mechanism may be producing the emission in the south–east region since the ratio S ii/H is 0.3. The possibility that an H ii emission contaminates the remnant’s emission to the east (E) can not be ruled out since for some of the areas close to the filament as well as to the central region of the remnant, we estimate [S ii]/H 0.3–0.4 which is also in agreement with our spectra.
Assuming that all the bright filaments belong to the remnant, their geometry allows us to approximately define its diameter. In particular, the east border of the remnant is defined by the outer filament at 18h24m40.0s, the west border at 18h23m25.0s, the north border at –16°24′ and the south border at –16°46′. Then a diameter of 30′ 24′can be derived with its center at 18h24m00s, –16°35′20″. The optically derived angular size is identical to that quoted in the Green’s catalogue (Green gre06 (2006)).
3.2 The optical spectra from G 15.11.6
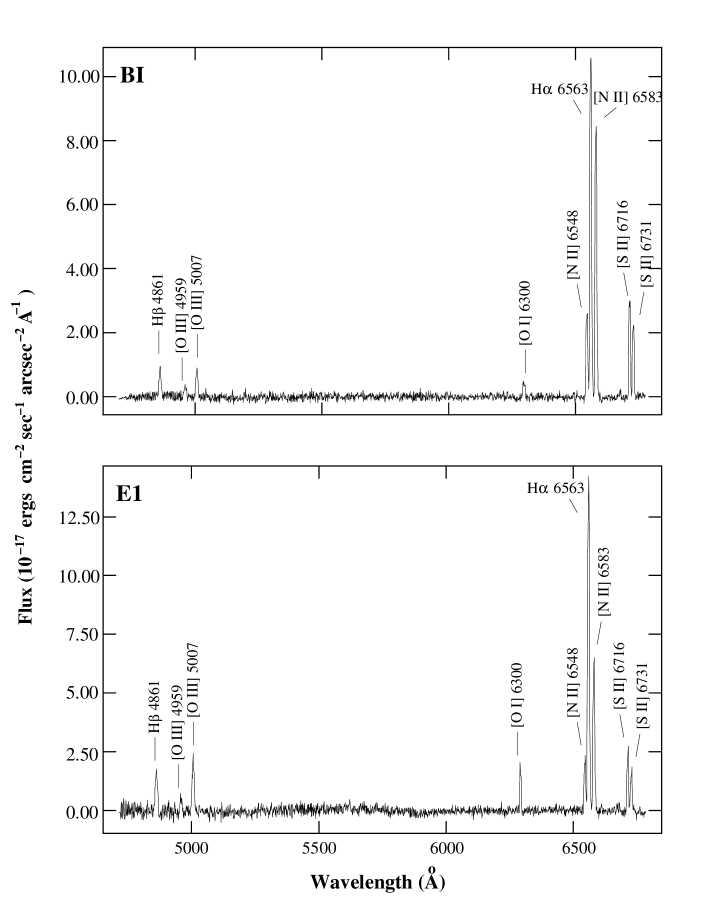
The deep low resolution spectra were taken on the relatively bright optical filaments at two different locations (Table 1). In Table 3 the relative line fluxes taken from the above locations (designated Area B and E) are quoted. In particular, in Area B, we extracted two different apertures (BI and BII) along the slit that are free of field stars and include sufficient line emission to allow an accurate determination of the observed lines. The background extraction apertures were selected towards the north and south ends of each slit depending on the filament’s position within the slit. The measured line fluxes indicate emission from shock heated gas, since S ii/H 0.5. Furthermore, the N ii/H ratio, which takes values between 0.63 and 1.07 (see Table 3, falls well inside the range expected for a SNR (Fesen et al. fes85 (1985)). The signal to noise ratios do not include calibration errors, which are less than 10 percent. Typical spectra from the north (BI) and south (E1) areas are shown in Fig. 5.
The absolute H flux covers a range of values, from 2 to 7 erg s-1 cm-2 arcsec-2. The S ii ratio which was calculated between 1.3 and 1.4, indicates electron densities between 40 to 150 cm-3 (Osterbrock & Ferland ost06 (2006)). However, taking into account the statistical errors on the sulfur lines, we calculate that electron densities up to 250 cm-3 are allowed (Shaw & Dufour sha95 (1995)). Measurements for the O iii/H ratio result in values less than 6. Theoretical models of Cox & Raymond (cox85 (1985)) and Hartigan et al. (har87 (1987)) suggest that for shocks with complete recombination zones this value is 6, while this limit is exceeded in case of shock with incomplete recombination zones (Raymond et al. ray88 (1988)). Our measured values suggest that shocks with complete recombination zones are present. Therefore, according to our measurements and the above theoretical models the estimated shock velocities are 100 km s-1.
3.3 Observations at other wavelengths
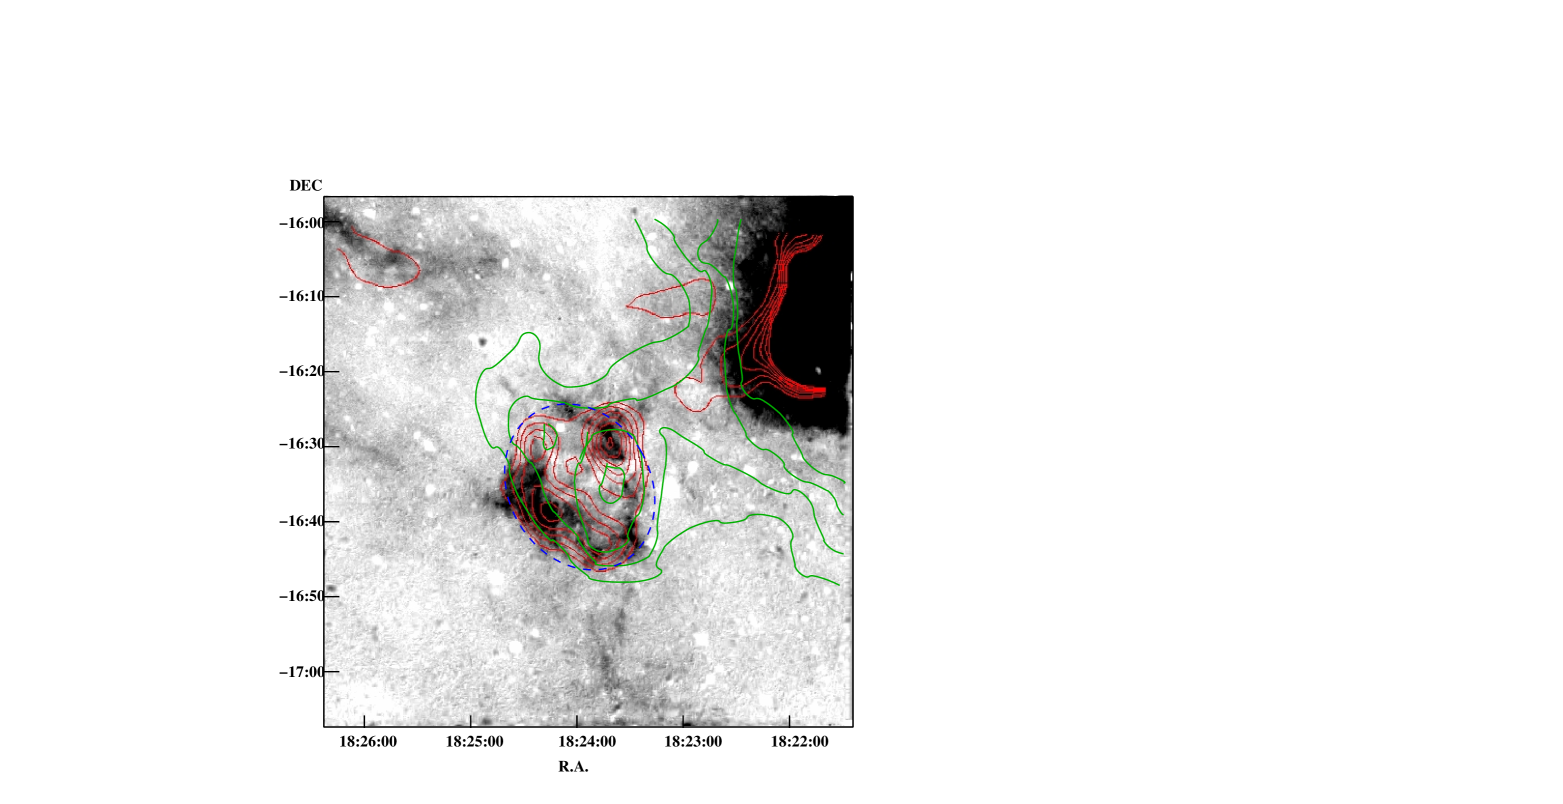
The optical emission matches very well the radio emission of G 15.11.6 at 4850 MHz, suggesting their correlation (Fig. 6). The observed filaments are located close to the outer edge of the radio contours but the low resolution of the radio images does not allow us to determine the relative position of the filament with respect to the shock front. In order to explore how the optical emission correlates with the infrared emission, IRAS images at 60 m of the same area were examined. Fig. 6 shows a deep greyscale representation of the optical emission (HN ii) with overlapping contours of the infrared emission (60 m). Although the low-resolution IRAS map does not permit a detailed comparison with the optical image there is a clear enhancement of infrared emission in the area where the optical emission of the SNR is detected. The infrared emission closely follows the morphology of the SNR but it also fills the central area which is empty of optical emission. We have also examined the ROSAT All–sky survey data but no significant X–ray emission was detected.
4 Discussion
The supernova remnant G 15.1–1.6 shows up as an almost complete shell in the radio band without any X–ray emission detected so far. The absence of soft X–ray emission may indicate a low shock temperature and/or a low density of the local interstellar medium. The HN ii image best describe the newly detected structures. S ii and O iii emission is also detected and generally appears less filamentary and more diffuse than in the HN ii image with their position and shape to be in agreement with that of the HN ii. The O iii emission seems not to be bounded by HN ii emission. An explanation is given by Blair et al. (bla05 (2005)), indicating that the shock emission from the nascent radiative region is sufficient to fully ionize the local preshock gas. The presence of [O i] 6300 Å line emission is also consistent with the emission being shock material. Both the calibrated images and the long–slit spectra suggest that the detected emission results from shock heated gas since the S ii/H ratio exceeds the empirical SNR criterion value of 0.4–0.5, while the measured N ii/H ratio also confirms this result. Note that the possible H ii region found in the low ionization images shows a S ii/H ratio of 0.33. The eastern filament lies very close to this H ii region. The morphological differences between the low and medium ionization lines provide evidence for significant inhomogeneities and density variations in the ambient medium. Hester et al. (1987) suggested that the presence of such inhomogeneities and density variations would mainly affect the recombination zone where the low ionization lines are produced and it could also explain the O iii/H ratio variations seen in the long–slit spectra.
An interstellar extinction c between (see Table 3) 1.17 ( 0.05) and 1.68 ( 0.05) or an AV between 2.51 ( 0.11) and 3.60 ( 0.10) were measured, respectively. We have also determined the electron density measuring the density sensitive line ratio of S ii. The densities we measure are below 250 cm-3. Assuming that the temperature is close to 104 K, it is possible to estimate basic SNR parameters. The remnant under investigation is one of the least studied remnants and thus, the current stage of its evolution is unknown. Assuming that the remnant is still in the adiabatic phase of its evolution the preshock cloud density nc can be measured by using the relationship (Dopita dop79 (1979))
| (1) |
where is the electron density derived from the sulfur line ratio and Vs is the shock velocity into the clouds in units of 100 km s-1. Furthermore, the blast wave energy can be expressed in terms of the cloud parameters by using the equation given by McKee & Cowie (mck75 (1975))
| (2) |
The factor is approximately equal to 1 at the blast wave shock, is the explosion energy in units of 1051 erg and rs the radius of the remnant in pc. By using the upper limit on the electron density of 250 cm-3, which was derived from our spectra, we obtain from Eq. (1) that . Then Eq. (2) becomes , where the distance to the remnant in units of 1 kpc.
Estimated values of N cm-2 and N cm-2 are given by Dickey & Lockman (dic90 (1990)) and Kalberla et al. (kal05 (2005)) respectively, for the column density in the direction of G 15.11.6. Using the relation of Ryter et al. (ryt75 (1975)), we obtain an NH of and for the minimum and maximum c values calculated from our spectra, respectively. Both values are consistent with the estimated galactic NH considering the uncertainties involved. Since, there are no other measurements of the interstellar density n0, values of 0.1 and 1.0 will be examined. Following the result of Eq. (2) and assuming the typical value of 1 for the supernova explosion energy (E51), we find that the remnant may lie at distance greater than 2.2 kpc. Then, the lower interstellar density of 0.1 cm-3 suggests that the column density is greater than , while for n it becomes greater than . Combining the previous results and assuming that the column density is found in the range of , then the lower interstellar density seems to be more probable. However, since neither the distance nor the interstellar medium density are accurately known, we cannot confidently determine the current stage of evolution of G 15.11.6.
5 Conclusions
The faint supernova remnant G 15.11.6 was observed for the first time in major optical emission lines. The images show filamentary and diffuse emission structures. The bright filaments are very well correlated with the remnant’s radio emission at 4850 MHz suggesting their association, while correlation evidence also shown with the IRAS 60m map. The flux calibrated images and the long–slit spectra indicate that the emission arises from shock heated gas. Finally, an upper limit for the electron density of 250 cm-3and a lower limit for the distance of 2.2 kpc are calculated.
Acknowledgements.
JA acknowledges funding by the European Union and the Greek Ministry of Development in the framework of the programme ‘Promotion of Excellence in Research Institutes (2nd Part)’. Skinakas Observatory is a collaborative project of the University of Crete, the Foundation for Research and Technology-Hellas and the Max-Planck-Institut für Extraterrestrische Physik.References
- (1) Blair W. P., Sankrit R. & Raymond J. C., 2005, AJ, 129, 2268
- (2) Boumis P., Mavromatakis F., Paleologou E. V., 2002, A&A, 385, 1042
- (3) Boumis P., Mavromatakis F., Xilouris E. M., Alikakos J., Redman M. P., Goudis C. D., 2005, A&A, 443, 175
- (4) Cox, D. P. & Raymond, J. C. 1985, ApJ, 298, 651
- (5) Dickey, J. M. & Lockman, F. J. 1990, ARAA, 28, 215
- (6) Dopita, M. A. 1979, ApJS, 40, 455
- (7) Fesen R. A., Blair W. P. & Kirshner R. P., 1985, ApJ, 292, 29
- (8) Green D. A., 2006, A Catalog of Galactic Supernova Remnants (2006 April version), Mullard Radio Astronomy Observatory Cambridge
- (9) Hamuy, M., Walker, A. R., Suntzeff, N. B., Gigoux, P., Heathcote, S. R. & Phillips, M. M. 1992, PASP, 104, 533
- (10) Hartigan, P., Raymond, J. & Hartmann, L. 1987, ApJ, 316, 323
- (11) Kalberla P. M. W., Burton, W. B., Hartmann, Dap, Arnal, E. M., Bajaja, E., Morras, R., Pöppel, W. G. L., 2005, A&A, 440, 775
- (12) Lasker B. M., Russel J. N. & Jenkner H., 1999, in the HST Guide Star Catalog, version 1.1-ACT, The Association of Universities for Research in Astronomy, Inc
- (13) Lockman F. J., 1989, ApJS, 71, 469
- (14) Mavromatakis F., Boumis P., Papamastorakis J., Ventura J., 2002, A&A, 388, 355
- (15) Mavromatakis F., Boumis P., Xilouris E. M., et al., 2005, A&A, 435, 141
- (16) McKee, C. F., & Cowie, L. L. 1975, ApJ, 195, 715
- (17) Osterbrock D. E. & Ferland G. J., 2006, Astrophysics of gaseous nebulae and AGN, eds. University Science Books, US
- (18) Raymond J. C., Blair W. P., Fesen R. A. & Gull T. R. 1983, ApJ, 275, 636
- (19) Raymond, J. C., Hester, J. J., Cox, D., Blair, W. P., Fesen, R. A. & Gull, T. R. 1988, ApJ, 324, 869
- (20) Reich, W., Fürst E., Reich P. & Junkes N., 1988, in IAU Colloq. 101, Supernova Remnants and the Interstellar Medium, eds. Roger R. S. and Landecker T. L. (Cambridge Univ. Press), 293
- (21) Reich, W., Fürst E., Reich P. & Reif K., 1990, A&AS, 85, 633
- (22) Ryter, C., Cesarsky, C. J., Audouze, J., 1975, ApJ, 198, 103
- (23) Seward F.D., Dame T.M., Fesen R.A., Aschenbach B., 1995, ApJ, 449, 681
- (24) Shaw, R. A. & Dufour, R. J. 1995, PASP, 107, 896
| IMAGING | ||||||
| Filter | Total exp. time | No of diff. fields | Telescope | |||
| () | () | (sec) | ||||
| H[N ii] 6548 & 6583 Å | 6570 | 75 | 7200 (3)a | 1 | 0.3-m | |
| O iii 5007 Å | 5010 | 28 | 7200 (3) | 1 | 0.3-m | |
| S ii 6716 & 6731 Å | 6720 | 18 | 4800 (2) | 1 | 0.3-m | |
| Cont blue | 5470 | 230 | 180 | 1 | 0.3-m | |
| Cont red | 6096 | 134 | 180 | 1 | 0.3-m | |
| O iii 5007 Å | 5010 | 28 | 2400 | 9 | 1.3-m | |
| Cont blue | 5470 | 230 | 180 | 9 | 1.3-m | |
| H[N ii] 6548 & 6583 Å | 6570 | 75 | 2400 | 9 | 1.3-m | |
| Cont red | 6096 | 134 | 180 | 9 | 1.3-m | |
| SPECTROSCOPY | ||||||
| Area | Slit centres | Total exp. time | Offsetb | Aperture lengthc | Telescope | |
| (sec) | (arcsec) | (arcsec) | ||||
| North (BI) | 18h23m44.0s | -16°29′05″ | 7800 (2) | 10.6 N | 38.9 | 1.3-m |
| North (BII) | 18h23m44.0s | -16°29′05″ | 7800 (2) | 96.8 N | 13.0 | 1.3-m |
| South–East (E1) | 18h24m14.6s | -16°36′38″ | 3900 | 123.3 S | 15.3 | 1.3-m |
a Numbers in parentheses represent the number of individual frames.
b Spatial offset from the slit centre in arcsec: N(North), S(South).
c Aperture lengths for each area in arcsec.
| A | B | C | D | E | Fa | |
|---|---|---|---|---|---|---|
| HN ii | 86 | 156 | 111 | 80 | 152 | 24 |
| S ii | 30 | 38 | 30 | 28 | 37 | 5b |
| O iii | 12 | 5 | 20 | 9 | 16 | 21 |
Fluxes in units of erg s-1 cm-2 arcsec-2
Median values over a 40″ 40″ box.
a The west O iii bright filament outside the snr’s borders.
b 3 upper limit.
| Area BI | Area BII | Area E | |||||||
| Line (Å) | Fa | Ib | S/Nc | F | I | S/N | F | I | S/N |
| H 4861 | 9 | 35 | (27) | 11 | 35 | (11) | 13 | 35 | (25) |
| [O iii] 4959 | 6 | 20 | (20) | 11 | 31 | (12) | 7 | 18 | (17) |
| [O iii] 5007 | 7 | 29 | (33) | 14 | 39 | (18) | 18 | 43 | (39) |
| O i 6300 | 4 | 5 | (35) | 6 | 7 | (14) | 6 | 7 | (33) |
| [N ii] 6548 | 26 | 26 | (160) | 20 | 20 | (44) | 16 | 15 | (74) |
| H 6563 | 100 | 100 | (441) | 100 | 100 | (162) | 100 | 100 | (276) |
| [N ii] 6583 | 81 | 79 | (373) | 63 | 62 | (109) | 47 | 47 | (163) |
| [S ii] 6716 | 30 | 27 | (161) | 28 | 26 | (52) | 19 | 18 | (81) |
| [S ii] 6731 | 24 | 21 | (129) | 22 | 20 | (41) | 14 | 13 | (62) |
| Absolute H fluxd | 3 | 2 | 7 | ||||||
| [S ii]/H | 0.50 0.03 | 0.48 0.07 | 0.33 0.02 | ||||||
| F(6716)/F(6731) | 1.29 0.10 | 1.32 0.25 | 1.38 0.12 | ||||||
| N ii/H | 1.07 0.02 | 0.83 0.04 | 0.63 0.01 | ||||||
| [O iii]/H | 1.40 0.09 | 2.00 0.30 | 1.73 0.12 | ||||||
| c(H) | 1.68 0.05 | 1.38 0.11 | 1.17 0.05 | ||||||
| EB-V | 1.160.03 | 0.95 0.08 | 0.810.03 | ||||||
a Observed fluxes normalised to F(H)=100 and uncorrected for interstellar extinction.
b Intrinsic fluxes normalised to F(H)=100 and corrected for interstellar extinction.
c Numbers in parentheses represent the signal to noise ratio of the quoted fluxes.
d In units of erg s-1 cm-2 arcsec-2.
Listed fluxes are a signal to noise weighted average of two fluxes for areas BI and BII.
The emission line ratios [S ii]/H, F(6716)/F(6731) and [O iii]/H are calculated using the corrected for interstellar extinction values.
The errors of the emission line ratios, c(H) and EB-V are calculated through standard error propagation.