PKS B1545321: Bow shocks of a relativistic jet?
Abstract
Sensitive, high resolution images of the double-double radio galaxy PKS B1545321 reveal detailed structure, which we interpret in the light of previous work on the interaction of restarted jets with pre-existing relict cocoons. We have also examined the spectral and polarization properties of the source, the color distribution in the optical host and the environment of this galaxy in order to understand its physical evolution. We propose that the restarted jets generate narrow bow shocks and that the inner lobes are a mixture of cocoon plasma reaccelerated at the bow shock and new jet material reaccelerated at the termination shock. The dynamics of the restarted jets implies that their hot spots advance at mildly relativistic speeds with external Mach numbers of at least 5. The existence of supersonic hot spot Mach numbers and bright inner lobes is the result of entrainment causing a reduction in the sound speed of the pre-existing cocoon. The interruption to jet activity in PKS B1545321 has been brief – lasting less than a few percent of the lifetime of the giant radio source. The host galaxy is located at the boundary of a large scale filamentary structure, and shows blue patches in color distribution indicative of a recent merger, which may have triggered the Mpc- scale radio galaxy.
keywords:
galaxies: active – galaxies: individual (PKS B1545321) – galaxies: jets – radio continuum: galaxies1 Introduction
PKS B1545321 is a remarkable example of a rare type of powerful radio galaxy in which two double radio structures share the same radio axis and core (Saripalli et al., 2003): PKS B1545321 is a double-double radio source. It was proposed that the inner 300 kpc double source, embedded within the Mpc-scale lobes of the giant radio galaxy, represents a new cycle of activity; that is, newly restarted jets have been ‘caught in the act’ of propagating through the remnant cocoon of a previous active phase. There are more than 10 such sources in the literature that have been identified as possible restarting radio sources on the basis of the detection of inner double structures recessed from the ends of diffuse outer lobes. In the case of PKS B1545321, the outer lobes extend almost all the way to the centre without any significant emission gap and the inner double is traced, embedded within the outer lobes, all the way from the central core to its bright ends. Therefore, PKS B1545321 is a good candidate for a detailed study of the interaction of restarted jets with relict cocoons. Understanding the physics in such interactions is a step towards using the phenomenon of double-double radio sources as a probe of the physical nature of extended radio lobes and the causes and timescales associated with recurrence in jets in active galactic nuclei.
The existence of double-double radio sources is evidence that the jet activity from the central engine of an active galactic nucleus (AGN) is not continuous over the life-time of a source: There appear to be interruptions to the flow that may be related to either a lack of fuel at the central engine, or instabilities in the accretion disk, or instabilities in the jet production mechanism. It has been recognized that unless the axis of the central engine changes dramatically, the newly restarted jets will initially propagate through the relict cocoons of past activity, rather than thermal ambient medium, as in the usual case of a single jet outburst. We expect the evolution of the jets to be unusual in the cocoon environment, since the energy density in the lobes of a radio galaxy is dominated by relativistic magnetized plasma and the cocoon medium is much lighter compared to the thermal interstellar and intergalactic media.
Models for the development of jets in synchrotron cocoons have been presented in the literature. Clarke & Burns (1991) and Clarke (1997) carried out two- and three-dimensional numerical simulations of an under-dense, supersonic (Mach 6) restarting jet, and found that the new jet is heavy with respect to the cocoon of the first jet. As a consequence, the restarted jet propagates almost ballistically through the pre-existing cocoon, terminating in only a weak (and hence not very radio bright) shock. The supersonic advance of the new jet in the old cocoon also excites a weak bow shock immediately ahead of the new jet, which Clarke (1997) suggest should be a visible feature in the radio lobe of a restarting radio source. Another feature of the Clarke & Burns (1991) and Clarke (1997) simulations is that there are no emission features that could be ascribed to emission from the cocoon of the restarted jet. This is presumably the result of the weak terminal shock combined with the rapid adiabatic expansion of the post hot spot flow.
Whilst these simulations were informative and highlighted aspects of restarting jets that were not appreciated at the time (in particular the rapid advance of the head of the new jet), they are not consistent with the observations of the Mpc-scale double-double radio galaxies of which PKS B1545321 is an example. Bow shock features have not been realized in observations of restarting sources to date: The observed inner double sources simply appear as edge-brightened lobes in radio images (e.g. Saripalli et al. (2002), Schoenmakers et al. (2000), Saikia et al. (2006)). Moreover, the outer ends of the inner doubles have a high contrast with respect to the background radio lobes indicating that the terminal shocks are at least of moderate strength. (We note however, anticipating observational results discussed below, that the inner hot spots are not as bright as one observes in normal FR2 radio galaxies.)
A different approach to the observations is to interpret the inner doubles as edge-brightened lobes, rather than near-ballistic jets and to invoke thermal densities inside the pre-existing cocoons at levels that are higher than predicted by simulations. Kaiser et al. (2000) proposed that the entrainment of dense warm clouds of the intergalactic medium (IGM) could significantly contaminate the synchrotron emitting cocoons, so that the development of the new jets thereafter would be more consistent with the observations: The interaction between the new jet and entrained gas would result in leading hot spots and new, filled inner lobes. Additionally, the long timescales for the entrainment and dispersion of the contaminating material make this type of model particularly relevant to giant radio galaxies, in which inner doubles are frequently observed. However, leading bow shocks are expected in this model as well.
Interpreting the inner structures as lobes may solve one problem, namely their brightness, but the problem of a missing bow shock remains. An additional possibility is that the restarted jets may advance hypersonically with respect to the relict synchrotron lobes of the radio galaxy. In this case, the leading bow shock may have a sufficiently small opening Mach angle that the emission from both the bow shock and restarted jet would together form a narrow inner double structure, appearing as inner lobes without any distinct leading bow shock. This possibility was in fact considered by Clarke (1997) as a possible interpretation of the quasar 3C219. However, the required Mach number was of order 1,000. In the case of PKS B1545321 the required Mach number is not nearly so extreme so that this idea is worth pursuing. Other variations on this theme include the possibility that changes in direction of the restarting jet would widen the working surface and lead to an apparent decrease in the bow shock angle with consequently less stringent requirements on the Mach number of the leading hot spot. Another possibility is that the bow shock is further influenced by the cocoon matter distribution. We consider these possible theoretical interpretations in § 5 and especially § 5.4.
In this paper we present new higher-resolution VLA radio continuum observations of the inner double source of PKS B1545321 at 22 and 6 cm wavelengths, and examine the detailed structure of the inner lobes in the light of the models described above. Our modelling of the propagation and evolution of restarted jets in a relict cocoon results in estimates for the entrained thermal densities in the outer lobes and the external Mach number of the new jet. With about five synthesized beams across the inner double, our new VLA images of PKS B1545321 are the highest quality (sensitivity and resolution) images to date of any restarting source and provide an excellent opportunity for such an investigation. Hydrodynamic simulations of restarting jets are being performed in order to provide an insight into the appearance of inner doubles in these scenarios; the results of these simulations will be presented elsewhere (Safouris et al., in preparation).
We adopt a flat cosmology with parameters , and a Hubble constant km s-1 Mpc-1. The host galaxy has an absolute magnitude and is at a redshift of (Simpson et al., 1993). At this redshift, 1″= 1.95 kpc.
2 Radio continuum Observations
Radio observations of the giant radio galaxy PKS B1545321 were previously carried out with the Australia Telescope Compact Array (ATCA) in 2001 (Saripalli et al., 2003); three separate 12 h Fourier-synthesis observations were done in three different array configurations at 22 and 12 cm wavelengths.
We have made new observations of the source with the Very Large Array (VLA) in 2002, at 22 and 6 cm wavelengths, to improve the imaging sensitivity and resolution for the inner source structure: the improved radio continuum images form the basis of this work. A journal of these observations is given in Table 1. The source, located at the southern declination of , is visible to the VLA for a total of 6 hr in any single observation. We used the hybrid array configurations with the northern extended arm to give near circular beams for this southern source. To obtain the maximum resolution, we used the BnA array configurations at both observing frequencies. The source was also observed at 6 cm with the scaled CnB configuration to obtain visibilities with spacings that match the 22 cm BnA data: multi-frequency observations using scaled arrays are important for studies of spectral index and polarization as a function of wavelength.
In the 22 and 6 cm bands, we used bandwidths of 25 and 50 MHz centered at 1384 and 4910 MHz respectively. These bandwidths were divided into independent channels 3.125 and 12.5 MHz wide respectively, in order to avoid image degradation owing to bandwidth smearing. At 22 cm, we estimate that the reduction in peak response at the ends of the outer lobes, as a result of bandwidth smearing, is less than 5%. At 6 cm wavelength, the reduction in peak response at the ends of the inner double is also less than 5%.
The multi-channel continuum visibility data were calibrated using standard techniques in AIPS. The channel data were averaged to make a pseudo-continuum ‘channel-0’ data-set. Gains and phases in the ‘channel-0’ visibility data were calibrated using interspersed observations of the nearby secondary calibrator J1522275. The flux scale was set to the Baars scale (Baars et al., 1977) using an observation of 3C286. The observation of 3C286 was also used to calibrate the instrumental polarization. The ‘channel-0’ amplitude and phase calibration was copied to the multi-channel data and bandpass calibration was determined using observations of the secondary calibrator.
The calibrated 6 cm BnA and CnB visibilities obtained using the VLA were concatenated. We constructed images from the 22 and 6 cm VLA visibilities separately using MIRIAD, adopting the Clarke algorithm (Clark, 1980) to deconvolve the strong compact sources and the Steer-Dewdney-Ito algorithm (Steer et al., 1984) for fainter extended source structure. Several rounds of phase self- calibration were iteratively performed. We combined the self-calibrated VLA 22 cm visibilities with self-calibrated archival 22 cm ATCA visibilities (from Saripalli et al., 2003); to our knowledge this is the first time that VLA and ATCA datasets have been combined and imaged. We performed a linear mosaic of these 22 cm VLA and ATCA visibilities using the MIRIAD routine INVERT, which accounts for the differing primary beams of the two telescopes. After converting the ATCA linear and VLA circular polarization measurements to Stokes parameters, the routine images the two telescope data separately and then combines them in a linear mosaic process, where pixels in the individual images are weighted to correct for the primary beam attenuation. Deconvolution of the mosaiced 22 cm image was done using the maximum entropy algorithm implemented in the MIRIAD routine MOSMEM. Our technique for combining and imaging the separate ATCA and VLA observations is described in further detail in Appendix A
2.1 22 cm radio continuum
The combined VLA and ATCA 22 cm radio image is shown in Figure 1. The image was made with a beam of FWHM and has a dynamic range of about 200. The rms noise in the image is Jy beam-1 and the lowest contour is drawn at . The total angular extent of the radio source is (corresponding to a projected linear size of 1.02 Mpc). From the core, which is coincident with the nucleus of the host galaxy, the source is somewhat more extended towards SE; the ratio of the extents towards SE and NW is 1.07. The low-surface-brightness lobes are edge brightened and the bridge between the ends is connected with no emission gap. There are no hot spots at the ends. The brightest feature in the image is the 2 9 (340 kpc) inner double structure, which appears to be fully embedded within the diffuse lobes of the giant radio galaxy.
The lobes have a surface brightness that increases towards the ends: the center of the bridge has a surface brightness about 100 mJy arcmin-2 rising to about 300 mJy arcmin-2 towards the two ends. Relatively bright rims and weak emission peaks are observed at the ends, which are just factors of two brighter than the surrounding lobes. These weak emission peaks, or warm spots, are well resolved by the beam and are likely the remnants of past hot spots: their presence suggests that the sound crossing times in the lobes are not high enough to erase the evidence of the powerful jets since they stopped feeding the ends of the outer lobes. The radio contours in Figure 1, which are spaced in logarithmic intervals, are tightly spaced at the ends indicating a sharp boundary; the relict lobes do not appear to have had the time to relax to equilibrium with the surrounding IGM.
The total flux density of the outer double radio source is 1.7 Jy at 22 cm, which corresponds to a total radio power of W Hz-1 at this wavelength. Considering the absolute magnitude of the host galaxy, , this places the outer lobes of the Mpc-scale radio galaxy in the powerful FR-II radio galaxy regime (Owen, 1993), and almost an order of magnitude above the FR I/II break in radio power. This is consistent with the edge-brightened morphology of the giant radio lobes.
The inner double structure is clearly seen in the 22 cm radio image as a pair of relatively bright almost linear features that are entirely contained within the outer lobes of the giant radio galaxy. In projection, the inner double and outer lobes have a common radio axis and core. The inner source has been traced in the 22 cm image all the way from the central core to its bright ends, which are well recessed from the outer lobe ends. A gradual curvature is observed over the entire length of the inner source, which is reflection symmetric about the core. An extrapolation of the inner double structure shows that the restarted jets are directed towards the brightest warm spots at the ends of the relict lobes, indicating that the restarted jets are probably tracing the paths of the jets just before the central engine turned off.
2.2 6 cm radio continuum
The radio image of the inner double source at 6 cm wavelength is shown is Figure 2. This image was made with the combined BnA and CnB VLA visibilities. The image has an rms noise of 20 Jy beam-1 and the dynamic range is about 125. This high-resolution 6 cm image does not have the surface brightness sensitivity to detect the relatively fainter parts of the inner lobes closer to the core, which are traced in the 22 cm image with poorer resolution. The emission trail of the NW inner source extends approximately from its end towards the core and fades out at approximately from the core. The emission trail of the SE inner source extends twice as far before the surface brightness drops to the same detection limit. The 6 cm images have beem made with a circular beam of FWHM 1 3; there are synthesized beams across the width of the inner source, and we have well resolved all the complex structure within the length of the observed inner source as well as at the ends of the double structure.
The inner sources have relatively bright ends and lower surface brightness emission trailing off towards the core. The emission trails have an almost constant deconvolved FWHM about 8″( 16 kpc). The bright structures at the leading ends are narrower and have deconvolved FWHM of 3 ″–4″( 6–8 kpc). As observed projected on the sky, the bright ends of the inner structures are at somewhat different distances from the core: we measure the arm-length (distance from the core to the ends) ratio to be approximately 1.22.
Our new high resolution 6 cm wavelength VLA image reveals a number of characteristics, which are not apparent in previous ATCA images of the source. First, patchy emission features, which are 2–4 times brighter than the underlying emission, are observed along the trail in the SE inner source at 6 cm wavelength (see Figure 2). These features are also observed at the same locations in a 22 cm wavelength VLA image at 26 resolution, which is shown in Figure 3, indicating that they are genuine.
The second new feature is that these emission enhancements appear to be located on both sides of a central channel along the length of the trail: there appears to be a channel running along the center of the SE inner lobe where there is a decrement in the surface brightness level. A central decrement was also noted in previous 13 cm ATCA images made with a lower resolution (Saripalli et al., 2003); however, the relatively poorer resolution had led to the inference that the inner lobe had the form of an emission sheath whereas with the improved resolution of our new 6 cm image it is apparent that structure is that of a cylinder with an emission decrement along a narrow cylinder running along the axis. The central decrement in the surface brightness is traced all of the way to the head, where it ends at the bright peak. Additionally, our new 6 cm image reveals that the decrement in surface brightness follows a straight line within the southern emission trail and, surprisingly, the decrement does not follow the overall curvature that is observed over the length of the inner source. A mean profile across the width of the SE lobe, which clearly shows the central channel, is shown and discussed later in § 4.1. We do not observe a central decrement in the surface brightness distribution over the short length of the northern trail in our VLA 6 cm wavelength image. However, a dip in the surface brightness level is detected in profile cuts across the faint northern trail in the 22 cm VLA image made with 26 FWHM beam (see Figure 3). The decrements trace a straight line from the core to the bright peaks at the ends of the inner double.
The third new feature is that our new VLA 6 cm wavelength image resolves the bright ends of the inner double radio source. The image reveals extraordinary structures at the leading ends, which were not seen in previous ATCA images. The SE inner source terminates in a rim of enhanced emission, which is approximately 10 times brighter than the trail towards the core. The curved rim extends approximately from the tip along the edges of the two sides, and is the brightest feature in the radio galaxy, with a peak surface brightness of 0.4 mJy arcsec-2. The NW inner lobe terminates in a well resolved, relatively high surface brightness plateau, which is 4 times brighter than the trailing emission. The bright peaks at the ends of the inner sources are sightly recessed from the leading edges of the detected emission, at least in projection.
The total flux density of the inner double source at 6 cm wavelength is 35 mJy, implying that the total radio power of the inner double source is about W Hz-1 at 1.4 GHz. The absolute magnitude of the host galaxy is and, according to the relation in Owen (1993), the total radio power of the inner lobes of the restarting radio galaxy is below the FR I-II dividing line.
2.3 Polarization and rotation measure
We have made images of the polarized intensity at 6 and 22 cm wavelengths using, respectively, the VLA CnB array visibilities at 6 cm and BnA array visibilities at 22 cm. The polarization images, at a resolution of 35, were used to compute distribution of rotation measure (RM) over the inner double. We find that the RM is fairly uniform, with no significant variations, over each of the two components. The NW component has a mean RM of rad m-2 with a 1- scatter of 4 rad m-2. The SE inner source has a somewhat lower mean RM of rad m-2 with a 1- scatter of 5 rad m-2. The mean RM over the entire inner double is rad m-2, which is close to the mean value of rad m-2 found by Saripalli et al. (2003) for the outer lobes.
In order to examine the polarization structure in greater detail over the inner double, polarization images with beam FWHM 13 were made using the BnA and CnB visibilities at 6 cm wavelength. In Figure 4, we show the distribution of polarized intensity at 6 cm wavelength. Overlaid are vectors showing the orientation of the projected -field, with lengths proportional to the fractional polarization. The orientations of the vectors have been corrected for Faraday rotation, assuming a uniform rad m-2. Peaks in the polarized intensity are observed at the ends of the northern and southern sources.
At the leading end of the SE component, there are two peaks in the polarized intensity located to the NE and SW of the peak in total intensity. In the trail behind the total intensity peak there are two rails of enhanced polarized emission. The fractional polarization is enhanced along the boundaries of the source and decreases towards the centre-line where there is also a decrement in the total intensity. The patchy emission features that were observed in total intensity images along the length of the SE component are not coincident with peaks in the fractional polarization. The mean level of fractional polarization over the SE component is . Around the rim in the total intensity image, where there are peaks in the polarized intensity, the mean fractional polarization is . The projected magnetic field vectors, which are perpendicular to the -field orientations, are aligned with the total intensity contours around the boundaries of the source.
The polarization characteristics of the NW component are similar to those of the SE component. The mean fractional polarization over its length is , similar to that seen over the SE component. The fractional polarization too is enhanced along the boundaries. There are several patches where the fractional polarization is relatively low; these are located in regions where the orientations of the -vectors change sharply in direction, and are likely a result of beam depolarization. Along the boundaries of the northern source, the magnetic field is aligned with the total intensity contours. In the central regions of the head and trailing emission, the magnetic field vectors are in a direction perpendicular to the radio axis.
We do not find any evidence for Faraday depolarization between 22 and 6 cm wavelengths over the NW inner source, for which we measure an average depolarization ratio (DR; the ratio between the percentage polarization at 22 cm to that at 6 cm) of approximately 1. However, there is an indication of depolarization over the SE inner source, where the average DR is approximately 0.85. Saripalli et al. (2003) estimated the DR in the outer lobes to be in the range 0.96–1.0 at the ends and decreasing to approximately 0.92 at the centre, with no DR asymmetry between the two lobes.
2.4 Spectral index
The distribution of spectral index () over the inner double, between 6 and 22 cm wavelengths, was computed using VLA visibilities obtained in scaled arrays: CnB data at 6 cm and BnA data at 22 cm. Images at both wavelengths were made with beams of FWHM 35. Figure 5 shows the resulting spectral index distribution; pixels in the individual images that had intensities less than the rms image noise were blanked. We observe no obvious variations in the distribution of spectral index over the two components of the inner double. The NW and SE components of the inner double have mean spectral indices of and respectively. These values are in agreement with the values found by Saripalli et al. (2003) between 22 and 12 cm wavelengths; therefore, there is no evidence for a curvature in the spectra of the two components between 22 and 6 cm wavelengths.
We have examined the data for trends in the mean index along the length of the source by averaging the spectral index distribution shown in Figure 5 across the width of the source. The resulting profile shows no significant trend: we find that along the observable lengths of the inner northern and southern sources, from their bright ends to their fading emission trails, the spectral index remains fairly constant, and at a value in the range to .
We have used our new and improved 22 cm image of the source, with the 13 cm image presented in Saripalli et al. (2003), to examine the spectral index distribution in the outer lobes. We do not include an image of the computed spectral indices here, since our results are consistent with those derived in Saripalli et al. (2003). Overall, there is a steepening of the spectral index from the outer extremities towards the centre. The spectral indices in the warm spots at the ends of the NW and SE outer lobes ( and respectively) are very similar to that in the emission peaks in the NW and SE inner lobes (). The outer lobe regions with higher surface brightness, including those regions adjacent to the peaks at the ends of the inner double, have relatively flatter spectral indices. The lower surface brightness bridge in the vicinity of the core and the inner double has a spectral index that is relatively steeper and patchy with in the range to .
3 The host galaxy and environment
3.1 B and R band images
We obtained optical images of the host galaxy of PKS B1545321 with the Wide Field Imager (WFI) at the prime focus of the 3.9 m Anglo-Australian Telescope (AAT) in August 2004 during service time. We carried out observations in the R-, V- and B-bands using one of the eight 2k x 4k CCDs. Conditions were non-photometric with a mean seeing of 2″. The data were reduced using standard techniques in the IRAF software package. Frames were bias subtracted and flat-fielded using dome flats. Image registration was carried out using stars in the field, whose coordinates were measured on the SuperCOSMOS (SCOS) B-band image with an rms accuracy of 0.1 pixels. Reduced images in the R- and B-bands are shown in Figures 6 and 7.
The host galaxy appears to be ordinary in the R-band AAT image. Isophotal contours, which are shown overlaid on the image, appear to be elliptical and are symmetrical about the centre. In contrast, the host galaxy appears somewhat disturbed in the B-band image: there is an offset between the centres of the inner and outer isophotes and the isophotes are extended to the west. Additionally, the B-band image shows a distinct compact object to the SE and embedded within the faint envelope of the host galaxy; however, no corresponding component is apparent in the R-band image. It was previously noted that the B- band digitized SuperCosmos image of the host galaxy showed signatures of a central dust lane perpendicular to the radio axis (Saripalli et al., 2003); however, our new higher quality AAT images show no evidence for a dust lane.
We fitted elliptical isophotes to the R- and B-band images using the IRAF routine ELLIPSE (Jedrzejewski, 1987). We ignore the fits to the central diameter region since they would be compromised by any ellipticity in the point spread function. Immediately outside this zone, the fitted elliptical isophotes are similar in the red and blue images and have position angles in the range 60–80∘. At a distance of 3.6 kpc (1.8 arcseconds) from the nucleus, the fitted isophotes abruptly rotate through and increase in ellipticity. In order to reveal any morphological patchiness, we constructed models of the host galaxy in the R and B-bands and subtracted these from the two AAT images. The IRAF task BMODEL was used to create the models by interpolating the elliptical isophotal fits to the data. We did not include the third and fourth order harmonics of the elliptical fits in the model subtraction as these were found to introduce spurious features in the residual images.
The residual R- and B-band images are displayed in Figures 8 and 9. Grey-scales in these subtracted images signify excess emission over that expected in the models. The R-band residual image does not reveal any peculiar features within the brighter regions and envelope of the host galaxy. On the other hand, the B-band residual image, clearly reveals a distinct object to the SE of the centre and at a projected distance of 10.5 kpc. The counts in this region exceed seven times the rms noise in the region where the model has been subtracted. Separately, there is a hint of another distinct feature to the west of the nucleus, at a level of four times the rms noise. These components, which are relatively blue in color, may be associated with star-forming regions in the host galaxy and an indication of a recent merger.
3.2 The neighborhood of PKS B1545321 from the 6dF Galaxy Survey
In Figure 10 we have plotted the positions of all galaxies in the vicinity of the host galaxy in redshift space and sky position as measured by the 6-degree-Field Galaxy Survey (Jones et al., 2004, 2005), in a set of redshift slices. The 6dF Galaxy Survey (6dFGS) is a near-infrared selected redshift survey with median redshift , complete to over the entire southern sky (). The five panels from (a) to (e) each cover -fields (280 Mpc) centered on the host galaxy. Each slice is 20 Mpc deep in redshift space, and successive redshift slices overlap by 10 Mpc along the line of sight. Panels (a) and (b) together cover a depth of 30 Mpc in front of the host galaxy; panel (c) covers a depth of 10 Mpc about the host galaxy, and panels (d) and (e) cover a depth of 30 Mpc behind the host galaxy. In panels (a) to (e) of Figure 10 we also show in grey scale the local galaxy density (per sq. deg.) within the individual redshift intervals, smoothed by -diameter windows and sampled at cells spaced apart. Individual 6dFGS fields are in diameter and overlap to varying extents. An image showing the completeness of the survey for the sky region is also shown in panel (f) of Figure 10: it may be noted here that the survey boundary representing the Galactic latitude limit of the survey lies from the host galaxy of PKS B1545321. The effects of redshift incompleteness have been corrected for in panels (a) to (e) by weighting the densities using the redshift selection function for 6dFGS as a function of sky position (see, e.g., Jones et al. (2006)).
The host galaxy is not in a high over-density. Fractional over-density factors up to 8 (which is at the 4 sigma level) are observed within the 280 x 280 x 41 Mpc cube on this smoothing scale. At the location of the host there are no 6dF galaxies within R=15 Mpc radius; however, the over-density factors within a few degrees on the sky and within a few 10’s of Mpc take on values up to 3, indicating that the host galaxy is not in a void either. In velocity space and at redshifts somewhat lower than that of the host, there appear to be galaxy over-densities to the north and west of the host. At redshifts somewhat beyond the host galaxy, the over-densities are to the south and west. The distribution is complex and an elucidation of the detailed structure would require targeted multi-object spectra of numerous galaxies close to the host on the sky, perhaps using the AAOmega on the AAT. On the basis of the distribution in 6dF galaxies, we believe that the host is located in a relatively low galaxy density environment in which the fractional over-density is less than 3. It may be noted here that this result is on a smoothing scale of R=15 Mpc, and the fractional over-density factor could be higher on smaller scales.
The bottom line is that there is no evidence in the 6dF distribution that the host is in a rich cluster or relatively dense parts of the large scale structure of the universe; the host is also not in a void. We may conclude that the host is located in the relatively low density parts of the filamentary galaxy distribution, which has typically fractional over-densities in the range 5-200. Assuming that galaxies trace the gas in the large scale distribution, as is the case in large-scale cosmological hydrodynamical simulations (Cen & Ostriker, 1999; Davé et al., 2001), we may expect the IGM gas density in the vicinity of the Mpc-scale radio source to be overdense by a factor of 3 with respect to the mean baryon density in the IGM associated with the filaments. Again, here we are assuming that there is no small scale structure in the gas in the vicinity of PKS B1545321. Half of the baryons in the universe are missing, presumably in the Warm-Hot IGM associated with the filaments (Cen & Ostriker, 1999), and so the gas density environment of the radio source is at least = g cm-3.
4 Discussion: the phenomenology associated with the restarting jets in PKS B1545321
4.1 The restarted jets
On the basis of the Clarke et al. simulations, high resolution images of inner doubles in restarting radio galaxies are expected to reveal collimated jet structures, with only weak hot spots at their ends. Large-scale jets in powerful radio galaxies are highly collimated (Bridle & Perley, 1984); typically, they have widths of the order of a few kpc (e.g., 3C 353 Swain et al., 1996). However, the ends of the inner double structure in PKS B1545321 are relatively bright with deconvolved widths of about 7 kpc. Moreover, the trails of edge-brightened emission between the extremities and the core are broader and have deconvolved widths of about 13 kpc. It is, therefore, unlikely that the entire inner double structure observed in PKS B1545321 represents collimated restarted jets.
Within the edge-brightened inner double structure we do not observe any relatively narrow, collimated, jet-like emission features that may represent emission from the restarted jets themselves. We do, however, observe a central channel along the length of the southern inner component along which there is a decrement in the surface brightness (see § 2.2). A decrement is also seen along the length of the short NS trail, excluding the bright end (see Figure 3). These dips in the surface brightness may be the signatures of Doppler dimmed jets. For example, jet material moving with a jet Lorentz factor of on the plane of the sky would have a Doppler dimming factor of 0.14. Alternatively, the decrement may be the result of the jet being relatively dim because the particles in the jet are not reaccelerated and the surrounding plasma is freshly accelerated.
In Figure 11, we show the mean transverse profile across the southern inner source. This slice profile was produced by averaging the trailing emission along the length of the source, excluding the bright rim of emission at the end. The profile shows clearly the central decrement in surface brightness. We have modelled this profile as representing emission from an optically thin, thick-walled tube, in which the material in the tube wall has a constant emissivity. We convolved the 1-D slice expected from this model with the synthesized beam and then fitted the resulting function to the observed profile data. The best fit (also shown in Fig. 11) corresponds to an outer diameter of 20 kpc for the cylinder and a diameter of 3.2 kpc for the inner hollow section. Our hypothesis is that the central hollow in the inner lobes of PKS B1545321 represents Doppler-dimmed restarting jets. The observations indicate that the inner lobes are not jets, but composed of central jets surrounded by inner lobes, which in turn are embedded within the relict outer lobes.
These jets on the two sides of the core appear to be misaligned (i.e. the inferred jet paths on each side of the core are not collinear). Moreover, the jets appear to trace a straight path to the ends of the inner double whereas the inner lobes show mild curvature with a C-shape or reflection symmetry. The structure is not inversion symmetric, as we might expect if the jets are precessing. Presumably, the restarted jets were initially collinear and have gradually evolved to their present misaligned state.
4.2 Are there bow shocks in the relict cocoon?
Bow shocks are expected to lead the advance of restarted jets in old cocoons (Clarke & Burns, 1991; Clarke, 1997). We expect to observe these shocks via enhanced synchrotron emission since the relict lobes of a radio galaxy contain relativistic particles and magnetic fields, and the bow shocks should enhance the emissivity by compression of the relativistic plasma and reacceleration of the electrons. In the synthetic surface brightness images derived from the restarting jet simulations, the leading bow shocks do produce observable features that are distinct from the relict outer cocoon emission (Clarke, 1997). The bow shock would be expected to weaken with distance from the apex, but might remain an observable feature over its entire length. At the apex, where the bow shock is stronger and balances the terminal shock of the new jet, the brightness contrast might be an order in magnitude or more. In sharp contrast to the predictions of the numerical simulations, bow shocks ahead of restarting jets have not been evident in observations of double-double radio sources to date (e.g. Saripalli et al., 2002, 2003), and this has been a major motivation for the high resolution and sensitivity radio observations presented here.
In our 22 cm image (Fig. 1) we measure a mean surface brightness of 450 Jy beam-1 and 600 Jy beam-1 in the relict cocoon emission in the vicinity of the ends of the NW and SE inner double; the image rms noise is Jy beam-1. Within the errors in the image, there is no evidence for wide bow shock like features in the outer relict cocoon exterior to the inner double. While there exist regions of enhanced surface brightness around the inner double lobes, notably along the western side of the NW inner component, these regions are patchy and may be extensions of the relatively brighter material that is observed ahead of the inner double lobes. If there is a wider bow shock, which leads the advance of the new jets in the relict lobes, then we estimate that the brightness of any such bow shock, relative to the cocoon is less than about 20%. Relative to the hot spots at the ends of the restarted jet, the brightness of such a bow shock is less than 10%. Our improved images confirm that PKS B1545321 does not have bow shocks exterior to the inner double and with a brightness expected from simulations (in, e.g., Clarke, 1997).
However, we note here that the bow shock may be weak over most of its length and, therefore, reacceleration of particles in the relict cocoon plasma may be insignificant. In this case, any brightness enhancement as a result of the bow shock would be the result of compression of the relict lobe plasma. If the relict cocoon emissivity has a straight synchrotron spectrum with spectral index , and a tangled magnetic field, 1-D compression by factor by a bow shock would enhance on the emissivity by factor : the limit of 20% on the enhancement of emissivity, which we have derived above, requires that the compression be at most 7%. Curvature in the cocoon electron energy spectrum, which might be expected in the relict plasma as a result of enhanced radiative cooling of the more energetic particles, may weaken the constraint on the bow shock compression ratio. However, the extremely low compression ratio required by the stringent observational limits placed by the data presented herein is unlikely.
4.3 The hot spots at the ends of the inner lobes
4.3.1 Total intensity features
Bright hot spots at the ends of radio lobes represent the working surface where the jet meets the ambient medium. Usually this medium is the relatively dense inter-stellar medium (ISM) or IGM, and the result is a strong shock, which converts a large fraction of the jet kinetic energy into relativistic particles. The ambient medium of the restarted jets of PKS B1545321 are the relic synchrotron lobes of the giant radio source. These are expected to be lighter than the ISM or IGM, even if there has been entrainment of thermal material into the lobes. For this reason, we might expect the appearance of hotspots at the ends of restarted jets to be unusual. In addition, we might also expect that the hotspots at the ends of restarted jets are a merger of both the terminal jet shocks and the bow shocks immediately ahead of the jets since both shocks should reaccelerate relativistic particles and amplify magnetic field.
The bright ends of the inner double source of PKS B1545321 are resolved in the 6 cm VLA image (Fig. 2). The SE source terminates in a bright extended peak, where as the NW source terminates in a broad plateau of emission. The peak at the end of the SE source resembles hot spots created by powerful jets in the IGM; however, the end of the NW inner double does not show such a bright compact feature. Leahy et al. (1997) define a hot spot as any feature that is not part of a jet, that has a largest dimension smaller than 10% of the main axis of the source, a peak brightness that is greater then 10 times the rms noise in the image, and that is separated from neighboring peaks by a minimum, which drops to less than two-thirds of the brightness of the fainter peak. If we adopt this definition, then the peak at the tip of the SE inner source may be classified as a hot spot. By fitting a Gaussian to the peak at the end of the jet, we have estimated the intrinsic size of the major and minor axes of the central compact feature to be 31 and 2 1 respectively, corresponding to linear sizes of 6.0 and 4.1 kpc. The measured size is consistent with the size distribution observed by Hardcastle et al. (1998) for a sample of powerful radio galaxies. As far as the NW structure is concerned it would be overprescriptive to insist that this region strictly satisfy the Leahy et al. hot spot criteria. The existence of a region at the NW end of this structure, which is significantly brighter than the rest of the tail, is at least consistent with the interaction of a new jet with the pre-existing lobe. Also, in view of our interpretation of the arm-length asymmetry of the inner double being due to relativistic motion, this region would be Doppler dimmed (see § 5.1).
Despite the similarity to classical hot spots, we note that the compact feature at the end of the SE inner lobe displays some unusual characteristics that are atypical of hot spots observed at the extremities of powerful radio galaxies and are, on the other hand, what we might expect of jets developing in a low density environment. In particular this feature shows an extended rim of emission, which wraps around the head of the source. This rim is extended in a direction perpendicular to the radio axis and shows tails, which extend on either side of the central jet (identified to be the central decrement). The tails extend approximately 5″(10 kpc) back toward the core of the radio galaxy. We have examined high resolution images of powerful radio galaxies in the literature, and do not find any hot spot that resembles the compact structure at the end of the SE inner lobe; no hot spot observed to date shows such a neat rim wrapping around an incoming jet. Indeed many hot spots project beyond the emision of the associated lobe (see Perley et al. (1997) and references therein). The ends of the lobes of powerful radio galaxies often show complex structures, and in many cases multiple hot spots. Although there exist examples of multiple hot spots distributed in rim-like structures at the ends of sources (e.g., the northern lobe of 3C173.1, Hardcastle et al., 1997) it is difficult to find individual hot spots with swept-back wings or tails. The western lobe of 3C234 has a central compact component and ridges on each side that bend back into the lobe (Hardcastle et al., 1997); however, in this case the northern ridge is likely to be a distinct and separate hot spot. We suggest that the extended rim-like structures represents a blending of emission from the jet terminal shocks and the immediately preceding bow shock.
The compact feature at the end of the SE inner double is the brightest feature in PKS B1545321. However, it has a peak surface brightness of only 0.4 mJy arcsec-2 at 6 cm wavelength, which is significantly smaller than the typical surface brightness observed for hot spots in powerful radio galaxies. For example, in the sample of powerful radio galaxies presented in Hardcastle et al. (1997) the surface brightness values of the hot spots are an order of magnitude or more higher. The terminal features at the ends of both the inner SE and NW lobes are intermediate in brightness between the strong hot spots observed in FR2 radio sources and the low contrast Mach disk structures formed at the ends of the new jets in the hydrodynamic restarting jet simulations (Clarke & Burns, 1991; Clarke, 1997). We further suggest that this is indicative of jets terminating in an environment intermediate in density between the normal IGM and the extremely low density of a lobe which has not entrained significant external gas. This assertion is treated quantitatively below.
4.3.2 Polarization features
The polarization characteristics of the inner components also provide useful information. At the SE termination, the magnetic field runs around the head of the source, neatly following the tails in the total intensity distribution (see Fig. 4). At the NW end, the magnetic field is aligned with the total intensity contours. In the central regions of the broad plateau the magnetic field is transverse to the source axis. The observed polarization properties at the ends of the inner northern and southern sources are consistent with what is observed in the hot spots of powerful radio galaxies, where the magnetic field is nearly always perpendicular to the source axis. Using images with 35 FWHM beam, we measure the spectral index at the ends of the NW and SE inner sources to be (see Fig. 5). This is also consistent with that observed in the hot spots of powerful radio galaxies.
Notwithstanding the similarities with the polarization properties of classical hot spots there are some intriguing differences. For example the hot spots in classic FR2 sources such as Pictor A (Perley et al., 1997) exhibit strong polarization coincident with the brightest part of the hot spot with the position angle of the E-vector indicating a magnetic field perpendicular to the jet direction. In PKS B1545321 there are local minima in the polarized intensity either coincident with or nearby to the brightness maxima. The directions of the E-vectors along the boundaries of the SE and NW inner components in PKS B1545321 are consistent with the expected alignment of the magnetic field along a bow shock. The minima near the positions of peak intensity are consistent with the superposition of comparably bright regions in which the magnetic field is (a) perpendicular to the jet (the main hot spot emission) and (b) aligned almost parallel to the jet (the bow shock emission). There are a number of local maxima and minima in the polarization images which could possibly be interpreted as the result of jittering of the jet near the respective hot spots. However, in view of the straightness of the jets inferred from the transverese intensity profiles, we feel that not a great deal of jittering is occurring in this region of the source. On the other hand the local maxima could indicate regions where the inner bow-shocked material interacts with inhomogeneities in the cocoon.
5 Estimates of source parameters
We have noted that there are several possible restarting jet models, which may account for the inner structures observed in PKS B1545321. In the sections below, we derive estimates for a number of physical parameters associated with the source, including the density of entrained matter in the relict cocoon, and the external Mach number of the ends of the restarted jets. These estimates allow us to derive some conclusions about the formation mechanism of the inner double in this source.
5.1 Arm length and brightness asymmetry in the inner double
Consideration of the arm length asymmetry in this radio galaxy provides a valuable constraint on the physical ideas discussed in section 1. One expects the lobes of a powerful radio galaxy to be significantly lighter than the ambient ISM or IGM. Hydrodynamical simulations of restarting jets show that in case of an interruption, restarted jets are of comparable density to the cocoons of the old jets, and as a result they propagate rapidly through the old cocoons (Clarke & Burns, 1991). As compared to the original jets in PKS B1545321, we expect that the new jets would propagate relatively unimpeded in their advance from the core, unless there has been significant entrainment of thermal material into the relict lobes. If the twin oppositely directed jets are advancing at equal and constant velocities, then time retardation introduces an asymmetry in their apparent projected distances from the core; an argument for constant advance velocities is given in section 6. In the usual case where the jets terminate in the ISM or IGM, caution is required in interpreting arm-length ratios since asymmetric distributions of matter around the galaxy can overwhelm time retardation effects. However, in PKS B1545321 the local ISM/IGM has been cleared and the new jets are propagating into synchrotron bubbles created by past activity. This is probably the most ideal circumstance under which time retardation effects may be apparent. This would be the case even if there is entrainment of the local IGM, since the entrainment rates should be similar on both sides of the source. If there is any unevenness in the entrainment rate (as, for example, a result of inhomogeneity in the local IGM distribution), this should be evened out by the dispersal of entrained gas into the large volume of the cocoon.
Let and be the projected lengths of the ends of the jet and counter jet as measured from the core, the speed of the hot spots relative to the speed of light and the angle of inclination of the jet axis to the line of sight. Then the arm length ratio is
| (1) |
implying that
| (2) |
The observed arm length ratio for the inner double in PKS B1545321 is . The corresponding values of are plotted in Figure 12 for angles of inclination in the range . Since PKS B1545321 is a radio galaxy, and not a quasar, we expect that . An immediate implication of equation 2 is that the the angle of inclination cannot exceed , since the hot spot speed . The plot shows that for the allowed range of possible viewing angles (), takes on values in the range 0.14–1.0. The lower limit of about on the advance speed of the new jet is an order of magnitude larger than the typical advance speeds inferred for powerful jets ploughing into the ISM/IGM (Scheuer, 1995), consistent with the model that the restarted jets in PKS B1545321 are indeed evolving into a lighter than usual medium.
The brightness asymmetry ratio in hot spots is another consequence of relativistic speeds at the ends of jets; the observed ratio of the brightness in the hot spots at the NW and SE ends of the inner double is approximately 2. The brightness asymmetry is related to the arm-length asymmetry by
| (3) |
where is the spectral index of the hot spots. Given our observed values of and , the brightness asymmetry is expected to be , which is appealingly consistent with our measured value of 2.
The measured arm-length asymmetry ratio implies that . Giant radio sources are selected from compilations of large angular size radio sources. Hence, are biased towards galaxies lying close to the sky plane with relatively larger angles of inclination. This suggests larger values for . At extreme angles of inclination where takes values close to 1, we expect , and a ballistic advance of the new jets through the outer synchrotron lobes. This is the case predicted by the restarting jet simulations (Clarke & Burns, 1991; Clarke, 1997). However, the range of angles for which approaches 1 is small. For a large range of viewing angles, it is likely that , in which case the advance is not ballistic. This latter scenario is consistent with the morphology of the inner lobes and relatively bright hotspots at their ends.
5.2 Density of entrained matter in the relict cocoon
Assuming a non-ballistic advance for the jet ends, we may estimate the density of the outer lobes by relating the hot spot pressure to the cocoon density and the hot spot advance speed. In this case, the density of the cocoon material, , is given by,
| (4) |
where is the pressure in the hot spot and is the corresponding Lorentz factor. (This expression does not account for all relativistic effects, which we consider below.)
We estimate a minimum hot spot pressure of dyne cm-2 at the end of the SE inner double, using minimum energy conditions (Miley, 1980). We expect the true hot spot pressure . Allowing for relativistic effects, the pressure scales as , where is the Doppler factor. Therefore allowing for relativistic effects in the minimum pressure estimate, the density in the relict cocoon ahead of the restarted jet is:
| (5) |
The density implied by equation (5) is plotted in Figure 13 as a function of angle of inclination for =1. The relationship between and , as implied by the arm-length asymmetry, has been used. The plot shows that the cocoon density is in the narrow range for the range of plausible viewing angles. Repeating the calculation for the end of the NW trail, which has a minimum energy pressure dyne cm-2, gives a similar range of density values.
As shown in § 3.2, we expect that is greater than or of the order g cm-3. Hence, the cocoon density as a fraction of the IGM density is in the range of 0.02 – 0.8. Smaller values of are implied for larger angles of inclination. Our derived values of are, once again, consistent with the notion that the restarted jets in PKS B1545321 are evolving into a medium that is lighter than the IGM. At large angles of inclination, the cocoon density is small (less than of the IGM density). It is under these conditions that we may expect the density of the restarted jets relative to the density of the external cocoon () to be of order unity or greater, as predicted by the restarted jet simulations (Clarke & Burns, 1991; Clarke, 1997). Alternatively, at smaller angles of inclination, where the cocoon densities represent larger fractions of the IGM densities, we expect and the entrainment model of Kaiser et al. (2000) to be more relevant. We return to this point again in § 5.7.
5.3 Expansion timescales for the outer hot spots
The jets in the powerful radio galaxy PKS B1545321 no longer supply energy to the outer lobes of the giant source; they have stopped, restarted, and the new jets currently terminate at locations that are well recessed from the ends of the outer lobes. As discussed in section 2.1, the presence of warm spots at the ends of the outer lobes suggests that the sound crossing times in the lobes are insifficient to completely dissipate the evidence of the previous jet termination. The time required for hot spots with an initial radius and pressure to expand to the observed pressure is given by
| (6) |
(see Appendix B).
Assuming standard minimum energy conditions (Miley, 1980), we estimate the pressure in the remnant hot spots, which have a diameter of kpc, to be dyne cm-2. Based on the empirical relationship derived by Hardcastle et al. (1998), we assume that the hot spots at the ends of the 1.05 Mpc powerful giant radio galaxy had a radius of kpc while the jets were actively feeding them, implying (using equation 28) that the active hot spot pressure was dyne cm-2. Considering the external cocoon densities derived in section 5.2, it follows that the jets ceased feeding the hot spots at most yr ago.
5.4 The Mach number of the advance of the inner double
5.4.1 Dynamical estimate
We may relate the Mach number of advance of the ends of the inner double to the speed of the hot spots and the parameters of the synchrotron plasma in the relict cocoon traversed by the restarted jets. We use the following notation: , where is the sound speed in the relic cocoon; is the corresponding Lorentz factor (Königl, 1980). The Mach number of the new hot spots with respect to the sound speed in the relict cocoon is given by
| (7) |
We use the parameter to denote the ratio , which parametrizes the rest mass density in a medium where the pressure is dominated by relativistic particles (see Bicknell, 1994). In the relict cocoon, the density is dominated by thermal matter, and the pressure, , is dominated by the pressure of the relativistic gas, so that . Similarly, in the jet, . From equation (5) one has
| (8) |
In terms of , the sound speed and corresponding 4-velocity in the cocoon are given by
| (9) | |||||
| (10) |
Combining equations (2) for the velocity in terms of the arm-length asymmetry, (8) for the density parameter, and equation (7) for the hot spot Mach number, enables us to determine the latter as a function of the inclination angle.
We can use the above relationships to gain a semi-quantitative idea of the implications of the inferred parameters when and . In this non-relativistic approximation, the velocity dependence cancels out and the Mach number of the new hot spot is simply given by:
| (11) |
Assuming standard minimum energy conditions (Miley, 1980), the relict cocoon in the vicinity of the ends of the inner double has a pressure dyne cm-2. We may expect the true pressure in the radio lobe to be close to that given by the minimum energy condition, since the run of versus the ratio of particle to magnetic pressures ()) has a shallow minimum, and there is observational evidence that the conditions in many radio lobes and even hot spots are close to equipartition (Croston et al., 2005; Hardcastle, 2003). Hence, using this value for the cocoon pressure and the previously derived value for the hot spot pressure, we derive an estimate of for the hot spot Mach number, independent of angle of inclination.
Let us now consider the more general case where the ends of the new jets could advance with relativistic velocities. As we have seen in section 5.1, this is especially relevant if the radio axis of the giant source is closely aligned with the plane of the sky. In this case, the external Mach number of the hot spot is unbounded as approaches 1. In Figure 14, we show the external hot spot Mach number as a function of viewing angle, as inferred from the above equations for and 10. These curves demonstrate that for , hypersonic external Mach numbers are only implied for a very narrow range of viewing angles. For most viewing angles, the external hot spot Mach number , and is only supersonic rather than hypersonic. On the other hand, the external Mach number is higher if the pressure in the hot spot is greater than the minimum energy estimate. For example, the curve shows that over most angles . Hence the inference of a merely supersonic or hypersonic Mach number depends upon the ratio of the hot spot pressure to the minimum energy pressure.
5.4.2 Mach angle estimate
In the hypersonic restarting jet model, the outer edges of the inner lobes in PKS B1545321 represent the ‘missing’ bow shocks. Thus, it is also of interest to derive an estimate of the external Mach number of the new hot spots, which is based on the opening angles of the putative bow shock.
If the axis of the inner jet is unchanging and the inner lobe structures represent relict lobe material that has been rejuvenated by bow shocks, then the widths of the emission trails are representative of the external Mach numbers of the restarted jets. The asymptotic angle of the bow shock with respect to the jet axis, , is related to the external Mach number of the hot spot by .
The trail of the inner Southern double is long enough that we can make a reasonable estimate of its inclination angle with respect to the radio axis. In order to measure the increase in width with distance along the southern inner trail, we first rotated the 6 cm image by 332 to make the jet axis vertical and then constructed profiles at different distances from the ends, averaging over axial distances of 2.5 synthesized beams in each case. The FWHM of the profiles were measured by including all intensity values exceeding 3 times the rms noise. The measured half-widths along the SE inner source are plotted in Fig 15. The expression for the bow shock angle is an asymptotic one. Therefore we did not construct FWHM profiles at the bright ends where the width changes abruptly with length. We did not carry out the same analysis on the NE trail, since it is much shorter and fainter. In order to measure the opening angles of the low-surface-brightness SE emission trail, we least-squares fitted a straight line to the half-width versus distance data: The slope of the fit to the SE inner lobe data implies a half-opening angle of 25. Simply interpreted, the measured opening angle would imply that the SE hot spot is advancing with a Mach number with respect to the gas in the old cocoon. Thus there is a discrepancy between this Mach angle-based estimate of Mach number and the dynamically based estimate derived above in § 5.4.1.
There are at least three possible explanations for this. One possibility is that the jet changes direction slightly over its lifetime so that the end of the lobe is wider than that associated with a jet which remained constant in direction. This would decrease the apparent shock angle. Another possible explanation is that the inner lobes are affected by inhomogeneities in the cocoon resulting from the entrainment of IGM. In this case, one expects the density to increase towards the sides of the coccon and this would have the effect of keeping the inner lobes narrow. A third possibility is that the hot spot pressure is more than an order of magnitude greater than the minimum energy pressure. Given the results of Hardcastle et al. (2004) who showed, in a sample of 65 hot spots, that departures form equipartition are unlikely, this possibility is remote, with the proviso that hot spot dynamics within a pre-existing cocoon could be different.
5.5 The energy budget
The energy budgets corresponding to the original and restarted jets provide additional information on the ages and advance speeds of the outer and inner radio lobes.
5.5.1 The inner lobes
The FWHM of the SE hot spot is larger than the jet diameter , inferred from the surface brightness decrement in the SE lobe. This may be the result of the dynamics of the shocked plasma near the jet terminus or some wandering about of the jet terminus as envisaged in the Dentist Drill model (Scheuer, 1982). Whatever the reason, we take the area of the hot spot as defining the area of the working surface. The balance between the momentum in the jet and that transfered to the relict cocoon over leads to the following expression for the energy flux in the jet (derived in Appendix C):
| (12) |
The hot spot area . In Figure 16 we have plotted as a function of inclination angle, using the arm-length asymmetry relation (equation 2) and the external (cocoon) densities (derived from equation 5). We have also assumed that . This plot shows that for the plausible range of viewing angles, erg s-1; for a restricted range of inclination angles in which the jet is close to the plane of the sky might be 1–2 orders of magnitude larger than erg s-1. However, this is clearly unlikely.
We can check the above estimate of the energy flux against the energy deposited in the inner lobes. The total energy deposited into the inner lobes by the restarted jets over time is,
| (13) |
where the factor allows for adiabatic losses; we adopt a nominal value of , which is typical of a non-thermal bubble inflated by a relativistic jet (e.g. Bicknell et al., 1997).
The SE inner lobe, which has a projected length of kpc in our VLA 6 cm image, has a minimum energy of erg. This leads to another expression for the jet energy flux:
| (14) |
where we have used the relation with kpc. This equation is also plotted as a function of inclination angle in Figure 16. The agreement between the two independent estimates of the energy flux is excellent for inclination angles . This is independent confirmation of our general assumption that the source is not within of the plane of the sky.
5.5.2 The outer lobes
The total minimum energy in the outer lobes of the Mpc-scale radio galaxy is erg. If we assume that the energy flux of the original jets is the same as that for the restarted jets, then we can also estimate the active lifetime and speed of advance of the old jets. Adopting and assuming that the original jets also have an energy flux of about 1–6 erg s-1 it follows that the old jets were active for 0.3–2 yr. Assuming that the lobes have not expanded significantly in the time since the first jets were switched off, this implies an advance speed in the range 0.01–0.06.
The advance speed of the original jets is therefore similar to the advance velocities inferred for jets in powerful radio sources (Scheuer, 1995): the similarity in advance speeds for giants and smaller size sources suggest that the effective hot spot areas are larger in giant sources, where the hot spots are farther away from the AGNs, compensating for the lower density media encountered by the jets in these sources.
Finally, we note that if the energy fluxes and efficiencies of the old and restarted jets are similar, then our analysis of the energy budget is consistent with an order of magnitude difference in hot spot speed in the two phases of radio galaxy evolution.
5.6 Restarting timescales
Suppose the first jet in PKS B1545321 turns off at ; then the hot spot at the extremity of the outer lobe is fed for a further time , where is the length of the old lobe. The hot spot then expands for a further time . Hence the current time is
| (15) |
Now suppose that the new jet turns on at and that the hot spot propagates for a distance at speed . This gives a second expression for the current time:
| (16) |
Hence, equating these two expressions
| (17) |
The condition that leads to the following condition on ,
| (18) |
In § 5.3, we computed for the relict hot spots, based on the external lobe densities derived in § 5.2. This value, together with , (assuming orientation near the plane of the sky) and , gives . This suggests that PKS B1545321 is observed at an inclination angle of at least 70∘ to the line of sight. In light of this result, together with the unreasonably high energy fluxes implied for extreme inclination angles (see § 5.5), we assume that PKS B1545321 is at an inclination angle , for the remainder of the discussion in this paper.
A final point on timescales relates to the time between cessation and renewal of jet activity, . Inserting numbers in equation (17) for and taking we have
| (19) |
From our estimate of , it follows that . Considering our estimate for the age of the Mpc-scale source in § 5.5.2, this implies that is at most a few percent of the source age.
5.7 The jet Lorentz factor
In this section we derive estimates of the jet Lorentz factor using the above estimates of hot spot velocity. First, we assume that as inferred in a number of radio jet sources (e.g. M87, Bicknell & Begelman, 1996, and Markarian 501, Bicknell et al. 2001). The value of this parameter in the cocoon, takes values between 20–90. This range is computed from the range of cocoon densities derived in section 5.2 for , along with the pressure at minimum energy conditions, dyn cm-2, in the external lobe.
For a relativistic jet propagating in a cocoon whose pressure is dominated by relativistic plasma, the advance velocity of the hot spots is given by
| (20) |
where
| (21) |
This equation is equivalent to equation (5) of Marti et al. (1997). Equation (20) is relevant when the jet is straight and its momentum flux is not spread over a larger area than the jet cross-section. This expression is therefore pertinent to the hypersonic jet model.
In order to use equation (20) to determine the jet Lorentz factor, we solve for to find:
| (22) |
In equation (21) for the jet density ratio, we cannot directly measure the pressure in the restarted jets. However, we assume that the restarted jets are in pressure equilibrium with the inner lobes, which have a minimum energy pressure of dyn cm-2. Thus, using the above estimates, we derive values of in the range 0.3–2; this range is consistent with the notion that the jets are evolving into a medium of similar density.
The inferred range of values, together with equation (22) for the jet Lorentz factor, imply that 2–3. Specifically, this if the restarted jets advance with hot spot velocities in the range , which are relevant to the likely range of inclination angles.
5.8 Entrainment
Here we consider the potential origin of the gas inside the relict cocoon and show that most of the gas must have been entrained. First we estimate the mass density of the non-thermal plasma, , that is deposited by the original jet into the outer lobes. This depends on the mass flux of the original jet, , the time for which the first jets were active, , and the volume of the pre-existing cocoon :
| (23) |
In this expression .
We assume that the original jets have the same mass flux as the restarted jets. Using our inferred inner jet diameter kpc (see §4.1) and an inner jet pressure that is equal to the minimum energy inner lobe pressure, dyn cm-2, we estimate g s-1 for the restarted jets, and therefore for the original jets.
Considering the one-sided volume of the outer radio lobes and an active timescale of yr (see §5.5), we obtain the following expression for the non-thermal mass density in the outer radio lobes,
| (24) |
Adopting and gives g cm-3. This represents a small fraction (between 0.7 and 4%) of the total cocoon density, which is in the range of , for inclination angles . Therefore, a substantial fraction of the mass density in the relict cocoon is IGM material ingested into the cocoon at the hot spot, and in instabilities along the contact discontinuity. At the same time the density in the cocoon is still less than the density of the IGM, which we estimate to be .
This calculation highlights the fact that entrainment of the external IGM into the outer radio lobes is indeed significant. Consequently, entrainment must play an important role in determining the evolution of the restarted jets in the relict synchrotron cocoons, as suggested by Kaiser et al. (2000) and as required by the theoretical interpretation given in this section.
6 Conclusions
The radio continuum images presented herein of the restarting radio galaxy PKS B1545321 show the interaction between the new jets and relict cocoon plasma with the highest sensitivity and resolution to date. Most remarkable is the detection of a straight 3.2-kpc diameter jet along the axis of the inner SE lobe, which has a diameter of 20 kpc. This jet is observed not as an emission feature, but as a decrement in total intensity, presumably owing to a Doppler dimming of its emission and/or a lack of accelerated particles prior to the jet plasma being shocked at the terminus.
We do not detect any evidence for bow shocks associated with the restarted jets external to the inner lobes in PKS B1545321. The Clarke et al. simulations predict that such features ought to be visible with a brightness comparable to the hotspots. The lack of such expected features, combined with the neat rims of emission at the ends of the inner lobes, lead us to propose that the boundary of the inner double is itself the bow shock of the restarting jet. Specifically, we suggest that the inner double lobes represent a mixture of relict cocoon material and new jet plasma that has been reaccelerated at the bow shock and terminal jet shocks respectively. It is along these lines that we also predict that there might exist giant radio sources which show no evidence for spectral aging along their axis, and that these sources may have recently restarted and had their entire cocoons reenergized via passage through a bow shock. Indeed, the classic discrepancy between dynamical and spectral ages in radio sources might be due to restarting.
There are a number of observational features that support our above interpretation of the inner lobes in PKS B1545321: (1) As mentioned already, we have detected and resolved relatively bright emission peaks at the ends of the inner double together with rims of emission along the boundary. This morphology is uncharacteristic of classic hot spots which usually protrude beyond the associated lobe. These rims appear to be consistent with the emission from bow shocks propagating into the background non-thermal plasma. (2) The magnetic field is aligned with the rims of the inner lobes consistent with the alignment of magnetic field in a bow shock. (3) Local minima in the polarization of the inner lobes are coincident with or adjacent to the brightest features. Again, this is uncharacteristic of normal hot spots. We propose that these features are the result of the superimposed emission from moderate strength Mach disks and bow shocks, with mutually perpendicular magnetic fields, which we expect from supersonic jets terminating in relativistic cocoon material that is light compared to the normal IGM.
In addition, we have performed a number of detailed dynamical calculations, which together with the new radio continuum images, support the view that the evolution of the new jets in the Mpc-scale lobes is unusual. We summarise these as follows and also note that each point is consistent with the above interpretation of the inner lobes as representing both bow shocks and new jet material:
-
1.
The emission peaks at the ends of the inner lobes have a substantially lower surface brightness compared to that observed in the hotspots of powerful radio galaxies. This is indicative of the jets terminating in a low density environment.
-
2.
Treating the arm length asymmetry in the inner lobes as the result of time retardation, we have deduced mildly relativistic hot spot velocities in the range for the inner lobes, consistent with the propagation of the jets in a low density environment, but not as low as expected from pristine jet material.
-
3.
By considering the hot spot dynamics we have deduced a density in the lobes which is less than the likely IGM density but which also exceeds the likely density produced by the original jets. The Mach number of the advancing hot spot is at least 5 with greater values possible if the minimum energy hot spot pressure is significantly exceeded.
-
4.
The hot spot Mach number inferred by associating the spreading rate of the SE inner lobe with the Mach angle is approximately 23.
-
5.
Consideration of the timescales related to the expansion of the relict hot spots and the propagation of the new hot spots provide a lower limit on the advance speed () which is consistent with the range of velocities quoted above
The standout discrepancy in the above is between the two estimates of the Mach number and we have advanced three possible explanations for this. The first is that the jet wanders slightly in its direction producing a broader working surface thereby decreasing the apparent Mach angle. The second is that the expansion of the inner lobes is further impeded by a density gradient toward the sides of the cocoon. The third is that the hot spot pressure significantly exceeds the minimum energy value. The first idea may imply that the velocity of advance of the jet is not constant as we have supposed. It is possible, for example, that the jet evolves according to the self-similar law for a constant background density in the models of Bicknell et al. (1997) and Kaiser & Alexander (1997). Against this is the apparent lack of self-similar spatial structure in the morphology of the inner lobes. The self-similar models imply that the ratio of the rate of lateral expansion to forward expansion is constant and the base of the lobes (nearest to the core) should therefore have expanded more than is apparent in the images. Moreover, unpublished simulations by us of restarting jets show that the new jet is relatively undeflected by the much lower density background medium of the pre-existing lobes. Nevertheless, it is possible that when adequately perturbed at the base such a jet may operate as a “dentist drill” but may not propagate as described by the self-similar models; this possibility deserves attention, but detailed investigation is beyond the scope of this paper.
There is support for the second idea that the jet may be affected by local density gradients, in the VLA and ATCA image in Figure 1. The extension of the trailing part of the NW inner lobe to the west indicates that the northern cocoon exerts a dynamical influence on the NW inner lobe. Also, the gradual curvature of the inner lobes points to a dynamical influence of the cocoon on the lobes. Further simulations of the interaction of a restarting jet with a pre-existing lobe should provide some valuable information on these issues.
Notwithstanding this discrepancy between the estimates of the Mach numbers of the hot spots, there are several other features of the observations and our analysis which are consistent with previous ideas on double-double radio sources. The deduction of mildly relativistic hot spot velocities is qualitatively consistent with the early models (Clarke & Burns, 1991; Clarke, 1997) although those models would predict velocities closer to the speed of light and fainter inner lobe emission. Therefore we find the notion by Kaiser et al. (2000), that entrainment of the surrounding IGM could decrease the sound speed in the cocoon, slow down the speed of advance of the inner doubles and make the inner lobe emission brighter, to be an appealing one.
The interruption to jet activity in PKS B1545321 has been brief. We have shown in §5.6 that given our estimates of cocoon density, it is likely that the interruption to jet activity has been no more than a few percent of the age of the whole source. This figure could be less than a percent for a source lifetime . How likely is it then that we would view this source at this stage in its lifetime? Effectively the time available for viewing a restarting jet is given by the travel time of the hot spot from the core to the extremity of the source in the notation of § 5.6. For the Northern lobe this is of order and this could be of the source age, which we have estimated as being . It is unsurprising therefore that double-double sources are relatively rare. Nevertheless, it would be of interest to examine the statistics of an unbiased sample of Mpc-scale radio galaxies to see if these sorts of fractional time estimates are appropriate.
Finally, we note that we have shown that the host galaxy is located at the boundary of a large scale filamentary structure, and shows blue patches in color distribution indicative of a recent merger, presumably a minor merger, and it may be that the merger event triggered the Mpc-scale radio galaxy. Dating the blue stellar populations that we have discovered in the host galaxy would be useful in estimating the time-delay between the merger and its influence on the emergence of the radio source. However, we should emphasize that the timescales we have estimated for the source switching off and then on again are not comparable to merger timescales and that one has to investigate other processes that would lead to such comparatively small time scales.
| Array | Frequency | Date | Duration |
|---|---|---|---|
| (MHz) | (hr) | ||
| BnA | 1384 | 2002 May 31 | 6 |
| BnA | 4910 | 2002 Jun 2 | 6 |
| CnB | 4910 | 2002 Sep 27 | 6 |

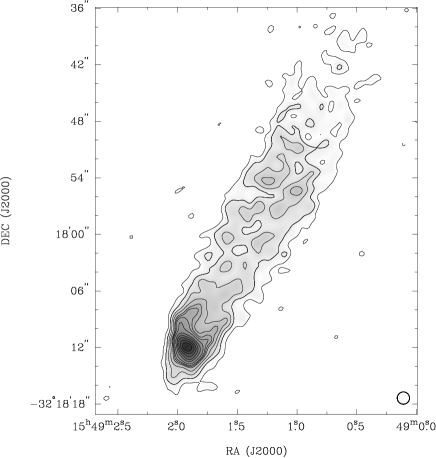
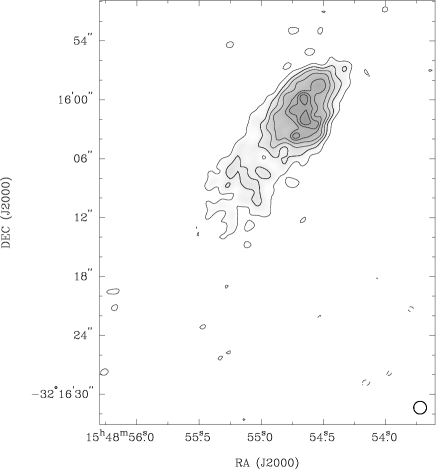
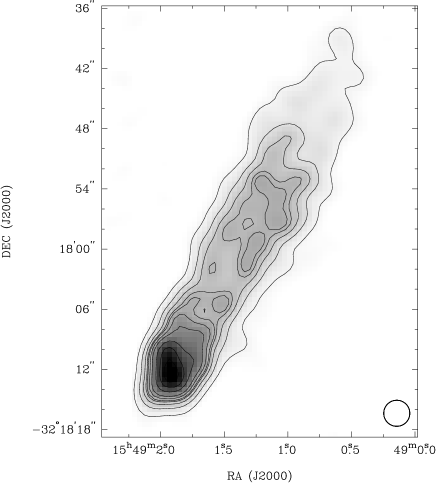
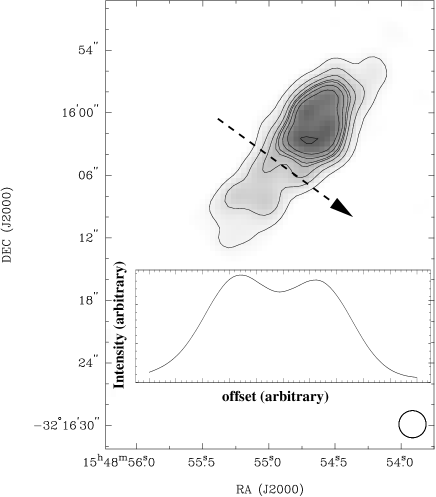
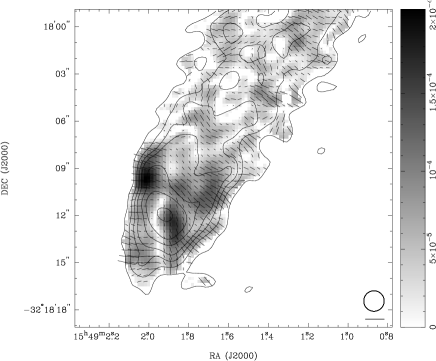
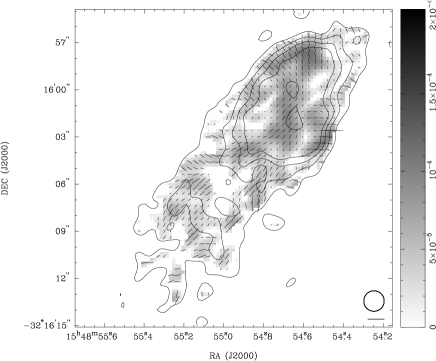
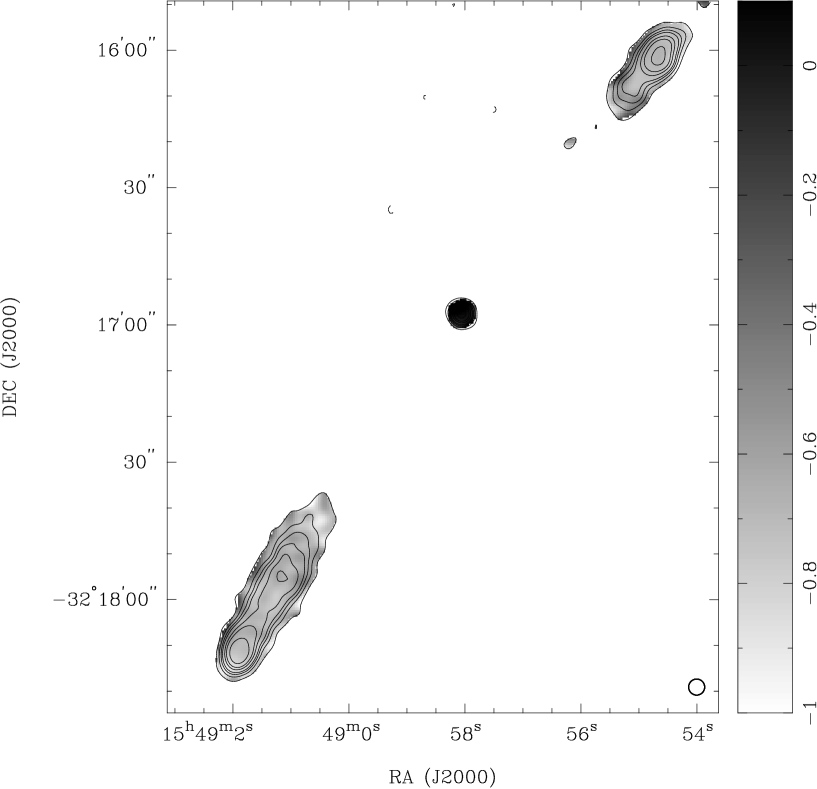


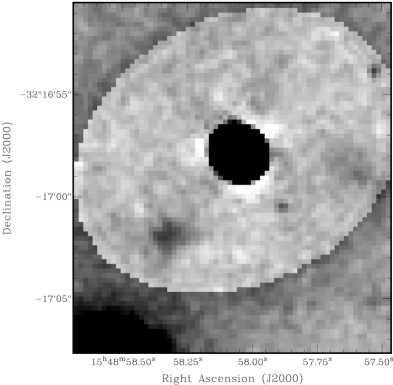
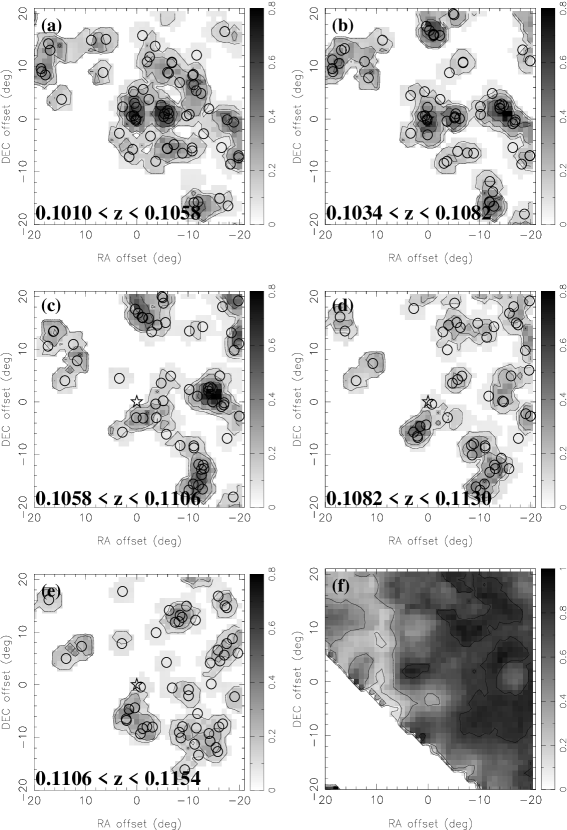


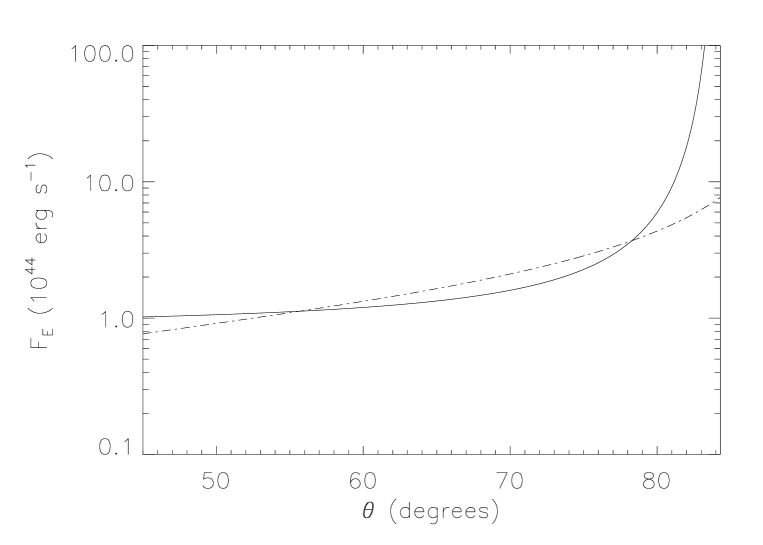
Appendix A Imaging combined VLA and ATCA datasets
Our VLA and ATCA 22 cm visibilities were combined and imaged using mosaic imaging techniques. The observations made by the individual telescopes were not mosaic observations, in which visibility data corresponding to multiple antenna pointings are acquired. Rather, the VLA and ATCA observations were both single pointing observations, and both observations used the same antenna pointing position. Nevertheless, it is necessary to treat the data specially while imaging because the antenna sizes differ in the two telescopes and, consequently the primary beams are different. Therefore, the sky source represented in the visibility data differ in the two telescopes, and sources offset from the pointing position have different primary beam attenuations.
The combined VLA and ATCA 22 cm image of PKS B1545321 shown in Figure 1, was computed in three separate steps, using the mosaic imaging, deconvolution and restoration tasks available in the MIRIAD package. Firstly, a linear mosaic of the 22 cm VLA and ATCA visibilities was performed using task INVERT. After converting the ATCA linear and VLA circular polarization measurements into Stokes parameters, the routine images the two pointings (visibility datasets) separately and then combines the resulting dirty images in a linear mosaic process. Pixels in the individual images are weighted to correct for the primary beam attenuation, as well as to minimize the noise in the combined image. Specifically, the resultant dirty image that is output by INVERT, , is given by
| (25) |
(Sault et al., 1996) where the summation, , is over the pointing centers . The parameter refers to the image formed from the ’th pointing and is the primary beam pattern for the corresponding telescope. is a weighting factor, which ensures that the noise at each mosaic pixel does not exceed a particular threshold value. In the case considered here, the pointing centers refer to the individual ATCA and VLA observations and the weighting function, , within the region of the mosaic containing PKS B1545321. Therefore, the attenuation due to the VLA and ATCA primary beams is totally corrected for over this area.
In addition to creating the combined dirty image, INVERT outputs a data cube containing the dirty sythesized beam patterns and primary beam models for each pointing. This enables the true point spread function, which is essentially a linear mosaic of the individual synthesized beam patterns, to be computed at any position in the image during the deconvolution stage.
In the second step, the MIRIAD routine MOSMEM (Sault et al., 1996) was used to perform a joint maximum entropy deconvolution of the 22 cm mosaiced dirty image. For each pointing, the routine multiplies the relevant primary beam with a prospective global model of the sky and then convolves the product with the dirty beam for that pointing. The dirty images are then linearly mosaiced together, and subtracted from the combined dirty image, to form the residuals. Through this process, the position-variant point spread function of the linear mosaic is accounted for.
In the final step, the global sky model and deconvolution residuals, as determined by MOSMEM, were input to the MIRIAD task RESTOR to compute a clean image. RESTOR convolves the global model with a constant Gaussian CLEAN beam (a beam that is not a function of position) and then folds the residuals into the result. The actual point spread function was calculated at various positions in the linear mosaic; these were found to be fairly constant with parameters similar to that of the synthesized VLA beam. Therefore, we let RESTOR follow the default approach, which is to convolve the model with a CLEAN beam whose parameters are determined by fitting to the synthesized beam of the first pointing; this was the VLA pointing in our case.
Appendix B Dissipation timescale for a hot spot
If the beams from the central engine stop abruptly, and the last jet material passes through the hot spots at the ends of radio lobes, the hot spots will dissipate into the surrounding lobe. In this section we estimate the dissipation timescale assuming that the hot spots are spherically symmetric and the expansion is adiabatic.
Let the initial and final radii, pressures and rest mass particle densities within the hot spots be and , , , and , respectively. The thermal particle density in the external lobe is denoted by . Assuming that the expansion of the hot spot, with speed , is ram pressure confined as a result of the entrained thermal gas in the external lobe,
| (26) |
Since is a constant in the expansion, which we assume is adiabatic,
| (27) |
where is the adiabatic index of the relativistic gas within the expanding hot spot. It follows that
| (28) |
The expansion velocity is then
| (29) |
Denoting by ,
| (30) |
This equation has the solution,
| (31) |
which may be rearranged to give an expression for the expansion time :
| (32) |
Appendix C Estimate of jet energy flux, for a restarted jet, from hot spot parameters
In this section we use the momentum balance at the end of the hot spot to express the jet energy flux in terms of the observable parameters of the hot spot and the density of the cocoon.
As in the body of this paper, we let be the ratio of jet speed to the speed of light as measured in the rest frame of the host galaxy, is the corresponding Lorentz factor, is the cross- sectional area of the jet. , and are the corresponding parameters for the hot spot. is the density of the cocoon surrounding the restarted jet. We also allow for the fact that near the working surface the momentum flux may be spread over a wider area than the instantaneous jet cross-section either as a result of the jet direction changing or the flow dynamics in the vicinity of the working surface.Hence the cross-sectional area of the hot spot .
We denote the jet speed and corresponding Lorentz factor in the frame of the contact discontinuity, or hot spot, by additional subscripts: ‘hs’. In the frame of the hot spot, momentum balance gives:
| (33) |
Lorentz transformation yields a relationship between parameters in the frame of the host galaxy to that in the frame of the hot spot:
| (34) |
and the momentum balance equation reads
| (35) |
where .
The energy flux in the relativistic beam is given by:
| (36) |
Dividing this equation by equation (35) gives the following expression for the energy flux:
| (37) |
For even modest Lorentz factors for the jet, the leading factor in square brackets is close to unity, irrespective of the value of . Additionally, is close to unity. Hence this expression may be used to estimate the jet energy flux in terms of the hot spot speed, hot spot area and cocoon density.
References
- Baars et al. (1977) Baars J. W. M., Genzel R., Pauliny-Toth I. I. K., Witzel A., 1977, A&A, 61, 99
- Bicknell (1994) Bicknell G. V., 1994, ApJ, 422, 542
- Bicknell & Begelman (1996) Bicknell G. V., Begelman M. C., 1996, ApJ, 467, 597
- Bicknell et al. (1997) Bicknell G. V., Dopita M. A., O’Dea C. P., 1997, ApJ, 485, 112
- Bicknell et al. (2001) Bicknell G. V., Wagner S. J., Groves B. A., 2001, in Laing R. A., Blundell K., eds, The Oxford Radio Galaxy Workshop Information on particles and fields in parsec and sub parsec scale jets. Astronomical Society of the Pacific, pp in press, astro–ph 0102XXX
- Bridle & Perley (1984) Bridle A. H., Perley R. A., 1984, Ann. Rev. Astr. Astrophys., 22, 319
- Cen & Ostriker (1999) Cen, R. & Ostriker, J. P. 1999, ApJ, 514, 1
- Clark (1980) Clark B. G., 1980, A&A, 89, 377
- Clarke (1997) Clarke D. A., 1997, in ASP Conf. Ser. 123: Computational Astrophysics; 12th Kingston Meeting on Theoretical Astrophysics A Restarting Jet Revisited: MHD Computations in 3-D. p. 255
- Clarke & Burns (1991) Clarke D. A., Burns J. O., 1991, ApJ, 369, 308
- Croston et al. (2005) Croston J. H., Hardcastle M. J., Harris D. E., Belsole E., Birkinshaw M., Worrall D. M., 2005, ApJ, 626, 733
- Davé et al. (2001) Davé, R., et al. 2001, ApJ, 552, 473
- Hardcastle (2003) Hardcastle M. J., 2003, New Astronomy Reviews, 47, 649
- Hardcastle et al. (1997) Hardcastle M. J., Alexander P., Pooley G. G., Riley J. M., 1997, MNRAS, 288, 859
- Hardcastle et al. (1998) Hardcastle M. J., Alexander P., Pooley G. G., Riley J. M., 1998, MNRAS, 296, 445
- Hardcastle et al. (2004) Hardcastle M. J., Harris D. E., Worrall D. M., Birkinshaw M., 2004, ApJ, 612, 729
- Jedrzejewski (1987) Jedrzejewski R. I., 1987, MNRAS, 226, 747
- Jones et al. (2006) Jones D. H., Peterson B. A., Colless M., Saunders W., 2006, MNRAS, 369, 25
- Jones et al. (2004) Jones D. H., Saunders W., Colless M., Read M. A., Parker Q. A., Watson F. G. e. a., 2004, MNRAS, 355, 747
- Jones et al. (2005) Jones D. H., Saunders W., Read M., Colless M., 2005, Publications of the Astronomical Society of Australia, 22, 277
- Kaiser & Alexander (1997) Kaiser, C. R. & Alexander, P. 1997, MNRAS, 286, 215
- Kaiser et al. (2000) Kaiser C. R., Schoenmakers A. P., Röttgering H. J. A., 2000, MNRAS, 315, 381
- Königl (1980) Königl A., 1980, Phys. Fluids, 23, 1083
- Leahy et al. (1997) Leahy J. P., Black A. R. S., Dennett-Thorpe J., Hardcastle M. J., Komissarov S., Perley R. A., Riley J. M., Scheuer P. A. G., 1997, MNRAS, 291, 20
- Marti et al. (1997) Marti, J. M. A., Mueller, E., Font, J. A., Ibanez, J. M. A., & Marquina, A. 1997, ApJ, 479, 151
- Miley (1980) Miley G. K., 1980, Ann. Rev. Astr. Ap., 18, 165
- Owen (1993) Owen F. N., 1993, in Roser H.-J., Meisenheimer K., eds, Jets in Extragalactic Radio Sources Vol. 421 of Lecture Notes in Physics, Steps towards a radio hr diagram. Springer-Verlag, Heidelberg, p. 273
- Perley et al. (1997) Perley R. A., Röser H. J., Meisenheimer K., 1997, A&A, 328, 12
- Saikia et al. (2006) Saikia D. J., Konar C., Kulkarni V. K., 2006, MNRAS, 366, 1391
- Saripalli et al. (2002) Saripalli L., Subrahmanyan R., Udaya Shankar N., 2002, ApJ, 565, 256
- Saripalli et al. (2003) Saripalli L., Subrahmanyan R., Udaya Shankar N., 2003, ApJ, 590, 181
- Sault et al. (1996) Sault, R. J., Staveley-Smith, L., & Brouw, W. N. 1996, A&AS, 120, 375
- Scheuer (1982) Scheuer P. A. G., 1982, in Heeschen D. S., Wade C. M., eds, IAU Symposium 97, Extragalactic Radio Sources Reidel, Dordrecht, p. 163
- Scheuer (1995) Scheuer P. A. G., 1995, MNRAS, 277, 331
- Schoenmakers et al. (2000) Schoenmakers A. P., de Bruyn A. G., Röttgering H. J. A., van der Laan H., Kaiser C. R., 2000, MNRAS, 315, 371
- Simpson et al. (1993) Simpson C., Clements D. L., Rawlings S., Ward M., 1993, MNRAS, 262, 889
- Steer et al. (1984) Steer D. G., Dewdney P. E., Ito M. R., 1984, A&A, 137, 159
- Swain et al. (1996) Swain M. R., Bridle A. H., Baum S. A., 1996, in Hardee P. E., Bridle A. H., Zensus J. A., eds, ASP Conf. Ser. 100: Energy Transport in Radio Galaxies and Quasars The Jets in the Radio Galaxy 3C 353. ASP, San Francisco, p. 299