VLT photometry in the Antlia Cluster: the giant ellipticals NGC 3258 and NGC 3268 and their globular cluster systems††thanks: Based on observations carried out at the European Southern Observatory, Paranal (Chile). Program 71.B-0122(A).
Abstract
We present a deep VLT photometry in the regions surrounding the two dominant galaxies of the Antlia cluster, the giant ellipticals NGC 3258 and NGC 3268. We construct the luminosity functions of their globular cluster systems (GCSs) and determine their distances through the turn-over magnitudes. These distances are in good agreement with those obtained by the SBF method. There is some, but not conclusive, evidence that the distance to NGC 3268 is larger by several Mpc. The GCSs colour distributions are bimodal but the brightest globular clusters (GCs) show a unimodal distribution with an intermediate colour peak. The radial distributions of both GCSs are well fitted by de Vaucouleurs laws up to 5 arcmin. Red GCs present a steeper radial density profile than the blue GCs, and follow closely the galaxies’ brightness profiles. Total GC populations are estimated to be about GCs in NGC 3258 and GCs in NGC 3268. We discuss the possible existence of GCs in a field located between the two giant galaxies (intracluster GCs). Their luminosity functions and number densities are consistent with the two GCSs overlapping in projection.
keywords:
galaxies: individual: NGC 3258, NGC 3268 – galaxies: clusters: general – galaxies: elliptical and lenticular, cD – galaxies: star clusters – galaxies: photometry – galaxies: haloes1 Introduction
The Antlia galaxy cluster has long been overlooked in optical studies despite the fact that it is the nearest cluster after Virgo and Fornax, with a comparable number of members and total mass as the latter (Ferguson & Sandage 1990; Pedersen et al. 1997; Nakazawa et al. 2000). Its central part consists of two subgroups, each dominated by one of the giant elliptical galaxies NGC 3258 and NGC 3268. This particular structure makes it an even more interesting target, as evidence for interactions between the galaxies in the central cluster region may emerge. However, large differences in the radial velocities between NGC 3268 and several close and bright neighbours suggest a considerable structural depth. We have performed the first CCD study of the stellar population in NGC 3258 and NGC 3268 (Dirsch, Richtler & Bassino 2003a, hereafter Paper i), where the existing literature on the Antlia cluster is summarized.
Afterwards, our study of the galaxy content of this cluster (Smith Castelli et al. 2007), revealed the presence of numerous low surface brightness galaxies, that had not been identified in a former photographic search carried out by Ferguson & Sandage (1990).
In Paper i, the luminosity and colour profiles of NGC 3258 and NGC 3268, and of their globular cluster systems (GCSs), were studied on the basis of wide-field Washington photometry. Both GCSs show bimodal colour distributions, but small number statistics prevented the detection of any difference between the radial profiles of the two globular cluster (GC) subpopulations. Unfortunately, these data were not deep enough to reach the turn-over magnitudes of the respective GCS luminosity functions, which can be used as distance indicators, and it was not possible to estimate new distances. The SBF distances determined by Tonry et al. (2001) are the only ones available, besides a distance estimation via the Hubble flow (Hopp & Materne 1985).
A recent study of GCSs in eight brightest cluster galaxies by Harris et al. (2006) includes both Antlia ellipticals. On the basis of () photometry obtained with the ACS/WFC camera from the Hubble Space Telescope (field of view of arcmin2), they focus on the two-colour data and metallicity distributions. Harris et al. confirm our results from Paper i that the GC colour distributions in these Antlia galaxies are bimodal. They found a trend in the sense that brightest blue GCs seem to become redder with increasing luminosity. With regard to the radial projected distribution, Harris et al. also show that red GCs are more centrally concentrated than blue ones.
In this new investigation with VLT data, we determine GC luminosity functions (GCLFs) and, through their turn-overs, the distance estimates for the dominant Antlia ellipticals. We study the characteristics of the different GC subpopulations in each galaxy, and compare them to the galaxies’ light profiles. The total GC populations are also calculated. In addition, the GCSs near the giant elliptical galaxies are compared to the cluster population in a field further away, about 100 kpc from both galaxies (the ‘intracluster’ field). One goal of this comparison is to search for intracluster GC candidates, i.e., GCs that may be unbound to a parent galaxy, but are instead moving freely in the potential well of the cluster (e.g. West et al. 1995).
This paper is organized as follows: Section 2 describes the observations, the adopted criteria for the GC candidates’ selection, and the completeness and reddening corrections. In Section 3 we analyse the results from the four observed fields and perform the distance calculations. Section 4 deals with the galaxies’ properties, and Sections 5 and 6 with those of their GCSs. A discussion of the results is presented in Section 7 and, lastly, the conclusions and a summary are provided in Section 8.
2 Observations and reductions
2.1 Observations
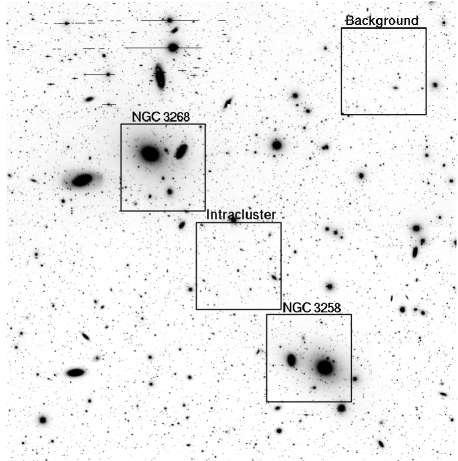
Bessel and imaging was obtained for four fields in the Antlia cluster during 2003 March 27–28, with FORS1 at the VLT UT1 (Antu) telescope (Cerro Paranal, Chile). This camera is equipped with a pixels2 CCD chip, which provides an image scale of 0.2 arcsec pixel-1 and a field of view of arcmin2 (about kpc2 at the Antlia distance).
The positions of the fields are shown in Fig. 1 and basic data are listed in Table 1. The labels of the fields (see Fig. 1) were selected as follows: ‘NGC 3258’ and ‘NGC 3268’ for those that are located on the dominant galaxies, ‘intracluster’ for the field placed in between them, and ‘background’ for the field located close to the border of the MOSAIC field, used to correct for the contamination by the background. For the four fields, three images with exposure times of 100 / 200 s each plus five images with exposure times of 300 / 700 s each were obtained in the / bands, respectively. In all cases, short exposures of 10 s were also taken to avoid saturation problems. The seeing was excellent (Table 1).
| Field | RA(J2000) | DEC(J2000) | Date | Seeing | |
|---|---|---|---|---|---|
| NGC 3258 | 3/27/2003 | 0.084 | |||
| NGC 3268 | 3/27/2003 | 0.101 | |||
| Intracluster | 3/28/2003 | 0.090 | |||
| Background | 3/28/2003 | 0.091 |
2.2 Photometry and point sources selection
The photometry has been done with DaoPhot ii within IRAF, with the tasks DAOFIND, PSF and ALLSTAR. In the final and images, a second order variable PSF was derived using an average of 30 evenly distributed stars per frame. The aperture corrections were estimated for each field and each band. The point sources selection was performed using the and sharpness parameters calculated by ALLSTAR.
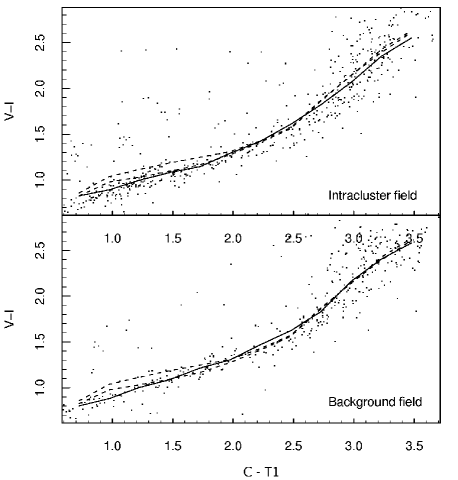
The first night, in which NGC 3258 and NGC 3268 were observed, was photometric and the data was calibrated with the zero-points, airmasses and colour coefficients provided by the European Southern Observatory (ESO). As standard stars used by ESO are taken from Landolt (1992), we obtain magnitudes and colours in the Johnson/Cousins system. For the second night, no zero-point is given and the flux measurements (available on the ESO-Web site) indicated possible presence of clouds until 2 UT. Our observations started at 3:25 (‘intracluster’ field) and 5:32 (‘background’ field), respectively. Hence, it is highly probable that the night has been photometric during this time, so we applied the same zero-points as for the first night (the daily scatter of the zero point is relatively small). The quality of this latter ‘calibration’ can be quantified using the Washington () photometry from Paper i: the two colour diagrams () vs. () are shown in Fig. 2 for the point sources in the ‘intracluster’ and the ‘background’ fields. The median values, indicated by solid lines, are compared with those from the NGC 3258 and NGC 3268 fields shown with the dashed lines. In the colour range the point sources are dominated by foreground stars that have identical characteristics in all four fields. No shift that would indicate a photometric-zero point difference can be seen in this colour range. The differences for are due to the presence/absence of GCs and their different properties in the different fields. Similarly, the photometric calibration of the filter has been checked with a () vs. () diagram (not shown), resulting in the same conclusions.
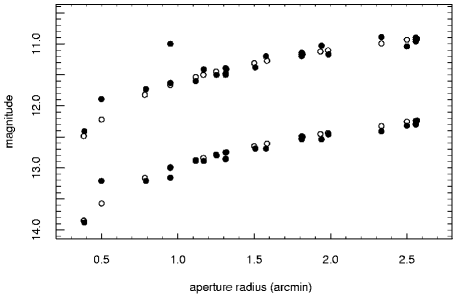
The absolute calibration of the first night has been checked using the galaxy aperture photometry for NGC 3258 and NGC 3268 compiled by Prugniel & Siemen (1996). It is shown for NGC 3268 in Fig. 3. The difference of the means are , and (negative values mean that our measurements are brighter/bluer). For NGC 3258 we find: , , . The overall agreement is good, however, we measure the galaxies about 0.05 mag bluer in ().
We modeled the galaxy light of the two ellipticals with the ELLIPSE task within the IRAF/STSDAS/ISOPHOTE package (Jedrzejewski 1987). Since the fields are rather crowded, we first masked the brightest stars by hand and then used five iterations with a 3 clipping. This procedure can lead to an underestimation of the total surface brightness, however, the main goal was to obtain a good fitting galaxy model, that characterizes the radial profile, the ellipticity and the position angle (see Section 4).
2.3 Completeness
We performed a standard completeness test by adding artificial stars, based on the PSF and uniformly distributed, to the four images. We then determined the probability that these stars were retrieved in an analysis analogous to the one performed on the pure science images. We found that the completeness does not vary within the colour range relevant for the GCs (). It is however, spatially dependent: the completeness limit is lower for areas nearer to bright galaxies. This effect is considered later-on.

When one compares the completeness curves shown in Fig. 4 with the colour-magnitude diagrams in the next section, a discrepancy becomes apparent, particularly in the NGC 3258 and ‘intracluster’ fields. The completeness appears to be dropping faster in these observed fields compared to the prediction of the completeness calculations. For further illustration, we refer to Fig. 5 in which the result of the completeness calculation in that field is compared to the true (shifted in = 1.5) colour-magnitude diagram. It appears that the fraction of faint artificial stars is higher than that of the true ones. We have no final explanation for this difference. However, the artificial stars are not concentrated towards the galaxies, so they will on the average have a lower underlying surface brightness and thus will be more sensitive to incompleteness effect than the real GCs. We want to emphasize that the shape of the completeness curve for low luminosities is mainly determined by the used and sha point source selection criteria. These criteria have been adjusted using the completeness calculations, but apparently true stars in the NGC 3258 field behave worse when the PSF is fit than the artificial stars. We want to note that a similar apparent difference can also be seen in other works, e.g. Ostrov, Forte & Geisler (1998).
Due to this uncertainty, we will only use objects brighter than the limit set by an 70 per cent completeness for the analysis of the GCLFs. Despite this cautious approach, we are reaching at least 1.5 mag deeper than in Paper i.

2.4 Reddening correction
We use a conversion factor of (Stanek 1996; Dean, Warren & Cousins 1978) and the adopted values for are listed in Table 1. We want to emphasize that the later conversion factor is adequate for a Kron-Cousins filter. Later-on we also compare our results to those obtained with Washington photometry (Paper i); for this system the conversion factor is (Harris & Canterna 1977).
It can be seen from Table 1 that the reddening towards the different fields varies from to 0.10, which corresponds to a range in . As already stated in Paper i, the IRAS map towards the Antlia cluster is very patchy. In the present work, we are using smaller fields than in Paper i so we will apply reddening corrections according to the individual values listed in Table 1. However, these reddening uncertainties should be kept in mind when comparing results between the different fields.
3 The four fields compared
3.1 Colour-magnitude diagrams and colour distributions
The colour-magnitude diagrams (CMDs), corrected by reddening, of the point sources in the four fields are shown in Fig. 6. The GCs are found in the colour range . It is already discernible that NGC 3268 has a larger fraction of red clusters than NGC 3258, that extend to redder colours. In the ‘intracluster’ field mainly blue GCs are detected.


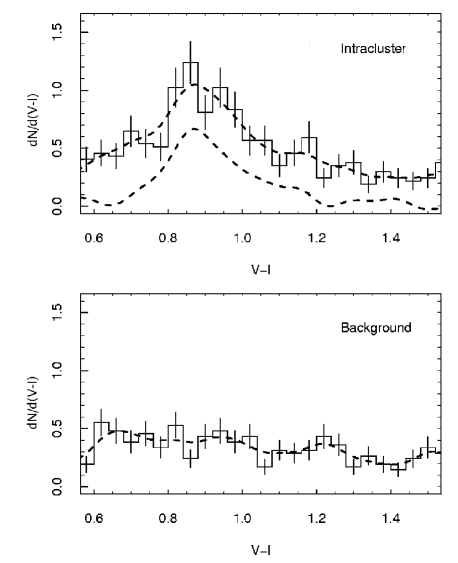
The (reddening corrected) colour distributions of the points sources brighter than = 25.7 are shown in Fig. 7 for the four fields, with different vertical scales. The mean colour of the GCs in NGC 3258 is bluer than of those in NGC 3268, which can also be seen in Fig. 6 and in () (Paper i). In Paper i a bimodal colour distribution was clearly discernible for the GCSs of both elliptical galaxies. It is not as apparent in these new observations, due to the roughly two times lower metallicity sensitivity of the () colour compared to the () colour, though bimodality is already visible in Fig. 6. A KMM test based on the code of Ashman, Bird & Zepf (1994) gives -values smaller than 0.001 for the colour distributions of both GCSs. These low -values indicate that two Gaussians give a better fit the colour distributions than a single Gaussian. The bimodality in both GCS colour distributions is also clearly established by the () colour histograms depicted by Harris et al. (2006) in their fig. 9. The results of a two-Gaussian fit, based on a nonlinear least-squares code, are tabulated in Table 2. We recall that, in massive early-type galaxies, the most common values are and for the blue and red peaks, respectively (Larsen et al. 2001, see also Kundu et al. 2001).
| Blue population | Red population | |||||
|---|---|---|---|---|---|---|
| Fraction[per cent] | Peak colour | Width | Fraction[per cent] | Peak colour | Width | |
| NGC 3258 | ||||||
| NGC 3268 | ||||||
The total fraction of red GCs that we obtain is per cent in NGC 3258, and per cent in NGC 3268. Rhode & Zepf (2001, 2004) found proportions of per cent of red GCs in their wide-field studies of NGC 4427 and NGC 4406, respectively. With regard to the ‘intracluster’ field, we only fit one Gaussian to the data and find for the peak position and the width, respectively.
In our studies on GCSs of the Fornax cluster galaxies (Dirsch et al. 2003b; Bassino, Richtler & Dirsch 2006b), we have found that the limit between blue and red GCs is at . By means of the comparison vs. depicted in Fig. 2, we estimate this colour limit as , that will be adopted in the rest of this paper and agrees with the one used by Larsen et al. (2001).
3.2 The luminosity functions
The luminosity functions (LFs) of all objects in the cluster colour range () are plotted for each of the four fields in the upper panel of Fig. 8 while the completeness corrected and background subtracted LFs are shown in the lower panel. In the following discussion we will only consider the GCLFs up to a limiting magnitude where the completeness is higher than 70 per cent, which is =25.7 for NGC 3258 and the ‘intracluster’ fields. The NGC 3268 and the ‘background’ fields are deeper (70 per cent completeness is reached at =26 and =25.9, respectively) but, as a background correction is required for the further analysis, only point sources brighter then =25.9 in the NGC 3268 field will be used.
For an old cluster system the LF, when counted in magnitudes, is usually close to a Gaussian. The peak value – turn-over magnitude (TOM) – corresponds to a peak in the mass distribution when counted in logarithmic bins, which has been found to be universal for old cluster populations. Therefore, the GCLF can be employed for distance determinations. Jordán et al. (2007) have performed the largest study of GCLFs in early-type galaxies to date (see also Jordán et al. 2006), within the ACS Virgo Cluster Survey. They have fitted two models to the LFs: a Gaussian, that is the standard model, and an “evolved Schechter function” that takes into account the dynamical processes that destroy the GCs, particularly the low-mass ones. Jordán et al. have shown that for bright galaxies both functions provide similar good fits while the largest differences arise at the low-mass (low-luminosity) end of the GCLF of faint galaxies. In our case, we are dealing with bright galaxies and do not reach the low-mass end of the LFs, so it seems seem appropriate to use Gaussian functions to describe the GCLFs. Furthermore, a t5 function has also been used to fit GCLFs (e.g. Richtler 2003; Harris 2001) but, as no systematic differences in the TOMs have been reported when using these functions instead of Gaussians (Larsen et al. 2001), we finally adopt the Gaussian model to fit the histograms, with bins of 0.15 mag.
Several studies revealed that red and blue cluster populations have different TOMs ( M 87: Elson & Santiago 1996; Kundu et al. 1999; Jordán et al. 2002, NGC 4472: Puzia et al. 1999, sample of 15 early type galaxies: Larsen et al. 2001, M 104: Spitler et al. 2006) which is mainly due to the metallicity dependent mass-to-light ratio (Ashman, Conti & Zepf 1995). Hence, we study the GCLFs of the total, the red and the blue GC populations.
In the lower panel of Fig. 8 a TOM can be clearly seen for NGC 3258 and the ‘intracluster’ field. For NGC 3268 the situation is slightly more complicated but, as it is the deepest image, a TOM can be also estimated for NGC 3268. The results are tabulated, for three radial subsamples, in Table 3. For the ‘intracluster’ field no TOM for a red subsample has been determined due to poor number statistics.


As can be seen from Table 3, the results for the red GCs show larger errors, particularly in the outer radial subsample () where, as will be shown in Sections 5 and 6, these clusters are less numerous. The determined TOMs are radially independent within the errors, as has already been shown in other galaxies (M 87: McLaughlin 1994; Harris, Harris & McLaughlin 1998; Kundu et al. 1999; Jordán et al. 2007, the Milky Way: Harris 2001, M 49: Jordán et al. 2007). However, the TOMs depend on the colour of the GC sample: blue GCs have a brighter TOMs than red ones. Therefore, the red TOMs are also much poorer defined because of their faintness. The difference between the red and the blue TOMs, calculated with the results from the inner radial subsample where the red TOMs are better defined, is for NGC 3258 and for NGC 3268. These differences agree, within the errors, with those reported by Larsen et al. (2001), but they are not accurate enough (particularly due to the errors in the red TOMs) to drive further conclusions.
| All GCs | Blue GCs | Red GCs | |||||
| Radial range | -TOM | -TOM | -TOM | ||||
| NGC 3258 | |||||||
| NGC 3268 | |||||||
| Intracluster | |||||||
3.3 The distances towards NGC 3258, NGC 3268 and the ‘intracluster’ field GCs
In order to determine distances to the galaxies, we use the TOMs of the entire GC populations, estimated over the whole radial range, and adopt as universal absolute TOM . This universal TOM was determined by Richtler (2003), as a weighted average of the TOMs of the Milky Way and M31 (Harris 2001; Barmby, Huchra & Brodie 2001, respectively). It is quite similar to the TOM recently derived for the Milky Way GCLF by Jordán et al. (2007) ().
Here are our results, where the errors in the distance moduli include the errors of the Gaussian fittings and the adopted universal TOM:
For NGC 3258 and NGC 3268 Tonry et al. (2001) determined distance moduli of
and , respectively, which agree well with our
measurements.
With regard to the GC population located in the ‘intracluster’ field, mainly blue GCs (see Fig. 7), it seems more interesting to calculate its distance relative to both giant galaxies than to obtain an absolute estimation. Such relative distance may be estimated comparing the TOMs that are calculated using only blue globulars, over the whole radial range. These TOMs, depicted in Table 3, are =24.81, 25.06, and 24.87 for the NGC 3258, NGC3268 and ‘intracluster’ fields, respectively. Assuming an universal absolute TOM for the blue GC population too, the distance to the GCs of the ‘intracluster’ field is in the middle of those of the galaxies, further than NGC 3258 but closer than NGC 3268.
Summarizing, we find that NGC 3268 seems to be further away than NGC 3258 and that the TOM of the ‘intracluster’ field GCs suggests that they are located in between both galaxies, as expected if most of the GCs in the ‘intracluster’ field are part of both galaxies GCSs.
As a consequence of the uncertainties, particularly with regards to the reddening towards the Antlia cluster, in the following we will keep a conservative value of 30 Mpc for the distance to the Antlia cluster (one arcminute will correspond to 8.7 kpc).
4 The stellar bodies of NGC 3258 and NGC 3268
We have modeled the light of the two elliptical galaxies, as stated above, by means of the ELLIPSE task within IRAF. The variations of the ellipticity and the position angle PA against the semi-major axis, which result from the fits, are shown in Fig. 9 and Fig. 10 for NGC 3258 and NGC 3268, respectively.


From Fig. 9 we can see that the ellipticity of NGC 3258, in both and bands, shows a slight decline close to the center, and increases outwards from at 0.5 arcmin up to at about 2 arcmin. The position angle of the major-axis obtained from the isophotal analysis decreases from 75°close to the center down to 55°at about 2 arcmin, with a clear peak around 0.8 arcmin which is more evident in the band. The behaviour of both parameters, and PA, are in good agreement with the photometry performed by Reid, Boisson & Sansom (1994) and with our previous results from Paper i.
With regard to NGC 3268 (Fig. 10), the ellipticity increases steadily from at 0.1 arcmin to at about 2 arcmin, in both and bands. The same results were obtained by Reid et al. (1994) while in the model from Paper i the ellipticity is constant out to 2.5 arcmin. The position angle remains almost constant, oscillating between 65°and 70°through the same radial extension, in agreement with both previous studies.
At the centres of both galaxies, there are small dust lanes that can be interpreted as dusty disks. The dusty disk of NGC 3268, with a diameter of 4.4 arcsec, has already been mentioned in Paper i. The smaller one in NGC 3258, with a diameter of 1.8 arcsec, was not visible in the MOSAIC data, but has been detected by De Bruyne et al. (2004).
5 The GCS of NGC 3258
5.1 Radial distribution
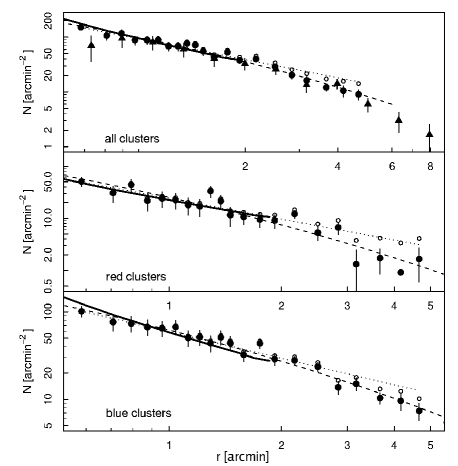
The radial density profiles of all GCs, the red (), and the blue () ones, are shown in Fig. 11 for the GC candidates in NGC 3258 brighter than =25. Hence, as the TOM for all GCs is around =25, the number density gives approximately half the total cluster density. In all cases, the errors of the background-corrected distributions include the Poisson uncertainties of the raw and background counts, and the effect of the incompleteness. The profile obtained from the MOSAIC data has been included in the upper panel, together with the VLT ones, as an additional check of the consistency between both observational sets. Typically GC density profiles are either fitted by power-laws () or de Vaucouleurs profiles (). Both fits are plotted in Fig. 11, which shows that de Vaucouleurs profiles provide better fits for all the GC selections. All the fits were performed within the range 0.5–5 arcmin and the results are depicted in Table 4.
The exponents of the power-law and de Vaucouleurs fits show that the red clusters present a steeper radial profile than the blue clusters, being more concentrated towards the centre. A similar result, in the sense that a de Vaucouleurs profile provides a better fit, has been found for other giants like, for instance, NGC 4406 (Rhode & Zepf 2004) and NGC 4472 (Rhode & Zepf 2001) in Virgo, or NGC 1399 (Bassino et al. 2006a) in Fornax.
The radial density profile for the red clusters depicted in Fig. 11, has a rather constant and low density for r 3 arcmin (1.4 GCs arcmin-2, i.e., about 50 per cent of the background level estimated for the red GCs color range), suggesting that it is close to reach an end, while the blue clusters clearly extend further than the NGC 3258 field.
We have modeled the light of the two elliptical galaxies, as stated above, by means of the ELLIPSE task within IRAF. The galaxy light profile included in the plots is hardly distinguishable from the radial density profile for all and red GCs, while slight differences are detectable with respect to the blue cluster profile.
| power-law | de Vaucouleurs | |
|---|---|---|
| NGC 3258 | ||
| all clusters | ||
| red clusters | ||
| blue clusters | ||
| NGC 3268 | ||
| all clusters | ||
| red clusters | ||
| blue clusters |
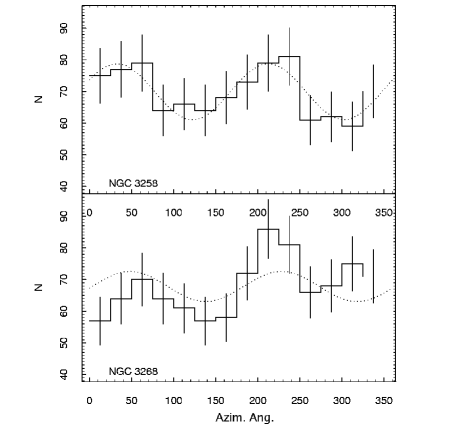
5.2 Azimuthal distribution
The ellipticity of the GCS can be determined studying the azimuthal density distribution of GC candidates with respect to the azimuthal angle, that is, a position angle measured from north to east. An elliptical GCS causes sinusoidal counts in this diagram: the ellipticity and the number density along the major and the minor axis () are related via , where is the exponent of the radial density distribution ().
In the upper panel of Fig. 12 the azimuthal distribution of the NGC 3258 GCS is shown for clusters within 0.5–2 arcmin. A sinusoidal fit to the data results in an ellipticity and a PA of the major axis , which are in excellent agreement with those obtained in Paper i.
5.3 Colour distribution
We have shown that red and blue clusters have different radial distribution, hence the colour distribution shows a radial dependence which is shown in Fig. 13. In particular, the presence of red GCs is less noticeable in the outer cluster sample. We have fitted two Gaussians to the histogram data. We find for the inner sample ( arcmin):
and for the outer sample ( arcmin):
No radial dependence of the peak positions can be observed up to our limit in galactocentric radius, that is, about 45 kpc. This result is consistent with the observations in other ellipticals within similar radial ranges (Larsen et al. 2001; Rhode & Zepf 2001; Dirsch, Schuberth & Richtler 2005). In this way, the radial dependence of the colour distribution may be basically explained by the different proportions of the blue and red subpopulations.

We have also tested the colour distribution within different luminosity ranges: bright (), intermediate () and faint () samples (the figure is not shown because it is similar to the NGC 3268 one depicted in Fig. 15). For the intermediate and faint samples it is possible to fit two Gaussians. These results show that the blue and red peaks for these luminosity ranges agree with the colours obtained for all GCs together, within the errors (Table 2). However, the red peak of the fainter sample is redder than the red of the intermediate sample ( / , and / , for blues/reds in the intermediate and faint samples, respectively).
For the brighter sample, it is not possible to fit two Gaussians but only one. The peak colour obtained () is somewhat intermediate between both GC populations. This behaviour has already been detected in other ellipticals that dominate galaxy clusters like, e.g., NGC 1399 (Ostrov et al. 1998; Dirsch et al. 2003b), and the sample of eight brightest cluster galaxies from Harris et al. (2006).
6 The GCS of NGC 3268
6.1 Radial distribution
Fig. 14 shows the radial density profiles of all GCs, red and blue ones, for the candidates brighter than =25 in NGC 3268. In this case, the profiles can be well described by power-laws or by de Vaucouleurs profiles. All fits were performed within the range 0.6–5 arcmin and the results are depicted in Table 4. The profile obtained from the MOSAIC data for this GCS has been included in the upper panel, where the difference between the VLT and MOSAIC profiles in the inner region is due to radial incompleteness effects within 0.7 arcmin (see fig. 6 in Paper i).
The slopes of all de Vaucouleurs fits for all GCs (red and blue) agree within the errors with those of the NGC 3258 fits. As in the NGC 3258 GCS, red clusters have a more concentrated distribution than blue clusters. It is apparent from Fig. 14 that the innermost point of the blue GCs profile deviates from the expected position, which is probably due to an underestimation of the completeness correction.
Neither the blue or red GC radial density profiles show any feature that can be understood as the spatial limit of the GCS. However, the red profile shows that the zero density level will be reached at a galactocentric radius slightly larger than 5 arcmin.
The galaxy surface luminosity profile shown in Fig. 14 is well traced by the red GCs, but the slope is clearly different from that of the blue GCs profile.
6.2 Azimuthal distribution
The azimuthal number counts of the GCs within 0.5–2 arcmin are shown in the lower panel of Fig. 12, from which we derive an ellipticity and a position angle . The errors in both parameters are large because the fit is affected by a clear excess in the GC azimuthal distribution, at azimuthal angles between 200–250°. This excess appears in coincidence with one of the maxima of the sinusoidal fit, and at azimuthal angles that correspond to the direction towards NGC 3258.
It is interesting to note that on the sky, the position angle with origin in NGC 3258 that points to the direction of NGC 3268, is 39°. So we confirm the results from Paper i, that both GCSs are elongated in a direction close to an axis joining the two galaxies.
6.3 Colour distribution
The GC colour distribution is shown in Fig. 15 for three luminosity intervals, within the radial range 0.7–2.3 arcmin. As for NGC 3258, the brightest GCs show a unimodal colour distribution while fainter GCs have bimodal distributions. The distribution also extends to redder colours as we consider fainter GCs.
The two-Gaussian fits show that the blue and red peaks, for the intermediate and faint luminosity ranges, agree with the colours obtained for all GCs together, within the errors (Table 2). However, the red peak of the fainter sample is clearly redder than that of the intermediate sample ( / , and / , for blues/reds in the intermediate and faint samples, respectively). Similar trends are present in the NGC 3258 GCS. The peak colour obtained from the single-Gaussian fit to the brightest sample () is roughly in between both subpopulations.
The colour distributions within different galactocentric radii have also been tested within an inner and outer samples as for NGC 3258. We confirm the radial dependence of the colour distribution because the fraction of red GCs present in the outer sample is smaller than in the inner one. The colours of the blue/red peaks roughly agree, within the errors, with the ones estimated for the whole GC population, but in this case the peaks of the inner sample are redder than those of the outer group ( / , and / , for blue/red peaks in the inner and outer samples, respectively).
7 Discussion
7.1 The brightest GC candidates
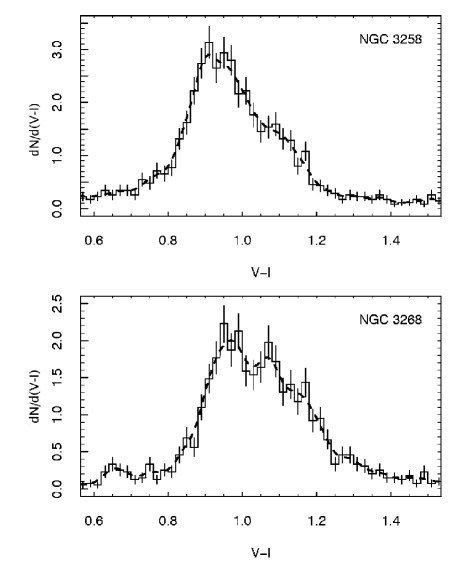
The principal property of the colour distribution of GCs, the bimodality, has been previously found to be absent among the bright GCs of NGC 1399 (Ostrov et al. 1998; Dirsch et al. 2003b) and M87 (Strader et al. 2006). Harris et al. (2006) found the same in their ACS photometry of several central giant ellipticals, including our Antlia galaxies, while this point remained unclear in our previous Washington photometry. Unimodal colour distributions, seem to apply to clusters brighter than approximately . Our present photometry reiterates on this finding, shifting the limit between bimodality and unimodality even a bit lower to .
It is plausible (and discussed in the literature, see the reviews of Richtler 2006 and Brodie & Strader 2006) that there are several possible formation channels for creating a population of very bright clusters. Stripped galactic nuclei (Bassino et al. 1994), former Blue Compact Galaxies, but also “normal” formation of massive clusters, perhaps through the merging of smaller subclusters (Fellhauer & Kroupa 2005) are viable candidates or formation histories, which in the center of a galaxy cluster might occur more frequently than in less dense environments.
7.2 Total GC populations and specific frequencies
We can estimate the GC populations performing a numerical integration of the de Vaucouleurs radial density profile, which includes GCs brighter than =25, and doubling the result according to the TOMs of the GCLFs. The external limiting radius of the GCSs is taken as = 10 arcmin following Paper i. In this way, the total GC population of NGC 3258 amounts to and that of NGC 3268 . In NGC 3258, the red GCs are clearly less numerous than the blues, being the ratio of blues to reds , which is close to the ratio estimated from the colour distribution , within the errors (see Table 2). The ratio of blue to red GCs around NGC 3268 is , also close to the ratio derived from the colour distribution (Table 2).
In order to calculate the specific frequency (as defined by Harris & van den Bergh 1981) of both GCSs, we need the -band absolute magnitudes of the host galaxies and number of GCs estimated over the same galactocentric distance. The -band integrated luminosities of the galaxies up to = 4 arcmin can be obtained from Paper i and corrected by absorption in applying the relation from Rieke & Lebofsky (1985) and the colour excesses depicted in Table 1. We cannot estimate global due to the large uncertainties of the integrated luminosity at larger radii, but we are able to improve the from Paper i (also within = 4 arcmin) through a more precise determination of the number of GCs. By means of the individual distance moduli estimated in this paper and the colour index (Paper i) for both galaxies, we obtain absolute luminosities within 4 arcmin for NGC 3258, and for NGC 3268, where the errors are calculated with the errors of the apparent magnitudes and of the distance moduli. The corresponding GC populations, up to the same radius, are estimated by numerical integration of the radial density profiles. Finally, the specific frequencies within = 4 arcmin are for NGC 3258, and for NGC 3268. Due to the limited radial range of these calculations, these should be taken as indicative values.
7.3 Distances and specific frequencies
The derived distances indicate that NGC 3258 is located somewhat in the foreground with respect to NGC 3268. The TOMs, taken at face value, suggest a difference of 6 Mpc, while the SBF distances are different by 3 Mpc, although the uncertainties would not exclude the same distance. An additional argument is that the ‘intracluster’ field independently reveals a TOM intermediate between NGC 3258 and NGC 3268 which we expect if the outskirts of the respective GCSs are projected onto each other.
This interpretation is also not without oddities. NGC 3258 has an unusually high specific frequency considering its brightness and, if really in the foreground, would be in a relatively poor environment, at least poorer than that of NGC 3268. Such a high frequency is, however, not unique as we see from the case of NGC 4636 (Dirsch et al. 2005), but extraordinary. A distance modulus of 0.4 mag higher would decrease its specific frequency by a factor of 1.4, making it more common. On the other hand, its TOM is very well sampled, better than that of NGC 3268, so we do not think that the TOM is grossly erroneous.
A few remarks to the group around NGC 3268: The radial velocities of the three neighbour galaxies that are listed in Paper i (NGC 3269, NGC 3271, NGC 3267; these are the only ones for which radial velocities are available), are consistently higher by about 1000 km/s. The morphological appearance suggests NGC 3268 to be the central galaxy of that subgroup of the Antlia cluster. These radial velocities, however, let it appear improbable that NGC 3268 is at rest with respect to that group. Its “normal” specific frequency also would not qualify it as a “central” galaxy.
More insight into the structure of the Antlia cluster can only be expected by a radial velocity survey.
7.4 Intracluster globular clusters?
With regard to the presence of GCs inside galaxy clusters that are not bound to individual galaxies, observational evidence of their existence have been presented, among others, by Minniti et al. (1998), Kissler-Patig et al. (1999) Bassino et al. (2003), Jordán et al. (2003), and Williams et al. (2007). Besides, numerical simulations on their formation and properties have been performed by Yahagi & Bekki (2005).

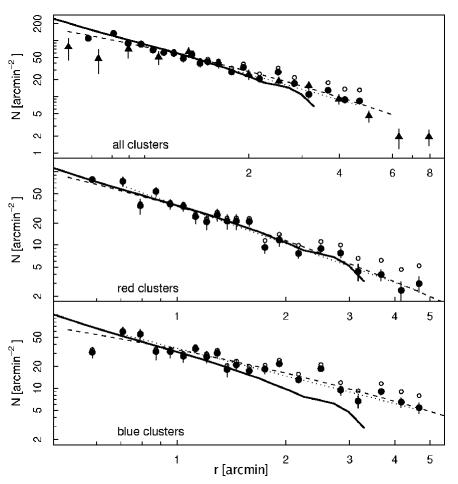
In the previous sections we have derived the cluster radial density distribution and fitted de Vaucouleurs laws to the GCSs of NGC 3258 and NGC 3268. We now take these fits, extrapolate them beyond the observed 5 arcmin, and compute the combined cluster density along the connecting axis between the two galaxies. The results for all GCs, as well as for reds and blues, are shown in Fig. 16, where NGC 3258 and NGC 3268 would be on the right and left sides, respectively.
The ‘intracluster’ field is located on this connecting axis, and we aim at comparing the observed densities in this field with the combined extrapolated profile, along this connecting line. For this reason, the GC densities for five different radial ranges within the ‘intracluster’ field, completeness corrected and background subtracted, are determined taking a limiting magnitude = 25. The observed densities follow closely the individual extrapolated density profiles (filled circles in Fig. 16). However, number statistics are low as all densities in this field, observed and extrapolated, are below 5 GCs arcmin-2. We scaled the MOSAIC densities to those of the VLT fields, which are shown in the upper panel of Fig. 16. On the ‘intracluster’ field, the combination of the extrapolated fitted functions seems to predict a higher cluster density than the observed one.
If there were some intracluster GCs one would expect the observed density in the ‘intracluster’ field to be larger than just the sum of the individual GCS extrapolated profiles. The contribution of red GCs is almost negligible, so the analysis is performed basically on the blue ones. Along the axis connecting both galaxies, the range of the observed (blue GC) densities is arcmin-2 while the range of combined (blue GCs) extrapolated densities, within the same radii, is arcmin-2. Though we are dealing with poor number statistics these results suggest that not only the observed densities are not larger than the predicted ones, but they even tend to be smaller.
So far, we do not find from our data any conclusive evidence of the existence of intracluster GCs in the region between NGC 3258 and NGC 3268. However, it should be taken into account that the ‘intracluster’ field, where there are GCs contributed by both GCSs, has not turn into a proper place to seek for them. We are undertaking a kinematic study of the GC and galaxy content of the Antlia cluster, that will probably help to detect their presence in this cluster.
8 Summary and Conclusions
On the basis of FORS1/VLT () images we have performed an analysis of the globular cluster systems of NGC 3258 and NGC 3268, the dominant elliptical galaxies of the Antlia galaxy cluster. Our first study of these GCSs was based on Washington () photometry and wide-field MOSAIC images (Paper i), which did not reach the turn-over magnitude (TOM) of the globular cluster luminosity function (GCLF). Here we summarize the results and conclusions:
-
-
The TOMs of the red, the blue, and the total populations are obtained by fitting Gaussians to the respective GCLFs. The distance moduli, obtained from the entire GC sample, are for NGC 3258 and for NGC 3268, which are in good agreement with those obtained by Tonry et al. (2001) via the SBF method. The TOMs of the blue GCs are on the average = 0.4 mag brighter than those of the red ones.
-
-
The GCLF was independently determined for a field between NGC 3258 and NGC 3268. We could measure a TOM of (blue GCs), intermediate between the TOMs of the bright galaxies. This supports the view that we are observing the overlapping of the two GCSs. The actual number density is even somewhat lower than from one would expect by the extrapolation of the number density profiles determined near the host galaxies. We therefore found no evidence of the presence of intracluster GCs in the field between the ellipticals.
-
-
The total GC populations are about GCs in NGC 3258 and GCs in NGC 3268 while the extent of both GCSs is at least 10 arcmin (about 90 kpc). If the relative distances are correct, this corresponds to specific frequencies of for NGC 3258 and for NGC 3268.
-
-
Other findings from Paper i like the bimodal colour distribution or the azimuthal distributions have been confirmed. The galaxy light profiles match more closely the red GCs radial density profiles. A point not addressed in Paper i is the unimodal colour distribution of the brightest clusters.
The strongest indication so far for the spatial proximity of NGC 3268 and NGC 3258 was the common radial velocity of 2800 km/s. But the GCLF distance moduli rather suggest that NGC 3268 is located somewhat in the background, separated from NGC 3258 by several Mpc. The unusually high specific frequency of NGC 3258 is, however, a rare finding and would ease with a distance equal to that of NGC 3268. A further confirmation would therefore be required. Much evidence suggests that Antlia is a cluster in a very early stage of dynamical evolution, but the spatial and dynamical relationship of its components are still unclear. We started a kinematic study intending to bring more clarity in the understanding of the apparently complex structure of Antlia.
Acknowledgments
BD and TR gratefully acknowledge support from the Chilean Center for Astrophysics FONDAP No. 15010003. LPB is grateful to the Astronomy Group at the Concepción University, for financial support and warm hospitality during part of this research. This work was also funded with grants from Consejo Nacional de Investigaciones Científicas y Técnicas de la República Argentina, Agencia Nacional de Promoción Científica Tecnológica and Universidad Nacional de La Plata (Argentina).
References
- Ashman et al. (1994) Ashman K.M., Bird C.M., Zepf S.E., 1994, AJ, 108, 2348
- Ashman et al. (1995) Ashman K.M., Conti A., Zepf S.E., 1995, AJ, 110, 1164
- Barmby et al. (2001) Barmby P., Huchra J.P., Brodie J.P., 2001, AJ, 121, 1482
- Bassino et al. (1994) Bassino L.P., Muzzio J.C., Rabolli M., 1994, ApJ, 431, 634
- Bassino et al. (2003) Bassino L.P., Cellone S.A., Forte J.C., Dirsch, B., 2003, A&A, 399, 489
- Bassino et al. (2006a) Bassino L.P., Faifer F.R., Forte J.C., Dirsch, B., Richtler, T., Geisler, D., Schuberth, Y., 2006a, A&A, 451, 789
- Bassino et al. (2006b) Bassino L.P., Richtler T., Dirsch B., 2006b, MNRAS, 367, 156
- Brodie & Strader (2006) Brodie J.P., Strader J., 2006, ARA&A, 44, 193
- Dean et al. (1978) Dean J.F., Warren P.R., Cousins A.W.J., 1978, MNRAS, 183, 569
- De Bruyne et al. (2004) De Bruyne V., De Rijcke S., Dejonghe H., Zeilinger W. W.,2004, MNRAS, 349, 440
- Dirsch et al. (2003a) Dirsch B., Richtler T., Bassino L.P., 2003a, A&A, 408, 929 (Paper i)
- Dirsch et al. (2003b) Dirsch B., Richtler T., Geisler D., Forte J.C., Bassino L. P., Gieren W.P., 2003b, AJ, 125, 1908
- Dirsch et al. (2005) Dirsch B., Schuberth Y., Richtler T., 2005, A&A, 433, 43
- Elson & Santiago (1996) Elson R.A.W., Santiago B.X., 1996, MNRAS, 280, 971
- Fellhauer & Kroupa (2005) Fellhauer M., Kroupa P., 2005, MNRAS, 359, 223
- Ferguson & Sandage (1990) Ferguson H.C., Sandage A., 1990, AJ, 100, 1
- Harris & Canterna (1977) Harris H.C., Canterna R., 1977, AJ, 82, 798
- Harris (2001) Harris W.E., 2001, in Labhardt L., Binggeli B., eds., Saas–Fee Advanced Course 28, Star Clusters, Springer–Verlag, Berlin, p. 223
- Harris & van den Bergh (1981) Harris W.E., van den Bergh, S., 1981, AJ, 86, 1627
- Harris et al. (1998) Harris W.E., Harris G.L.H., McLaughlin D.E., 1998, AJ, 115, 1801
- Harris et al. (2006) Harris W.E., Whitmore B.C., Karakla D., Okoń W., Baum W.A., Hanes D.A., Kavelaars J.J, 2006, ApJ, 636, 90
- Hopp & Materne (1985) Hopp U., Materne J., 1985, A&AS, 61, 93
- Jedrzejewski (1987) Jedrzejewski R.I., 1987, MNRAS, 226, 747
- Jordán et al. (2002) Jordán A., Côtè P., West M.J., Marzke R.O., 2002, ApJ, 576, L113
- Jordán et al. (2003) Jordán A., West M.J., Côtè P., Marzke R.O., 2003, AJ, 125, 1642
- Jordán et al. (2006) Jordán A. et al., 2006, ApJ, 651, L25
- Jordán et al. (2007) Jordán A. et al., 2007, ApJS, 171, 101
- Kissler-Patig et al. (1999) Kissler-Patig M., Grillmair C.J., Meylan G., Brodie J.P., Minniti, D., Goudfrooij P.,1999, AJ, 117, 1206
- Kundu et al. (1999) Kundu A., Whitmore B.C., Sparks W.B., Macchetto F.D., Zepf S.E., Ashman K.M., 1999, ApJ, 513, 733
- Kundu et al. (2001) Kundu A., Whitmore B.C., 2001, AJ, 121, 2950
- Landolt (1992) Landolt A.U., 1992, AJ, 104, 340
- Larsen et al. (2001) Larsen S.S., Brodie J.P., Huchra J.P., Forbes D.A., Grillmair C.J., 2001, AJ, 121, 2974
- McLaughlin (1994) McLaughlin D.E., 1994, PASP, 106, 47
- Minniti et al. (1998) Minniti D., Kissler-Patig M., Goudfrooij P., Meylan, G., 1998, AJ, 115, 121
- Nakazawa et al. (2000) Nakazawa K., Makashima K., Fukazawa Y., Tamura T., 2000, PASJ, 52, 623
- Ostrov et al. (1998) Ostrov P.G., Forte J.C., Geisler D., 1998, AJ, 116, 2854
- Pedersen et al. (1997) Pedersen K., Yoshii Y., Sommer-Larsen J., 1997, ApJ, 485, L17
- Prugniel & Siemen (1996) Prugniel P., Simien F., 1996, A&A, 309, 749
- Puzia et al. (1999) Puzia T.H., Kissler-Patig M., Brodie J.P., Huchra J.P., 1999, AJ, 118, 2734
- Reid et al. (1994) Reid N., Boisson C., Sansom E.A., 1994, MNRAS 269, 713
- Rhode & Zepf (2001) Rhode K.L., Zepf S.E., 2001, AJ, 121, 210
- Rhode & Zepf (2004) Rhode K.L., Zepf S.E., 2004, AJ, 127, 302
- Richtler (2003) Richtler T., 2003, Lecture Notes in Physics, 635, 281
- Richtler (2006) Richtler T., 2006, Bulletin of the Astronomical Society of India, 34, 83
- Rieke & Lebofsky (1985) Rieke G.H., Lebofsky M.J., 1985, ApJ, 288, 618
- Schlegel et al. (1998) Schlegel D.J., Finkbeiner, D.P., Davis M., 1998, ApJ, 500, 525
- Smith Castelli et al. (2007) Smith Castelli A.V., Bassino L.P., Richtler T., Cellone S.A., Aruta C., Infante L., 2007, MNRAS, submitted
- Spitler et al. (2006) Spitler L.R., Larsen S.S., Strader J., Brodie J.P., Forbes D.A., Beasley M.A., 2006, AJ, 132, 1593
- Stanek (1996) Stanek K.Z., 1996, ApJ, 460, L37
- Strader et al. (2006) Strader J., Brodie J.P., Spitler L., Beasley M.A., 2006, AJ, 132, 2333
- Tonry et al. (2001) Tonry J.L., Dressler A., Blakeslee J.P., Ajhar E.A., Fletcher A,B., Luppino G.A., Metzger M.R., Moore C.B., 2001, AJ, 546, 681
- West et al. (1995) West M.J., Côtè P., Jones C., Forman W., Marzke R.O., 1995, AJ, 453, L77
- Williams et al. (2007) Williams B.F. et al., 2007, ApJ, 654, 835
- Yahagi & Bekki (2005) Yahagi H., Bekki K., 2005, MNRAS, 364L, 86