CFBDS J005910.90-011401.3: reaching the T-Y Brown Dwarf transition? ††thanks: Based in part on observations obtained with MegaPrime/MegaCam, a joint project of CFHT and CEA/DAPNIA, at the Canada-France-Hawaii Telescope (CFHT) which is operated by the National Research Council (NRC) of Canada, the Institut National des Sciences de l’Univers of the Centre National de la Recherche Scientifique (CNRS) of France, and the University of Hawaii. This work is based in part on data products produced at TERAPIX and the Canadian Astronomy Data Centre as part of the Canada-France-Hawaii Telescope Legacy Survey, a collaborative project of NRC and CNRS. Also based on observations obtained at the Gemini Observatory, which is operated by the Association of Universities for Research in Astronomy, Inc., under a cooperative agreement with the NSF on behalf of the Gemini partnership: the National Science Foundation (United States), the Science and Technology Facilities Council (United Kingdom), the National Research Council (Canada), CONICYT (Chile), the Australian Research Council (Australia), CNPq (Brazil) and SECYT (Argentina) under programs GN-2007A-Q-201 and GN-2007B-Q-3. Also based on observations made with ESO Telescopes at the La Silla Observatory under programmes 078.C-0629 and 078.A-0651. Some of the data presented herein were obtained at the W.M. Keck Observatory, which is operated as a scientific partnership among the California Institute of Technology, the University of California, and the National Aeronautics and Space Administration. The Observatory was made possible by the generous financial support of the W.M. Keck Foundation.
We report the discovery of CFBDS J005910.90-011401.3 (hereafter CFBDS0059), the coolest brown dwarf identified to date. We found CFBDS0059 using and images from the Canada-France-Hawaii Telescope (CFHT), and present optical and near-infrared photometry, Keck laser guide star adaptive optics imaging, and a complete near-infrared spectrum, from 1.0 to 2.2 m. A side to side comparison of the near-infrared spectra of CFBDS0059 and ULAS J003402.77-005206.7 (hereafter ULAS0034), previously the coolest known brown dwarf, indicates that CFBDS0059 is K cooler. We estimate a temperature of K and gravity of . Evolutionary models translate these parameters into an age of 1-5 Gyr and a mass of MJup. We estimate a photometric distance of 13pc, which puts CFBDS0059 within easy reach of accurate parallax measurements. Its large proper motion suggests membership in the older population of the thin disk. The spectra of both CFBDS0059 and ULAS J0034 shows probable absorption by a wide ammonia band on the blue side of the -band flux peak. If, as we expect, that feature deepens further for still lower effective temperatures, its appearance will become a natural breakpoint for the transition between the T spectral class and the new Y spectral type. CFBDS0059 and ULAS J0034 would then be the first Y0 dwarfs.
Key Words.:
Low mass stars: brown dwarfs – spectroscopy – Surveys1 Introduction
Observed stellar and substellar atmospheres cover a continuum of physical conditions from the hottest stars ( 100 000 K) to the coolest known brown dwarfs (previously ULAS J003402.77-005206.7 (hereafter ULAS0034), T8 Warren et al. (2007)). There remains however a sizeable temperature gap between the 600-700 K ULAS0034 and the 100 K giant planets of the Solar System. Many of the currently known extrasolar planets populate this temperature interval, characterized by complex atmospheric physics: matter and radiation in these cold, dense, and turbulent atmospheres couple into a very dynamical mix, where molecules and dust form and dissipate. Current atmosphere models are rather uncertain in this unexplored temperature range and they will significantly benefit from observational constraints. Two major physical transitions are expected to occur between 700 K and 400 K and strongly alter the emergent near-infrared spectra (Burrows et al. 2003): NH3 becomes an abundant atmospheric constituent and its near-infrared bands become major spectral features, and water clouds form and deplete H2O from the gas phase. The corresponding near-infrared spectral changes are likely to be sufficiently drastic that the creation of a new spectral type will be warranted (Kirkpatrick 2000). Kirkpatrick et al. (1999); Kirkpatrick (2000) reserved the “Y” letter for the name of that putative new spectral type.
To help fill this temperature gap, we conduct the Canada France Brown Dwarf Survey (CFBDS, (Delorme et al. 2008)), which uses MegaCam (Boulade et al. 2003) and images to select very cool brown dwarfs (and high redshift quasars) on their very red colour. We present here our coolest brown dwarf discovery to date, CFBDS J005910.90-011401.3 (hereafter CFBDS0059), a T8 dwarf with evidence for near-infrared NH3 absorption. Section 2 describes its discovery, and presents our follow-up observations: , , , , and photometry and astrometry of CFBDS0059 and (as a reference) ULAS0034, laser guide star adaptive optics imaging and a near infrared spectrum of the new brown dwarf. Section 3 discusses the kinematics and the dynamical population membership of CFBDS0059. Section 4 compares the spectrum of CFBDS0059 with those of Gl 570D (T7.5), 2MASS J0415-09 (T8) and ULAS0034, and in the light of synthetic spectra uses that comparison to determine its effective temperature, gravity and metallicity. We also examine in that section the new spectral features which appear below 700K, in particular an NH3 band, and discuss new spectral indices for spectral classification beyond T8. Finally, section 5 summarizes our findings and sketches our near-future plans.
2 CFBDS
Field ultracold brown dwarfs are intrinsically very faint, and as a result they can only be identified in sensitive wide-field imaging surveys. They are most easily detected in the near infrared, and one could thus naively expect them to be most easily identified in that wavelength range. Brown dwarf spectra however very much differ from a black body, and their considerable structure from deep absorption lines and bands produces broad-band pure near-infrared colours that loop back to the blue. At modest signal to noise ratios, those colours are not very distinctive. Brown dwarfs are therefore more easily recognized by including at least one photometric band under 1 m. At those shorter wavelengths their spectra have extremely steep spectral slopes, and the resulting very red and colours easily stand out.
As discussed in detail in Delorme et al. (2008), the CFBDS survey brown dwarf identification is a two-step process:
-
•
we first select brown dwarfs candidates on their red colour in MegaCam images which cover several hundred square degrees.
-
•
-band pointed observations of these candidates then discriminate actual brown dwarfs from artefacts, and astrophysical contaminants.
The selection takes advantage of the wide field of the MegaCam camera 111http://www-dapnia.cea.fr/Sap/Phys/Sap/Activites/Projets/Megacam on the 3.6m CFHT telescope, and of the trove of deep observational material obtained with that instrument. We rely on existing images from the Very Wide component of the Canada France Hawaii Telescope Legacy Survey (CFHTLS-VW) and, for different fields, on existing images from the Red sequence Cluster Survey 2 (RCS2). We then match those with either new or new exposures to obtain and pairs. The two parent surveys also obtain and images, which for the RCS2 survey are contemporaneous with the exposure. We don’t use those as primary selection tools, but the contemporaneous exposures from the RCS2 survey provide a welcome check that an apparently red source was not, instead, a variable brighter at all wavelenghts at the epochs. Since all our fields have low galactic extinction, the only other astrophysical point sources with a similarly red are quasars at redshifts of z, which represent the other motivation of our program (e.g. Willott et al. 2007). We discriminate between quasars and brown dwarfs with -band photometry obtained on several 2 to 4m-class telescopes (Delorme et al. 2008, for details). These targeted follow-up observations also reject a number of remaining unflagged artefacts and they provide a refined spectral type estimate, thanks to the much higher signal-to-noise ratio which we typically achieve on than on .
3 Observations
We first identified CFBDS0059 as a brown dwarf candidate when comparing a 360 s RCS2 exposure from 2005 December 27 with a 500 seconds CFBDS exposure from 2006 August 31. CFBDS0059 is undetected in the image to (), in spite of a strong detection (). The RCS2 survey obtains contemporaneous , and images, and we checked the and exposures for a counterpart. These images, which were obtained within 50 minutes of the observation, show no object at the position of CFBDS0059. This essentially excludes that the detection was due to a variable or slowly moving object with neutral colours. The () lower limit was thus secure, and made CFBDS0059 a very strong candidate for follow-up.
3.1 -band photometry and near-infrared spectroscopy
Our initial -band imaging consists of five 20-second dithered exposures with the SOFI near-infrared camera on the ESO NTT telescope at La Silla on 2006 November 12. As discussed below, the photometric system of that instrument is non-standard. We used a modified version of the jitter utility within the ESO Eclipse package (Devillard 1997) to subtract the background and coadd the five exposures. We extracted photometry from the resulting image using PSF fitting within Source Extractor (Bertin & Arnouts (1996) and Bertin & Delorme, in preparation) and obtain =. The resulting colour confirmed CFBDS0059 as a strong very late-T dwarf candidate and we triggered -band spectroscopic observations with NIRI (Hodapp et al. 2003) at Gemini-North. Those were obtained in queue mode on 2007 July 30 and immediately confirmed the very cool nature of CFBDS0059. We then requested and -band spectroscopy with the same instrument, which was obtained on 2007 September 1.
All spectra were obtained through a -wide slit, which produces a resolving power of . The object is dithered along the slit. The -band spectrum is the sum of 16 second integrations, while the and band spectra each are the sum of 9 second integrations. Consecutive image pairs are pair subtracted, flat fielded using a median combined spectral flat and corrected for both spectral and spatial distortions. Spectra are extracted using a positive and a negative extraction box matched to the trace profile. A first wavelength calibration was obtained with argon lamp arc spectra taken at the end of the sequence, and the wavelength scale was then fine tuned to match the atmospheric OH-lines. Individual spectra extracted from image pairs were then normalized and median combined into final spectra. Per-pixel S/N of 25, 40 and 5 where achieved on the J, H and K-band peaks respectively. For all 3 wavelength settings the A0 star HIP10512 was observed immediately after the science observations to calibrate the instrumental spectral response and the telluric transmission.
3.2 Additional near-infrared and optical Photometry
| Target | Spectral band | ||||||
| CFBDS0059 | - | ||||||
| ULAS0034 | - | ||||||
| Warren et al. (2007) | - | ||||||
| CFBDS0059 | - | ||||||
| ULAS0034 | - | ||||||
| Warren et al. (2007) | - | ||||||
The filter of the SOFI camera on the NTT has a quite non-standard bandpass, for which the large colour corrections that result from the strong structrure in T dwarf spectra (e.g. Stephens & Leggett 2004) have not been fully characterized. To compare the spectral energy distribution (SEDs) of CFBDS0059 and ULAS0034 (Warren et al. 2007) we therefore prefered to obtain additional near-infrared wide-band photometry with WIRCam (Puget et al. 2004) on CFHT, which uses standard Mauna Kea Observatory infrared filters (Simons & Tokunaga 2002; Tokunaga et al. 2002; Tokunaga & Vacca 2005, MKO system). The observations (2007 August 1st and 5th) used dithering patterns of arcsec amplitude for total (respectively individual) exposure times of 300 (60), 150 (30), 300 (15) and 720 (20) seconds for the , , and bands. The skies were photometric and the seeing varied between 0.8 and 1.0”.
Table 1 summarizes the magnitudes of CFBDS0059 and ULAS0034 in all available bands. The WIRCam photometry of ULAS0034 agrees with the Warren et al. (2007) measurements within better than 1 for band and within 1.5 for . The Warren et al. (2007) K-band measurement used a filter, while our WIRCam measurement uses the narrower and bluer filter. The 0.15 mag difference between these two observations is approximately consistent with the Stephens & Leggett (2004) prediction for the effect of these different filter bandpasses at late-T spectral types. Similarly, the better short-wavelength quantum efficiency of the WIRCam detector can qualitatively explain the 0.2 magnitude (2) discrepancy between our photometry and the Warren et al. (2007) WFCam measurement. The near-IR colours of the two brown dwarfs are similar, except which is 0.5 magnitude bluer for CFBDS0059 than for ULAS0034. We will interpret the implications of this low flux when we examine the near-infrared spectrum.
3.3 Astrometry
CFBDS0059 and ULAS0034 are serendipitously just 6.3 degrees apart on the sky, and at similar photometric distances from Earth since they have similar spectral types and apparent magnitudes , and we initially entertained the idea that they might, perhaps, be part of a common moving group. The proper motion of CFBDS0059 however, measured between our 2005 Megacam and 2007 WIRCam images, and uncorrected for its parallactic motion, is ”/yr, ”/yr (Table 2). ULAS0034 on the other hand moves by ”/yr and ”/yr (Warren et al. 2007). The two proper motions are thus sufficiently different that the two brown dwarfs are clearly unrelated. We checked for main sequence common proper motion companions to CFBDS0059, which would have provided welcome age and metallicity constraints (e.g. Scholz et al. 2003) but did not find any match within a 10 arcminute radius.
| RA(J2000) | DEC(J2000) | ||
|---|---|---|---|
| hh:mm:ss | dd:mm:ss | ||
| 00:59:10.903 | -01:14:01.13 | ||
3.4 Keck Laser Guide Star Adaptive Optics Imaging
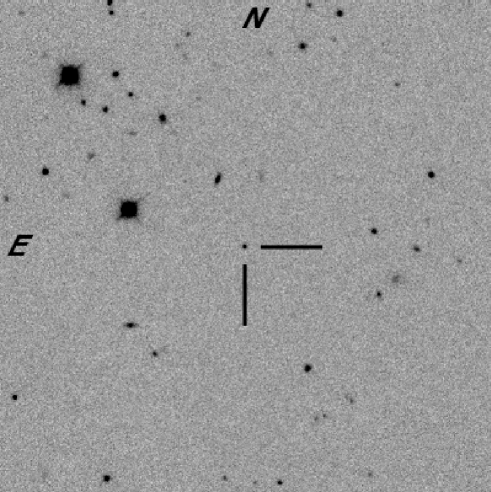
To search for binarity, we imaged CFBDS0059 on 16 January 2008 UT using the laser guide star adaptive optics (LGS AO) system (van Dam et al. 2006; Wizinowich et al. 2006) of the 10-meter Keck II Telescope on Mauna Kea, Hawaii. Conditions were photometric with better than average seeing. We used the facility IR camera NIRC2 with its narrow field-of-view camera, which produces an image scale of mas/pixel (Pravdo et al. 2006) and a field of view. The LGS provided the wavefront reference source for AO correction, with the exception of tip-tilt motion. The LGS brightness was equivalent to a mag star, as measured by the flux incident on the AO wavefront sensor. Tip-tilt aberrations and quasi-static changes in the image of the LGS as seen by the wavefront sensor were measured contemporaneously with a second, lower-bandwidth wavefront sensor monitoring the mag field star USNO-B1.0 0887-0010532 (Monet et al. 2003), located 32″ away from CFBDS0059. The sodium laser beam was pointed at the center of the NIRC2 field-of-view for all observations.
We obtained a series of dithered images, offsetting the telescope by a few arcseconds, with a total integration time of 1080s. We used the filter, which has a central wavelength of 1.592 m and a width of 0.126 m. This filter is positioned near the -band flux peak emitted by late-T dwarfs. The images were reduced in a standard fashion. We constructed flat fields from the differences of images of the telescope dome interior with and without continuum lamp illumination. Then we created a master sky frame from the median average of the bias-subtracted, flat-fielded images and subtracted it from the individual images. Images were registered and stacked to form a final mosaic, with a full-width at half-maximum of 0.09″ and a Strehl ratio of 0.05. No companions were clearly detected in a region centered on CFBDS0059.
We determined upper limits from the direct imaging by first smoothing the final mosaic with an analytical representation of the PSF’s radial profile, modeled as the sum of multiple gaussians. We then measured the standard deviation in concentric annuli centered on the science target, normalized by the peak flux of the targets, and adopted 10 as the flux ratio limits for any companions. These limits were verified with implantation of fake companions into the image using translated and scaled versions of the science target.
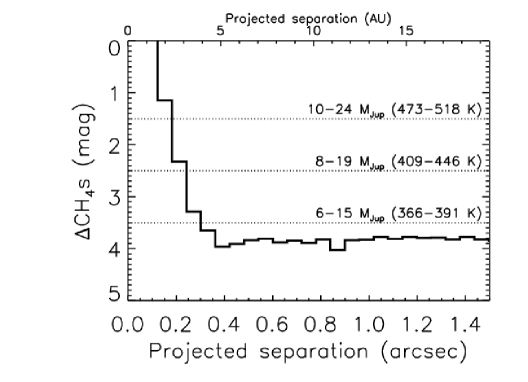
Figure 2 presents the final upper limits on any companions. We employed the ”COND” models of Baraffe et al. (2003) to convert the limits into companion masses, for assumed ages of 1 and 5 Gyr and a photometric distance estimate of 13 pc. We assumed any cooler companions would have similar colors to CFBDS0059.
4 Kinematics
We estimate a spectrophotometric distance for CFBDS0059 by adopting M, based on an approximate T9/Y0 spectral type (discussed below) and on an extrapolation of the MJ versus spectral type relation of Knapp et al. (2004) beyond T8 (2MASSJ, hereafter 2M0415). This extrapolation is consistent with the Chabrier et al. (2000) models which predict between brown dwarfs of 750K and 625K (like 2M0415 and CFBDS0059). The resulting d = pc has significant systematic uncertainties, because spectral typing beyond T8 is just being defined, and especially because the linear 1 magnitude/subtype decline seen at earlier subtypes may not continue beyond T8. The adaptive optics observations exclude any companion of similar luminosity beyond 1.2 AU, but CFBDS0059 could still of course be a tighter binary. Its small distance fortunately puts CFBDS0059 within easy reach of modern parallax measurements.
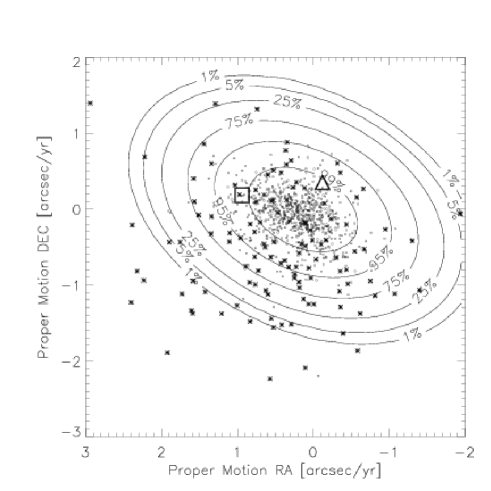
We use the Besancon stellar population model (Robin et al. 2003) to generate synthetic stars between 10 pc and 20 pc for the thin (dots) and thick (star symbol) disk populations at the galactic position of CFBDS0059. Fig 3 shows their proper motions together with those of CFBDS0059 and ULAS0034. The contour lines show the probability that an object with a given proper motion belongs to the thin disk rather than the thick disk (halo membership probabilities are negligible). CFBDS0059, at its probable distance, is well within the 95% probability thin disk membership region, and ULAS0034 is within the 99% probability region. In spite of its somewhat high proper motion for an object beyond 10 pc, CFBDS0059 therefore most likely belongs to the thin disk. The mean age of the simulated stars in the region of the proper motion diagram occupied by CFBDS0059 is 4 Gyr, suggesting that it is an older member of the thin disk. That age is consistent with the 1 to 5 Gyr range derived below from comparison to COND evolutionary models (Baraffe et al. 2003). As any kinematic age for an individual star, this determination has large error bars, but it suggests that CFBDS0059 might be older than ULAS0034.
5 Spectral comparison and atmospheric parameters
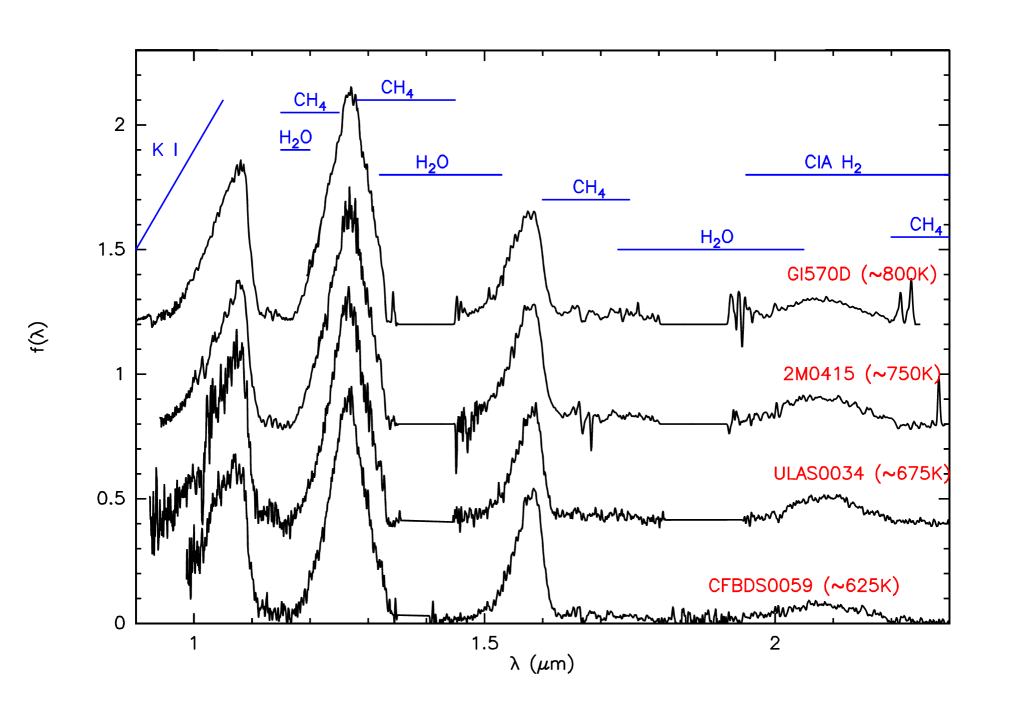
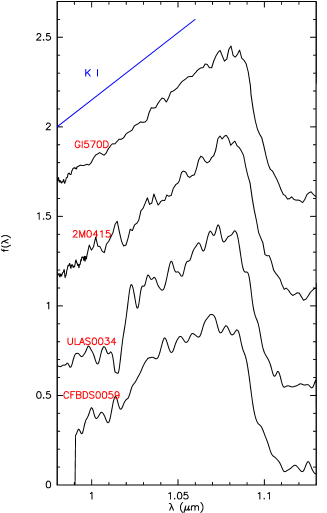
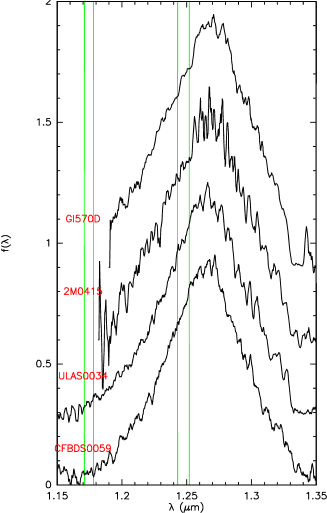
Fig 4 and Fig 5 present our spectrum of CFBDS0059, together with those of ULAS0034 (Warren et al. 2007, T8), 2M0415 (Burgasser et al. 2003, T8) and Gl 570D (Burgasser et al. 2000, T7.5), which successively were the coolest known brown dwarfs. Thanks to their earlier discovery, 2M0415 and Gl 570 have the best characterized atmospheric parameters (Saumon et al. 2006, 2007), and they provide the most solid baseline for a differential study. The Warren et al. (2007) spectrum of ULAS0034, kindly communicated by S. Leggett, was obtained with GNIRS on Gemini South and its = 500 resolution matches that of our NIRI spectrum of CFBDS0059. We downloaded the Burgasser et al. (2003, 2002) OSIRIS spectra of the two other brown dwarfs from the Ultracool Dwarf Catalog222http://www.iac.es/galeria/ege/catalogo_espectral/index.html, and degraded their original spectral resolution of to match that of the GNIRS and NIRI spectra. Stronger telluric absorption from the lower altitude telescopes explains the wider blanked regions in the corresponding spectra, but doesn’t measurably affect any comparison: as illustrated by CFBDS0059, late-T dwarfs have essentially negligible flux wherever telluric H2O absorption matters. Because the OSIRIS spectra do not cover the band, we complement them by lower resolution spectra from Geballe et al. (2001) and Knapp et al. (2004) for .
 |
 |
 |
5.1 Atmospheric parameters
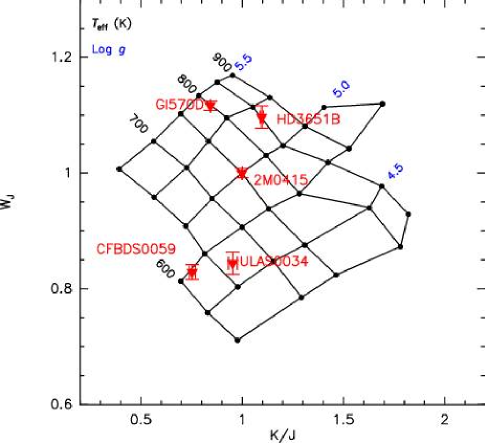
Atmospheric parameters of ultracool dwarfs are ideally determined from a combination of near and mid-IR information (e.g. Saumon et al. 2006, 2007), but low resolution near-infrared spectra alone provide a useful proxy when mid-IR photometry and spectra are not (yet) available (e.g. Burgasser et al. 2006a; Leggett et al. 2007). Burgasser et al. (2006a) used a grid of solar metallicity cool brown dwarfs to calibrate two spectral ratios, H2O- and , which respectively measure the strength of H2O absorption at 1.15 m and the flux ratio between the and peaks, to Teff and . Warren et al. (2007) however found that H2O- essentially saturates below Teff = 750K, and therefore chose not to use this spectral index for spectral types later than T8. They demonstrate on the other hand that the combination of the index with the width of -band peak, parametrised by their index, becomes a good Teff and diagnostic at T900 K, and remains useful significantly below 750K. We adopt their method.
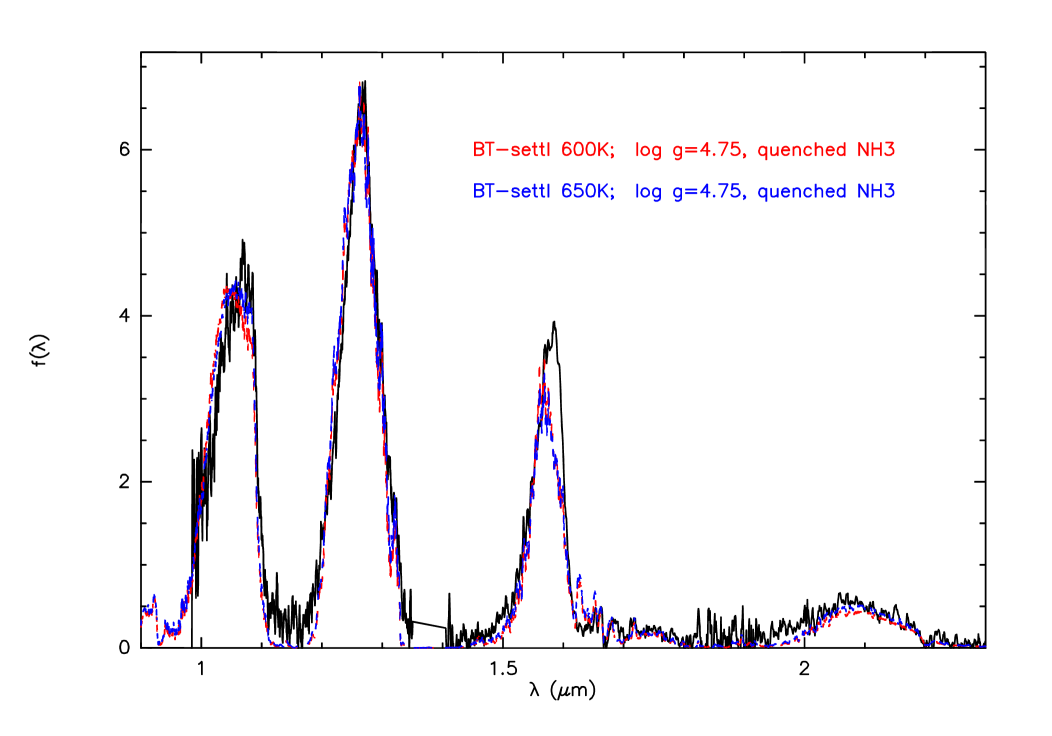
Table 3 lists our measurement of these two indices for CFBDS0059, and Fig 6 compares them with the Warren et al. (2007) measurements for Gl 570D, HD3651B, 2M0415 and ULAS0034. To derive Teff and from the indices we use model indices from solar-abundance BT-settl atmospheric models (Warren et al. 2007; Allard et al. 2003, Allard et al. 2008 in prep). The model with NH3 at chemical equilibrium abundance clearly produces too much absorption in the blue side of the -band, confirming the finding of Saumon et al. (2006, 2007) that non-equilibrium processes keep the NH3 partial pressure well below its equilibrium value. We then use models that keep the abundances of NH3 and N2 at a fixed value in all parts of the atmosphere where the reaction timescale exceeds the mixing timescale, which typically occurs at the 600-800K temperature level. These ”quenched” models agree much better with the observed band shape.
As a first order correction for the remaining imperfections of the theoretical spectra, the model indices are shifted into agreement with the measurements of 2M0415 at the [Teff=750K; =5.00 and [M/H]=0] determined for that brown dwarf by Saumon et al. (2007). The Teff=800K and =5.35 resulting from this calibration for Gl 570D are consistent with the Teff=800-820K and =5.1-5.25 derived by Saumon et al. (2006) from a complete spectral analysis. For HD3651B, Teff=820-890K and =5.1-5.3 resulting from this calibration are roughly consistent with the Teff=780-840K and =5.1-5.5 derived by Liu et al. (2007).
CFBDS0059 and ULAS0034 have very similar indices, but the new brown dwarf has a significatively smaller index. Visual comparison of the two spectra (Fig. 4) confirms that CFBDS0059 does have a weaker -band peak than any of the 3 comparison cool brown dwarfs. As widely discussed in the recent literature (e.g. Liu et al. (2007), Fig. 3 in Burgasser et al. (2006a), or Fig. 3 in Leggett et al. (2007)), for a fixed metallicity a weaker -band peak is evidence for either a lower temperature or a higher gravity. The index lifts this degeneracy: it indicates, again assuming identical chemical compositions for the two brown dwarfs, that CFBDS0059 is cooler by 5015 K and has a 0.150.1 higher than ULAS0034.
As also discussed by Warren et al. (2007), the above uncertainties only reflect the random errors in the spectral indices. They are appropriate when comparing two very similar objects, like CFBDS0059 and ULAS0034, since systematic errors then cancel out. They must on the other hand be increased to compute absolute effective temperatures and gravity: one then needs to account for the uncertainties on the 2M0415 parameters which anchor the Fig 6 grid (TK and ; Saumon et al. (2007)), and for the uncertainties in the atmospheric models which may distort the grid between its anchor point [Teff=750K; =5.00 and [M/H]=0] and the 600K region of interest here. We conservatively adopt Teff=62050K and =4.750.3.
This 2-parameter analysis obviously cannot determine all three main atmospheric parameters (Teff,, and metallicity). As discussed by Warren et al. (2007), it actually determines the temperature with no ambiguity but leaves a combination of and undetermined, and they demonstrated that in the versus plot metallicity is degenerate with surface gravity, with . CFBDS0059 is thus definitely cooler than ULAS0034, but from versus diagram it can have either higher surface gravity or lower metallicity. This degeneracy affects the full JHK-band spectrum, where any metallicity vs gravity difference is at most very subtle. It is however lifted by the shape of the -band peak (Figs. 3 of Burgasser et al. (2006a) or Leggett et al. (2007)), since lower metallicity shifts the -band flux density peak of submetallic brown dwarfs significantly blueward. Fig 5 shows no such shift, and the two objects therefore have similar metallicities.
Fig. 7 overlays the observed CFBDS0059 spectrum with the synthetic spectrum for the closest point of the solar metallicity atmospheric model grid. Except on the red side of the -band, model and observations agree well, boosting our confidence in the derived atmospheric parameters. The main remaining predictive shortcoming of the models is their overestimated absorption on the red side of the -band peak. The principal opacity source in this region is the methane band centred at , for which comprehensive theoretical predictions are available, but only for transitions from the vibrational ground state (as will be discussed in detail in Homeier et al., in preparation). To make up for the missing absorption from higher bands, which constitutes a significant fraction of the opacity at brown dwarf temperatures, a constant empirical correction factor was used. This correction must in turn lead to some overestimate of the CH4 absorption as we reach the lower end of the T dwarf temperature range. Another possible source of errors are uncertainties in the models’ temperature profile. The BT-Settl models self-consistently describe gravitational settling, convective turbulence, advection, condensation, coalescence and coagulation of condensates to predict the formation and vertical extent of cloud layers (Allard et al. 2003; Helling et al. 2007). In late T dwarfs these clouds are predicted to reside deep in the optically thick part of the atmosphere. Their opacity is thus not directly visible in the spectrum, but it may still impact the thermal structure, and thus the relative abundance especially of temperature-sensitive species like CH4.
Another (less serious) disagreement between the models and the observed spectra occurs in the band. The models overestimate the flux on the blue side of the -peak, and they imperfectly reproduce the general shape of the peak. As discussed below, the opacities in that band are dominated by pressure-broadened wings of the 0.77 K I line on the blue side and CH4 on the red side.
For Baraffe et al. (2003) evolutionary models, the T570-670K and 4.45-5.05 determined above translate into an age of 1-5 Gyr and a mass of 15MJup (for 1 Gyr) to 30MJup (for 5 Gyr). The kinematics of CFBDS0059 suggests that it belongs to an older population, and therefore slightly favour a higher mass and older age.
5.2 Individual spectral features
Fig. 5 zooms on the , and -band peaks of the four cool brown dwarf spectra. The published OSIRIS spectra of Gl 570D and 2M0415 do not cover the band, which instead is plotted from the lower resolution spectra of Geballe et al. (2001) and Knapp et al. (2004). For easier comparison, the CFBDS0059 and ULAS0034 -band spectra are smoothed to that resolution.
Direct comparison of the four spectra can be used to shed light on incipient new features and atmospheric chemistry. Features which are seen in both CFBDS0059 and ULAS0034 are likely to be real even when their significance is modest in each object, and those which are absent or weaker in the two hotter brown dwarfs, can reasonably be assigned to low temperature molecules. Conversely, features which disapear in the two cooler objects trace higher temperature species.
As discussed above, the -band spectra of CFBDS0059 and ULAS0034 do not differ much. Given the strong sensitivity of that band to [M/H] that implies that the two objects have similar chemical compositions. The shape of the -band peaks of these two coolest brown dwarfs on the other hand differ from that of Gl 570D and 2M0415, with the CFBDS0059 and ULAS0034 peaks extending further into the blue. The dominant absorbers in the blue wings of the -band peak is the pressure-broadened wing of the 0.77 m K I line (e.g. Burgasser et al. 2006a), which must weaken as K I depletes from the gas phase under Teff=700K. As anticipated by Leggett et al. (2007), the slope of the blue side of the -band peak therefore shows good potential as an effective temperature diagnostics beyond spectral type T8.
The strength of the J-band K I doublet is a good gravity estimator in ultracool dwarfs (e.g. Knapp et al. 2004), because an increased pressure at a fixed temperature favors KCl over K (Lodders (1999)) and consequently weakens atomic potassium features. At T 750-800K the the -band K I doublets remain weakly visible and useful as a gravity proxy (Fig. 7 of Knapp et al. (2004)). At T 700K on the other hand, the K I doublets have completely vanished at the resolution of the current spectra (Fig. 5), even at the probably lower gravity of ULAS0034. Potassium is thus mostly converted to KCl (or perhaps other compounds) in the relevant photospheric layers.
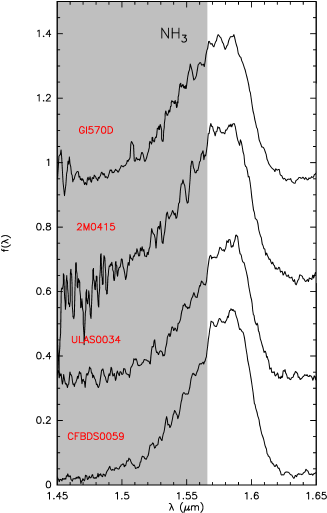
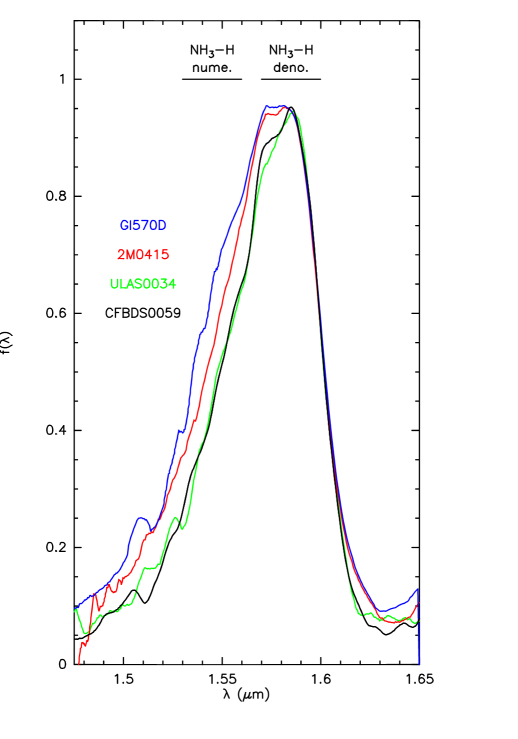
The strongest new feature is wide absorption on the blue side of the -band, at . It is conspicuous in CFBDS0059 and well detected in ULAS0034, and with hindsight is weakly visible in the 2M0415 spectrum (Fig. 5). It is however clearly stronger at T 700K. To visually emphasize this broad feature, we bin the spectra to R=100 and overlay the four H-band spectra (Fig. 8, left panel). Absorption sets in at and becomes deeper for . These wavelengths overlap with strong H2O and NH3 bands. Either molecule could a priori be responsible for the absorption.
 |
 |
5.3 Near infrared ammonia signatures
Those molecules unfortunately have imperfect opacity data, and the NH3 laboratory line lists in particular are incomplete below m. Computed ammonia opacities are therefore strictly lower limits. Leggett et al. (2007) compare synthetic spectra computed with and without NH3 opacity, using the Irwin et al. (1999) line list for m, and find that ammonia absorption in cold brown dwarfs strongly depletes the blue wing of the band (their Fig.10). Similarly, Fig. 9 of Saumon et al. (2000) plots synthetic -band spectra with and without NH3 opacity, and find differences in two wavelength ranges: the NH3-rich model is significantly more absorbed for m and it has weaker but significant absorption in the range.
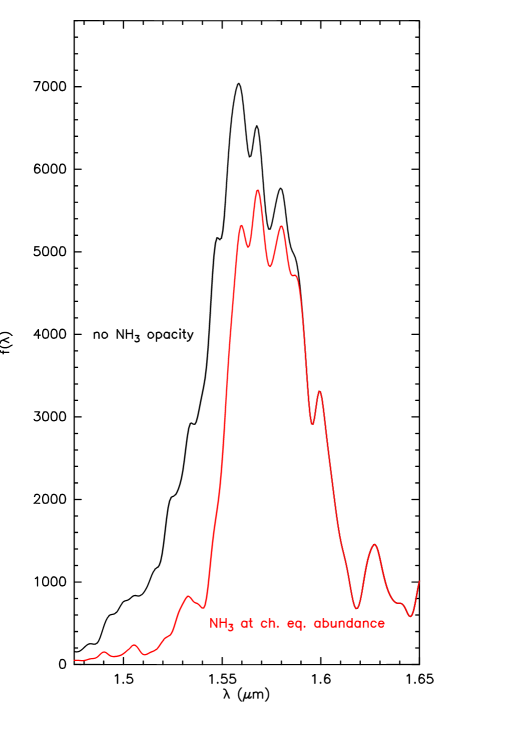
Fig 8 right panel plots two BT-Settl models for [K; ], without any near-infrared NH3 opacity, and with NH3 opacity for that molecule at its chemical equilibrium abundance. As discussed above the BT-Settl models do not reproduce the observed -peak shape very well, and a quantitative comparison is thus difficult. The comparison of the two models nonetheless confirms the Saumon et al. (2000) conclusion that ammonia produces strong absorption below m and weaker residual out to 1.595m. These model predictions qualitatively match the behaviour seen in Fig 8, left panel.
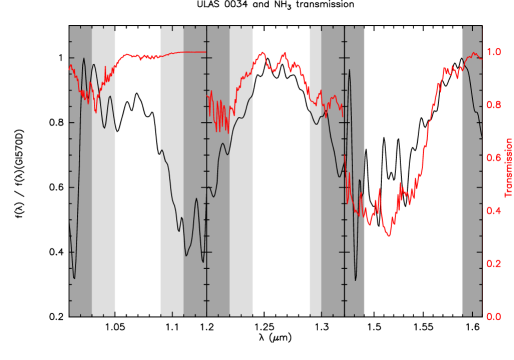
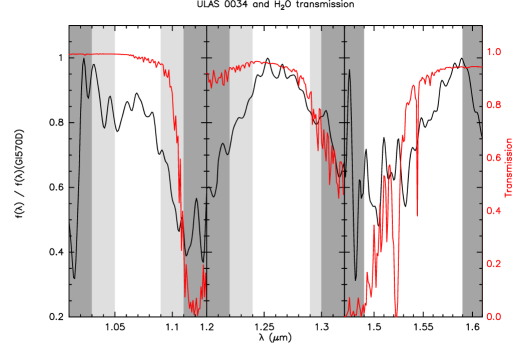
To emphasize the changes in brown dwarfs spectra when their effective temperature decreases from 800 to 600 K, we plot in Fig 9 the ratio of the spectra of CFBDS0059 and Gl 570D. The signal to noise ratio of the resulting -band spectrum is too low for detailed analysis, and we therefore focus on the , and flux peaks. To avoid confusion from changes in the temperature-sensitive methane bands, we also mostly ignore the parts of the spectrum affected by CH4 absorption bands, hatched in dark and light grey for respectively stronger and weaker bands. Fig. 10 shows the equivalent plot for ULAS0034, which is very similar.
The -band spectrum ratio prominently shows the new absorption band, which outside the CH4 band closely matches the 300 K NH3 transmission spectrum of Irwin et al. (1999). Both spectra are strongly absorbed between 1.49 and 1.52 m and rebound from 1.52 to 1.57m. Water absorption, by contrast, is a poor match to the features of spectrum ratio. The strongest water absorption (as computed from the HITRAN molecular database for a 600 K temperature) occurs below 1.49m, at significantly bluer wavelengths than the CFBDS0059 absorption feature.
Some weaker but still significant bands of the Irwin et al. (1999) laboratory ammonia spectrum occur in the band. Those again match features of the CFBDS0059/Gl 570D flux ratio, but that agreement is much less conclusive: water and ammonia absorptions overlap on the red side -band peak, and CH4 absorption affects the blue side of the peak. A 1.25-1.27 m feature is seen on both flux ratios and on the ammonia transmission, and could be due to ammonia since it is clear of any strong H2O absorption band. The slight wavelength shift between the laboratory and observed features however leaves that association uncertain. Detailed synthetic spectra based on fully reliable opacities will be needed to decide whether NH3 absorption matters in the band at the effective temperature of CFBDS0059. The main pattern in the -band is a blue slope, which reflects the weaker pressure-broadened K I wing in the cooler brown dwarf. The weak 1.03m NH3 band is not seen.
 |
 |
 |
 |
Ammonia is easily detected in mid-infrared SPITZER spectra for all spectral types cooler than T2 (Roellig et al. 2004; Cushing et al. 2006), though significantly weaker than initially expected because mixing from lower atmospheric levels reduces its abundance in the high atmosphere below the local equilibrium value (Saumon et al. 2006). Weak near-infrared absorption by ammonia has been tentatively detected by Saumon et al. (2000) in the T7p dwarfs Gl 229B, but CFBDS0059 and ULAS0034 provide the first incontrovertible evidence for a strong near-infrared NH3 band in brown dwarf spectra.
This conclusion contrasts with Warren et al. (2007) finding possible but inconclusive evidence for ammonia in ULAS0034. The main difference between the two analyses is that Warren et al. (2007) focused on a higher resolution search, at a necessarily lower signal to noise ratio, for individual NH3 lines between 1.5 and 1.58m. We instead looked for the global signature of the absorption band, which only becomes obvious when looking at the full -band spectrum.
5.4 Spectral type
Table 3 lists for CFBDS0059 the spectral indices used by the spectral classification scheme of Burgasser et al. (2006b), which refines the previous schemes of Geballe et al. (2002) and Burgasser et al. (2002). These indices would imply a T8 classification, identical to that of 2M0415. As discussed above however, the near-infrared spectrum of CFBDS0059 demonstrates that it is over 100 K cooler than 2M0415 and shows clearly different spectral features. Based on the new indices we present later, CFBDS0059 should be assigned a later spectral type. The almost identical Burgasser et al. (2006b) indices of the two brown dwarfs instead reflect those indices measuring H2O and CH4 absorption bands which saturate and lose their effective temperature sensitivity at the T8 spectral type of 2M0415. Beyond T8 the Burgasser et al. (2006b) classification scheme therefore needs to be extended, with new spectral indicators that do not saturate until significantly later spectral types.
| Spectral | numerator | denominator | value | spectral | value | spectral |
|---|---|---|---|---|---|---|
| indice | wavelength | wavelength | type | type | ||
| m | CFBDS0059 | ULAS0034 | ||||
| H2O- | 1.14-1.165 | 1.26-1.285 | 0.0290.005 | T8 | 0.0120.007 | T8 |
| CH4- | 1.315-1.34 | 1.26-1.285 | 0.1650.005 | T8 | 0.0140.009 | T8 |
| H2O- | 1.48-1.52 | 1.56-1.60 | 0.1190.008 | T8 | 0.1330.010 | T8 |
| CH4- | 1.635-1.675 | 1.56-1.60 | 0.0840.002 | T8 | 0.0960.006 | T8 |
| CH4- | 2.215-2.255 | 2.08-2.12 | 0.1280.037 | T7 | 0.0910.015 | T7 |
| 2.06-2.10 | 1.25-1.29 | 0.1010.002 | 0.1280.003 | |||
| WJ | 1.18-1.23 | 1.26-1.285 | 0.2570.004 | 0.2620.006 | ||
Fully defining this extension is beyond the scope of the present paper, since two known objects beyond T8 are not enough to explore spectral variability, but one can nonetheless start exploring. Since the main new feature is NH3 absorption in the blue wings of the -band peak, we define a new NH3- index as
| (1) |
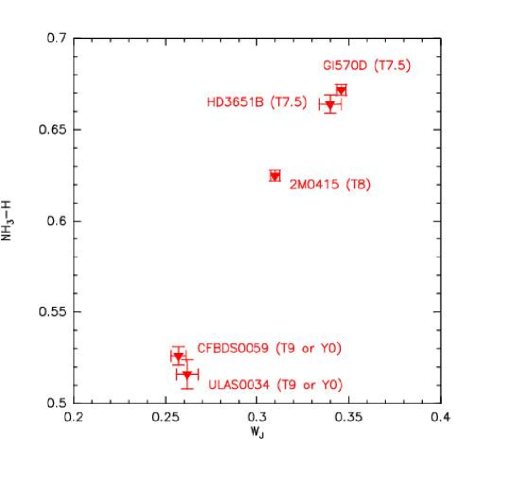
Its numerator and denominator range are plotted in Fig 8. The numerator integrates the flux within the main NH3 band and its denominator measures the bulk of the -band peak (we note that in cooler objects, the denominator could be affected by some NH3 absorption; its integration boundaries might thus need to be refined after such objects have been discovered). We compute this index for Gl 570D, HD3651B, 2M0415, ULAS0034 and CFBDS0059 (Table 4), and find that it strongly decreases from Gl570D to ULAS0034 and CFBDS0059 (which have very similar NH3-).
| Gl570D | HD3651B | 2M0415 | ULAS0034 | CFBDS0059 | |
|---|---|---|---|---|---|
| NH3- | 0.6720.008 | 0.660.005 | 0.6250.003 | 0.5160.008 | 0.5260.005 |
| Spec. Type | T7.5(1) | T7.5(1) | T8(1) | T9 or Y0(2) | T9 or Y0(2) |
Over the limited effective temperature range spanned by Gl570D, HD3651B, 2M0415, ULAS0034 and CFBDS0059, and as far as one can infer from just 5 examples, the NH3- and WJ indices correlate strongly (Fig. 11). The numerator of WJ is centered at wavelengths where both ammonia (Fig. 10 of Leggett et al. (2007)) and CH4 have significant opacity, and future modeling work should be able to establish whether the two indices probe the same molecule or not. Since the near-infrared spectra of ULAS0034 and CFBDS0059 differ significantly more from that of the T8 2M0415 than the latter differs from the T7.5 Gl570D (as quantitatively demonstrated by Fig. 11), it is natural to assign a full spectral subtype to the interval between the two coolest brown dwarfs and 2M0415. By that reasoning, and if ULAS0034 and CFBDS0059 are considered as T dwarfs, their spectral type should be T9, or perhaps slightly later.
The T spectral class however is quite unlikely to remain the last spectral type, since for sufficiently low effective temperatures atmospheric models predict major changes in visible and near-infrared brown dwarf spectra: NH3 bands are predicted to appear in, and eventually to dominate, the near-infrared spectrum, the strong pressure-broadened optical lines of Na I and K I are predicted to disappear as those atomic species get incorporated into molecules and solids, and water clouds are predicted to form and to largely deplete water from the gas phase (Burrows et al. 2003; Kirkpatrick 2005). Since spectral classification, for mostly practical reasons, is traditionally based on optical and near-infrared spectra, such a major transition will justify the introduction of a new spectral type, for which the Y letter has long been reserved (Kirkpatrick et al. 1999; Kirkpatrick 2000). If the m NH3 band keeps deepening as the effective temperature decreases further, and eventually becomes a major spectral feature, its appearance at 650 K will become a natural transition between the T and Y spectral classes. ULAS0034 and CFBDS0059 would then be the first Y dwarfs, and the prototypes for Y0 brown dwarfs, rather than T9. That decision will to some extent remain a matter of convention, but it must in any case wait until larger numbers of similarly cool brown dwarfs can document spectral trends in finer detail, and preferably over a wider effective temperature range.
6 Summary and conclusions
We have reported the discovery of CFBDS0059, a very cool brown dwarf, discovered in the CFBDS survey (Delorme et al. 2008). Its effective temperature is 5015 K cooler than that of ULAS0034, most likely making it the coolest brown dwarf known at the present time. High spatial resolution imaging establishes than CFBDS0059 has no similarly bright companion beyond 0.09”, and no companion with a contrast under 3.5 magnitude beyond 0.3” (respectively 1.2 and 3.9 AU at the 13 pc photometric distance). Its kinematics suggest, with significant error bars, a 4 Gyr age at which CFBDS0059 would be a 30MJup brown dwarf. The atmospheric parameters of CFBDS0059 however are compatible with any age from 5 Gyr down to 1 Gyr, for which its mass would be 15MJup. A trigonometric parallax measurement together with mid-infrared photometry and spectroscopy with SPITZER will significantly refine its physical parameters, as demonstrated by Saumon et al. (2007) for slightly warmer brown dwarfs.
We assign absorption in the blue wing of the -band peaks of both ULAS 0034 and CFBDS 0059 to an NH3 band. If that assignment is confirmed, and if, as we expect, the band deepens at still lower effective temperatures, its development would naturally define the scale of the proposed Y spectral class. ULAS 0034 and CFBDS 0059 would then become the prototypes of the Y0 sub-class.
The CFBDS survey has to date identified two brown dwarfs later than T8, CFBDS0059 and ULAS0034 (which we identified independently of Warren et al. (2007), Delorme et al. (2008)) in the analysis of approximately 40% of its final 1000 square degree coverage. We therefore expect to find another few similarly cool objects, and hopefully one significantly cooler one.
CFBDS0059 and ULAS0034 provide a peek into the atmospheric physics for conditions that start approching those in giant planets, and the future discoveries that can be expected from CFBDS, ULAS, and Pan-STARRS will further close the remaining gap. They also bring into a sharper light the remaining imperfections of the atmopsheric models, and emphasize in particular the importance of more complete opacity data. Our analysis relies on a room temperature absorption NH3 spectrum, but higher excitation bands than can be excited at 300 K must matter in Teff = 600 K brown dwarfs. The eventual identification of ammonia absorption in the band will also need complete opacity information for H2O and CH4 and full spectral synthesis, since the bands of the three molecules overlap in that spectral range.
The spectral indices that define the T dwarf spectral class saturate below 700 K, and new ones will be needed at lower effective temperatures. We introduce one here, NH3-, which measures the likely NH3 absorption in the band. Together with the index of Warren et al. (2007) and the slope of the blue side of the -band peak (Leggett et al. 2007), it will hopefully define a good effective temperature sequence. Metallicity and gravity diagnostics are less immediately apparent, but will need to be identified as well.
Acknowledgements.
We are grateful to our referee, Sandy Leggett, for her very detailed report and numerous suggestions which significantly improved this paper. We would like to thank the observers and queue coordinators who carried our service observations at CFHT (programs 05BC05,06AC20,07BD97) and Gemini-North (GN-2007A-Q-201, GN-2007B-Q-3). We also thanks the NTT and Keck Observatory support astronomers for their help during the observations which led to these results. We thank S. Leggett and S Warren for providing their spectrum of ULAS0034 in a convenient numerical format, and Sandy Leggett for communicating spectra of 2M0415 and Gl 570D and the room temperature absorption spectrum of NH3. We would also like to thank David Ehrenreich for providing us the computed 600 K water absorption. Financial support from the ”Programme National de Physique Stellaire” (PNPS) of CNRS/INSU, France, is gratefully acknowledged. MCL acknowledges support for this work from NSF grant AST-0507833 and an Alfred P. Sloan Research Fellowship.References
- Allard et al. (2003) Allard, F., Guillot, T., Ludwig, H.-G., et al. 2003, in IAU Symposium, Vol. 211, Brown Dwarfs, ed. E. Martín, 325–+
- Baraffe et al. (2003) Baraffe, I., Chabrier, G., Barman, T. S., Allard, F., & Hauschildt, P. H. 2003, A&A, 402, 701
- Bertin & Arnouts (1996) Bertin, E. & Arnouts, S. 1996, A&AS, 117, 393
- Boulade et al. (2003) Boulade, O., Charlot, X., Abbon, P., et al. 2003, in Presented at the Society of Photo-Optical Instr umentation Engineers (SPIE) Conference, Vol. 4841, Instrument Design and Performance for Optical/I nfrared Ground-based Telescopes. Edited by Iye, Masanori; M oorwood, Alan F. M. Proceedings of the SPIE, Volume 4841, pp. 72-81 (2003)., ed. M. Iye & A. F. M. Moorwood, 72–81
- Burgasser et al. (2006a) Burgasser, A. J., Burrows, A., & Kirkpatrick, J. D. 2006a, ApJ, 639, 1095
- Burgasser et al. (2006b) Burgasser, A. J., Geballe, T. R., Leggett, S. K., Kirkpatrick, J. D., & Golimowski, D. A. 2006b, ApJ, 637, 1067
- Burgasser et al. (2002) Burgasser, A. J., Kirkpatrick, J. D., Brown, M. E., et al. 2002, ApJ, 564, 421
- Burgasser et al. (2000) Burgasser, A. J., Kirkpatrick, J. D., Cutri, R. M., et al. 2000, ApJ, 531, L57
- Burgasser et al. (2003) Burgasser, A. J., McElwain, M. W., & Kirkpatrick, J. D. 2003, AJ, 126, 2487
- Burrows et al. (2003) Burrows, A., Sudarsky, D., & Lunine, J. I. 2003, ApJ, 596, 587
- Chabrier et al. (2000) Chabrier, G., Baraffe, I., Allard, F., & Hauschildt, P. 2000, ApJ, 542, 464
- Cushing et al. (2006) Cushing, M. C., Roellig, T. L., Marley, M. S., et al. 2006, ApJ, 648, 614
- Delorme et al. (2008) Delorme, P., Willott, C. J., Forveille, T., et al. 2008, A&A(submitted), 0, 0
- Devillard (1997) Devillard, N. 1997, The Messenger, 87, 19
- Geballe et al. (2002) Geballe, T. R., Knapp, G. R., Leggett, S. K., et al. 2002, ApJ, 564, 466
- Geballe et al. (2001) Geballe, T. R., Saumon, D., Leggett, S. K., et al. 2001, ApJ, 556, 373
- Helling et al. (2007) Helling, C., Ackerman, A., Allard, F., et al. 2007, ArXiv e-prints, 711
- Hodapp et al. (2003) Hodapp, K. W., Jensen, J. B., Irwin, E. M., et al. 2003, PASP, 115, 1388
- Irwin et al. (1999) Irwin, P. G. J., Calcutt, S. B., Sihra, K., et al. 1999, Journal of Quantitative Spectroscopy and Radiative Transfer, 62, 193
- Kirkpatrick (2000) Kirkpatrick, J. D. 2000, in Astronomical Society of the Pacific Conference Series, Vol. 212, From Giant Planets to Cool Stars, ed. C. A. Griffith & M. S. Marley, 20–+
- Kirkpatrick (2005) Kirkpatrick, J. D. 2005, ARA&A, 43, 195
- Kirkpatrick et al. (1999) Kirkpatrick, J. D., Reid, I. N., Liebert, J., et al. 1999, ApJ, 519, 802
- Knapp et al. (2004) Knapp, G. R., Leggett, S. K., Fan, X., et al. 2004, AJ, 127, 3553
- Leggett et al. (2007) Leggett, S. K., Marley, M. S., Freedman, R., et al. 2007, ApJ, 667, 537
- Liu et al. (2007) Liu, M. C., Leggett, S. K., & Chiu, K. 2007, ApJ, 660, 1507
- Lodders (1999) Lodders, K. 1999, ApJ, 519, 793
- Monet et al. (2003) Monet, D. G., Levine, S. E., Canzian, B., et al. 2003, AJ, 125, 984
- Pravdo et al. (2006) Pravdo, S. H., Shaklan, S. B., Wiktorowicz, S. J., et al. 2006, ApJ, 649, 389
- Puget et al. (2004) Puget, P., Stadler, E., Doyon, R., et al. 2004, in Presented at the Society of Photo-Optical Instrumentation Engineers (SPIE) Conference, Vol. 5492, Ground-based Instrumentation for Astronomy. Edited by Alan F. M. Moorwood and Iye Masanori. Proceedings of the SPIE, Volume 5492, pp. 978-987 (2004)., ed. A. F. M. Moorwood & M. Iye, 978–987
- Robin et al. (2003) Robin, A. C., Reylé, C., Derrière, S., & Picaud, S. 2003, A&A, 409, 523
- Roellig et al. (2004) Roellig, T. L., Van Cleve, J. E., Sloan, G. C., et al. 2004, ApJS, 154, 418
- Saumon et al. (2000) Saumon, D., Geballe, T. R., Leggett, S. K., et al. 2000, ApJ, 541, 374
- Saumon et al. (2006) Saumon, D., Marley, M. S., Cushing, M. C., et al. 2006, ApJ, 647, 552
- Saumon et al. (2007) Saumon, D., Marley, M. S., Leggett, S. K., et al. 2007, ApJ, 656, 1136
- Scholz et al. (2003) Scholz, R.-D., McCaughrean, M. J., Lodieu, N., & Kuhlbrodt, B. 2003, A&A, 398, L29
- Simons & Tokunaga (2002) Simons, D. A. & Tokunaga, A. 2002, PASP, 114, 169
- Stephens & Leggett (2004) Stephens, D. C. & Leggett, S. K. 2004, PASP, 116, 9
- Tokunaga et al. (2002) Tokunaga, A. T., Simons, D. A., & Vacca, W. D. 2002, PASP, 114, 180
- Tokunaga & Vacca (2005) Tokunaga, A. T. & Vacca, W. D. 2005, PASP, 117, 421
- van Dam et al. (2006) van Dam, M. A., Bouchez, A. H., Le Mignant, D., et al. 2006, PASP, 118, 310
- Warren et al. (2007) Warren, S. J., Mortlock, D. J., Leggett, S. K., et al. 2007, MNRAS, 381, 1400
- Willott et al. (2007) Willott, C. J., Delorme, P., Omont, A., et al. 2007, AJ, 134, 2435
- Wizinowich et al. (2006) Wizinowich, P. L., Le Mignant, D., Bouchez, A. H., et al. 2006, PASP, 118, 297