Physical Properties of Tidal Features in Interacting Disk Galaxies
Abstract
We investigate the physical properties of tidal structures in a disk galaxy created by gravitational interactions with a companion using numerical -body simulations. We consider a simple galaxy model consisting of a rigid halo/bulge and an infinitesimally-thin stellar disk with Toomre parameter . A perturbing companion is treated as a point mass moving on a prograde parabolic orbit, with varying mass and pericenter distance. Tidal interactions produce well-defined spiral arms and extended tidal features such as bridge and tail that are all transient, but distinct in nature. In the extended disks, strong tidal force is able to lock the perturbed epicycle phases of the near-side particles to the perturber, shaping them into a tidal bridge that corotates with the perturber. A tidal tail develops at the opposite side as strongly-perturbed, near-side particles overtake mildly-perturbed, far-side particles. The tail is essentially a narrow material arm with a roughly logarithmic shape, dissolving with time because of large velocity dispersions. Inside the disks where tidal force is relatively weak, on the other hand, a two-armed logarithmic spiral pattern emerges due to the kinematic alignment of perturbed particle orbits. While self-gravity makes the spiral arms a bit stronger, the arms never become fully self-gravitating, wind up progressively with time, and decay after the peak almost exponentially in a time scale of Gyr. The arm pattern speed varying with both radius and time converges to at late time, suggesting that the pattern speed of tidally-driven arms may depend on radius in real galaxies. Here, and denote the angular and epicycle frequencies, respectively. We present the parametric dependences of various properties of tidal features on the tidal strength, and discuss our findings in application to tidal spiral arms in grand-design spiral galaxies.
1 Introduction
Spiral arms are the most outstanding morphological features in disk galaxies. They not only provide information on the dynamical states of the background stellar disks but also affect galactic evolution by triggering large-scale star formation in the gaseous component (see Elmegreen 1995; Bertin & Lin 1996; see also McKee & Ostriker 2007 and references therein). Regarding the nature of the spiral structure, two pictures have been proposed. In one picture, the arms are viewed as quasi-stationary density waves that live long, rotating almost rigidly around the galactic centers (Lin & Shu, 1964, 1966). Nonaxisymmetric instability of the stellar disks may grow to form a sort of self-sustained standing density waves in stellar disks (Bertin et al., 1989a, b; Bertin & Lin, 1996). In the other picture, the arms are transient features driven, for example, by gravitational interaction with a companion galaxy (Toomre, 1969; Toomre & Toomre, 1972) or by swing amplification of leading waves (Julian & Toomre, 1966; Goldreich & Lynden-Bell, 1965; Toomre, 1981). In this case, spiral features are short lived, lasting only for several rotation periods ( Gyr) and perhaps requiring intermittent external forcing (e.g., Sellwood & Carlberg 1984).
Observations indicate that the probability to have grand-design arms is much higher for galaxies in binaries or groups than in the field (Kormendy & Norman, 1979; Elmegreen & Elmegreen, 1982, 1987). This suggests that regardless of their nature, some of grand-design spiral arms are clearly excited by nearby galaxies through tidal interactions. Prototypical examples include M51 and M81 that possess, respectively, companion galaxies NGC5195 and M82 within 50 kpc in distance. In a pioneering work, Toomre & Toomre (1972) used non-interacting test-particle simulations to demonstrate that gravitational interaction of a disk galaxy with its companion generates features such as tidal bridge and tail which are commonly seen in extended disks of interacting galaxies. Inclusion of self-gravity tends to enhance spiral structure in the disks (e.g., Hernquist 1990). Grand-design spiral arms can be produced even by a low-mass perturber if the interaction involves a very close passage, indicating that tidal arms may be more frequent than previously thought (Byrd & Howard, 1992).
Since Toomre & Toomre (1972), there have been many numerical studies of tidal interactions of galaxies, including the detailed modelings of the arm morphologies in the M51/NGC5195 system (e.g., Hernquist 1990; Howard & Byrd 1990; Barnes 1998; Salo & Laurikainen 2000a, b; Durrell et al. 2003) and in the NGC 7753/7752 system (Salo & Laurikainen, 1993), formation of tidal tails and tidal dwarf galaxies therein (e.g., Barnes & Hernquist 1992, 1996; Elmegreen et al. 1993; Wetzstein et al. 2007), and formation of bars at the central parts of galaxies (e.g., Noguchi 1987; Gerin et al. 1990). In particular, by using numerical simulations with self-gravitating stars and gas, Salo & Laurikainen (2000a) argued that a bound multiple-passage orbit of NGC5195 better reproduces the observed kinematics of an extended H I tail of M51 (Rots et al., 1990), whereas the radial velocity data of the planetary nebulae associated with the tidal structures favor an unbound single-passage orbit (Durrell et al., 2003). Although these authors considered primarily the outer, extended tidal features for comparison, the spiral arms in the main disk may more tightly constrain the orbital parameters of the M51 system. This is because the structure and kinematics of tidal tails depend rather sensitively on the observationally uncertain parameters such as a halo mass distribution (Dubinski et al., 1996).
While the aforementioned work has improved our understanding of the tidally-induced morphological changes of galaxies chiefly in extended disks, these studies did not focus on spiral structures in the main disks that are more relevant to large-scale star formation. Stellar spiral arms are certainly one of the main agents that greatly influence dynamical evolution of the interstellar gas in disk galaxies. Since the turbulent and thermal sound speeds of the gas are small, the gas responds very strongly to the gravitational potential perturbations imposed by the stellar spiral arms, readily forming galactic spiral shocks near the potential minima (Roberts, 1969; Shu, Milione, & Roberts, 1973; Woodward, 1975). In optical images, these shocks appear as narrow dust lanes that represent regions where giant molecular clouds and new stars form (e.g., Elmegreen & Elmegreen 1983; Vogel et al 1988; Rand 1993; Elmegreen 1994; Shetty et al. 2007). Nonaxisymmetric gravitational instability occurring inside the dust lanes (e.g., Balbus 1988; Kim & Ostriker 2002, 2006; Shetty & Ostriker 2006) is most likely responsible for observed arm substructures including gaseous spurs (or feathers) that jut perpendicularly from the arms (e.g., Scoville et al. 2001; Willner et al. 2004; Calzetti et al. 2005; La Vigne et al. 2006).
The strength of spiral shocks and their susceptibility to gravitational instability are strongly affected by the physical properties of stellar arms such as amplitude, pitch angle, pattern speed, etc, yet it is quite difficult to characterize them observationally. While the arm pitch angle can be determined relatively straightforwardly if the inclination of a galaxy is known, it is challenging to measure the pattern speed unambiguously. For instance, the Tremaine & Weinberg (1984) method that has been applied to the CO data of several grand-design spiral galaxies (e.g., Zimmer et al. 2004) assumes, among others, that the pattern speed is independent of radius and that the molecular gas satisfies the mass conservation equation. In the case of M51, however, a recent study by Shetty et al. (2007) shows that observed density and velocity profiles across the disk do not obey the continuity equation in any frame rotating at a fixed angular speed. Also, the strength of spiral arms determined from K-band observations is prone to contamination by red supergiants in the arm regions (e.g., Rix & Rieke 1993; Patsis et al. 2001). Given these observational uncertainties, it is desirable to run numerical simulations to pin down the arm parameters and thus access the connection between stellar arms and large-scale star formation in gaseous arms.
Motivated by these considerations, we in this paper use numerical -body simulations to explore in detail the properties of stellar spiral arms resulting from tidal interactions. Since the parameter space is large, we consider an idealized galaxy model in which an infinitesimally-thin, two-dimensional, exponential stellar disk is immersed in a combined potential due to rigid halo and bulge. Self-gravitating particles comprising the disk respond to a point-mass perturber that passes on a prograde parabolic orbit in the same plane as the disk rotation; we vary the mass and pericenter distance of the perturber to study the situations with various tidal strength. The particles are not allowed to move out of the disk plane, and the effect of gas is ignored. A fully self-consistent treatment of the problem, using active halo and bulge as well as three-dimensional disks consisting of both stars and gas, will be studied in subsequent papers. Similar simulations have been carried out by Elmegreen et al. (1991) who showed that a cold stellar disk (with zero velocity dispersion) turns into a transient ocular shape if tidal perturbations are strong. In this work, we instead consider a disk galaxy with realistic velocity dispersions. Our main objectives are to study the quantitative changes in the properties of spiral arms as the tidal strength varies, and also to clarify the development and physical nature of tidal features known as bridge and tail in extended disks.
This paper is organized as follows. Section 2 describes the galaxy model and the orbital parameters of tidal interactions as well as the numerical method we use. In §3, we focus on the transient extended-disk structures produced by strong tidal perturbations and show that the tidal bridge and tail form by distinct mechanisms. In §4, we measure the properties (pitch angle, strength, and pattern speed) of the spiral arms and present their temporal and radial variations. Finally, we summarize our results and discuss their astronomical implications in §5.
2 Model and Numerical Method
2.1 The Model Galaxy
In this paper we investigate the generation of tidal features and their properties in a disk galaxy via gravitational interactions with a point-mass perturber. The disk galaxy consists of three components: a spherical “dark” halo, a spherical bulge, and an exponential stellar disk; we do not consider a gaseous disk in the current work. The halo and bulge accounting for the inner linearly-rising part and the outer nearly-flat part of the rotation curve are represented by fixed gravitational potentials for simplicity. This will ignore the potential consequences on the disk through the tidal deformation of the halo and bulge.111Since the velocity dispersions of dark matter particles are usually much larger than those of disk stars, the impact of the perturber to the disk through the live halo and bulge is small, as confirmed by Salo & Laurikainen (2000b). On the other hand, this inert halo and bulge enables a large number of particles for the stellar disk. In order to maximize the particle number for stars near the disk midplane, we impose a constraint that the disk remains infinitesimally thin during its whole evolution.
Appendix A describes the specific model we employ for each component of the galaxy: a truncated logarithmic potential for the dark matter halo,222We have also run models without halo truncation and checked that the properties of tidal features inside 25 kpc are almost indistinguishable from those under the truncation. a Plummer potential for the spherical bulge, and an exponential density profile for the disk. The total galaxy mass of inside kpc is dominated by the halo; the disk takes 16% of the total. We realize the infinitesimally-thin disk by distributing equal-mass particles on the disk plane and by assigning to them random velocities corresponding to the Toomre parameter of . This value of fairly well represents the stellar disk in the solar neighborhood and is large enough to prevent spontaneous generation of spiral arms via swing amplification in the absence of tidal forcing (e..g., Sellwood & Carlberg 1984; Bertin et al. 1989b). Before applying tidal perturbations, we evolve the galaxy in isolation for two Gyrs to relax the phase space distribution into a global equilibrium. Appendix B presents the temporal evolution of an isolated disk and radial profiles of various quantities when an equilibrium is reached. We take the particle distribution at 1 Gyr and use it as an initial condition for tidal encounter experiments. This guarantees that morphological and structural changes of the disk occurring during interactions with the perturber are entirely due to tidal perturbations.
2.2 Perturber and Model Parameters
As a perturbing companion, we consider a point particle with mass that moves on a parabolic orbit relative to the center of the galaxy in a prograde fashion. To study the excitation of spiral arms as cleanly as possible (i.e. without disk warping and bending waves) and to be consistent with the thin-disk approximation, its trajectory is confined to the same plane as the galactic disk. Assuming that the galaxy whose center lies at is spherical, the relative orbit of the perturber in the polar coordinates is given parametrically by
| (1) |
| (2) |
where is the total galaxy mass within 25 kpc, , and is the pericenter distance (e.g., Press & Teukolsky 1977). Note that (or ) corresponds to the pericenter passage of the perturber.
To explore tidal encounters with various strength, we consider nine self-gravitating models that differ only in the mass and the pericenter distance of the perturber. We also run one non-self-gravitating model to study the effect of self-gravity on the arm properties. Table 1 lists the parameters of each model and some simulation outcomes. Column (1) labels each run. Columns (2) and (3) give the perturber masss relative to the total galaxy mass and the pericenter distance, respectively. Column (4) lists the dimensionless tidal strength parameter defined by
| (3) |
which measures the momentum imparted by the perturber to a disk particle at relative to its original angular momentum (Elmegreen et al., 1991). Here, is the time elapsed for the perturber to move over one radian near the pericenter relative to the galaxy center, and is the time taken by stars at to rotate one radian about the galaxy center. Columns (5) and (6) give the fractions of the disk particles that are captured by the companion and those escaping from the whole system, respectively. Column (7) gives the time when the tidal tail becomes strongest, while columns (8) and (9) list the pitch angle and surface density of the tail at . Finally, column (10) gives the peak strength of the spiral arms. Model A2* is identical to model A2 except that the self-gravity of density perturbations in the disk is artificially taken to zero in the former. Note that the self-gravitational potential of the unperturbed axisymmetric disk, as represented by equation (A4), is still included in model A2* to make the rotation curve intact. Models A1 and C3 correspond to the strongest and weakest encounters, respectively.
In our presentation, the units of length and velocity are and , respectively, which give the characteristic time unit of Gyr. All the simulations run from , corresponding to for our fiducial model A2, to . Seen from the above, the perturber passes through the pericenter at in the counterclockwise direction which is the same sense as the disk rotation.
2.3 Numerical Method
To evolve disk particles in response to tidal perturbations, we use the GADGET code that is parallelized on a distributed-memory platform (Springel et al., 2001). In GADGET, the evaluation of gravitational force uses the Barnes-Hut hierarchical tree algorithm (Barnes & Hut, 1986) and assumes a spline-softened mass distribution of a point mass. Except at the beginning of the simulations, GADGET employs a new cell-opening criterion , which produces, at a lower computational expense, force accuracy comparable to that obtained from the standard criterion . Here, and specify prescribed force error tolerances, and are the total mass and size of a cell, is the distance of a particle to the center-of-mass of the cell, and is the gravitational acceleration on the particle computed at the previous timestep. For all the models presented in this paper, we adopt and .
For the gravitational softening, we take a softening length of ; the equivalent Plummer softening length is (Springel et al., 2001). The relaxation time associated with the force softening amounts to , where and is the particle mass (Rybicki, 1971). Since this time is longer than 10 Gyrs for kpc and , tidal features that form in the stellar disk are not contaminated by particle noises and relaxation (e.g., White 1988). Particles are advanced by a second-order leapfrog scheme with fully adaptive and individual timesteps. All the simulations have been performed on an IBM p690 cluster using 16 processors, taking typically hours for a single run.
2.4 Limitations of This Work
In this work we employ highly idealized models of galaxies, perturbers, and their tidal encounters, and consider a limited range of tidal strength. This obviously introduces a few important caveats that should be noted from the outset:
-
1.
An infinitesimally-thin stellar disk imposed in the simulations neglects non-planar motions of stars such as in vertical oscillations and warps. It also overestimates self-gravity at the disk midplane.
-
2.
While a perturbing companion more likely has an extended density profile in real situations, we represent it as a point mass, which may overestimate the tidal force at the closest approach, possibly affecting the shape and structure of tidal bridge and tail that form in extended disks.
-
3.
Since we treat the galactic halo and bulge as being dynamically inactive, it is convenient to evolve the entire system in the coordinates centered on the center of the galaxy. This naturally ignores centrifugal and Coriolis forces that arise from the orbital motion of the galaxy relative to the center of mass of the whole system. The neglect of the indirect forces may spuriously suppress the growth of spiral modes in the stellar disk, where is the azimuthal wavenumber (e.g., Adams et al. 1989; Ostriker et al. 1992), although it is unlikely to much affect and higher order modes.
-
4.
By employing the prescribed parabolic orbit for a perturber, we neither consider the back reaction of the stellar disk to the perturber nor allow multiple encounters that would occur if the perturber is in a bound orbit. Furthermore, the prescribed orbit and the rigid halo and bulge do not allow us to capture the potential effects of dynamical friction and ensuing orbital decay of the interacting galaxies, which may make the tidal tails longer and stronger (see e.g., Barnes 1988).
-
5.
Limited to the cases with , tidal tails created in our models are relatively weak and survive only for Gyrs (see §3.2). The current weak- or moderate-encounter models preclude the possibility of prominent tails found in many interacting systems that live long ( Gyr or longer) and sometimes fragment into tidal dwarf galaxies (e.g., Barnes 1988, 1992; Barnes & Hernquist 1992; Wetzstein et al. 2007), which may occur when tidal interactions are very strong.
Given these constraints and limitations, we by no means attempt to reproduce tidal deformation of real galaxies. We instead focus on the formation mechanisms and physical nature of tidally-driven disk structures, and compare the simulation results with the predictions of analytic theories, for which the simplifications made above are appropriate.
3 Extended Tidal Features
Using a restricted three-body technique, Toomre & Toomre (1972) demonstrated that tidal perturbations distort the extended portions of a disk to produce elongated and narrow features, phenomenologically termed “bridge” and “tail”. The bridge is built at the near side of the disk toward the perturber, while the tidal tail or “counterstream” forms at the far side (e.g., Pfleiderer 1963). Self-consistent numerical simulations including the disk self-gravity show that tidal perturbations excite not only extended tidal streams but also spiral arms in the main disks (e.g., Hernquist 1990; Byrd & Howard 1992; Salo & Laurikainen 1993). In this section, we focus on extended tidal features and distinguish between the physical mechanisms that form bridge and tail, some of which have previously been overlooked.
3.1 Tidal Bridge
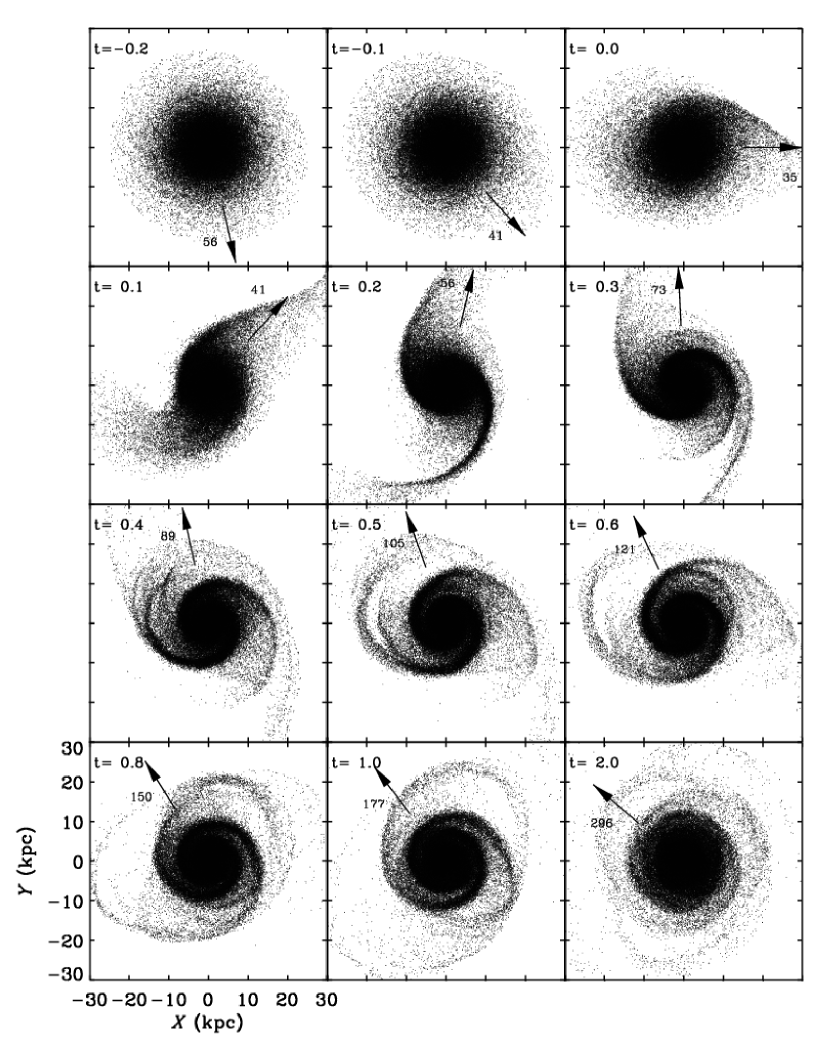
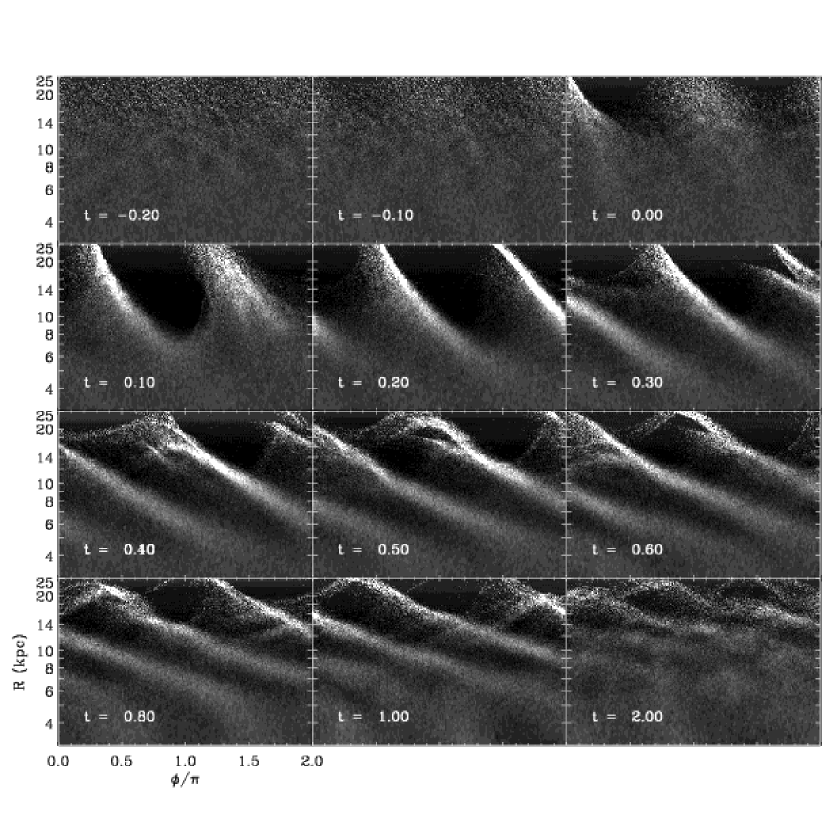
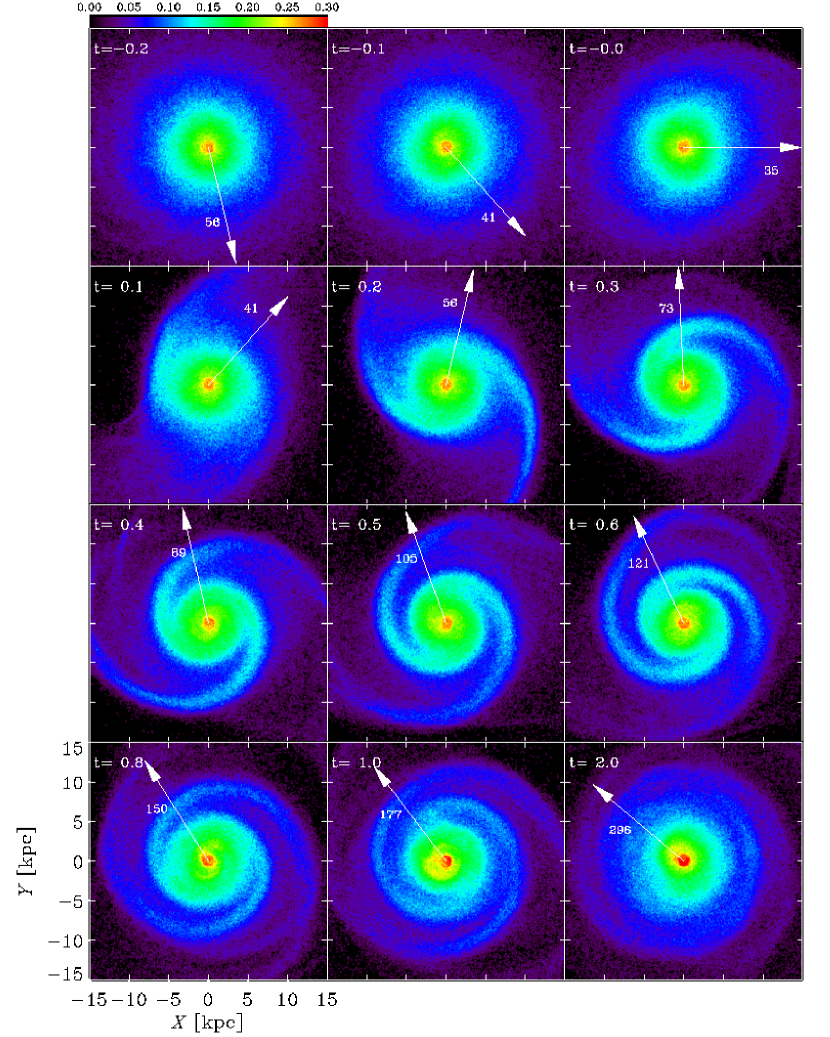
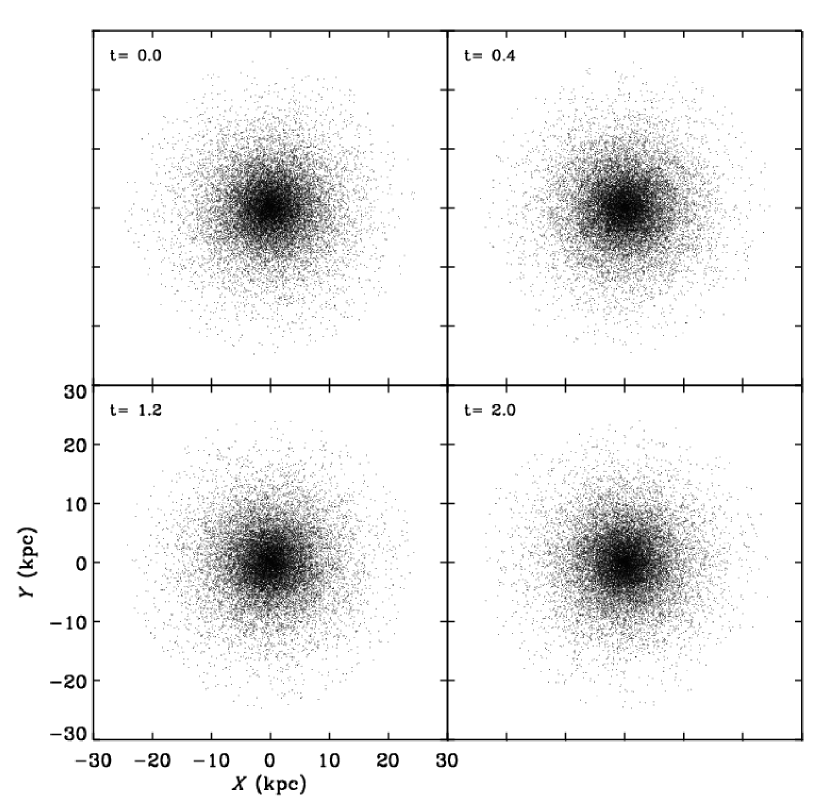
To illustrate the dynamical responses of extended disks to a tidal perturber, we begin by presenting in detail the results from our fiducial model A2 with and . Evolution of the other models are qualitatively similar. Figure 1 shows the morphological evolution of the stellar disk in model A2. The arrow and the associated number in each panel indicate the direction and distance (in kpc) to the perturber, respectively. Only 20% of the particles are plotted to delineate tidal features from the disk. Figure 2 displays the perturbed surface densities of model A2 in the plane. At early time when the perturber is far away from the galaxy (), the tidal deformation of the disk is vanishingly small. As the perturber approaches the pericenter, the disk begins to undergo significant morphological changes, first forming a bridge () at the outskirts of the disk close to the perturber and then a tail at the opposite side ().
Tidal force imposed by the perturber excites the epicycle orbits of individual particles. In Appendix C, we use an impulse approximation to estimate the amplitudes of the perturbed epicycle orbits in an averaged sense. Figure 3 plots as thin lines the resulting with differing based on the impulse approximation. The thick line is for the case with no tidal perturbations in which the radial oscillations of particles are purely due to the initial velocity dispersions. Also plotted as various symbols are the dispersions of the particle positions at with respect to the initial locations for models A2, B2, and C2. Here, the angular brackets denote an average over the particles in a given radial bin. Note that the numerical results are in good agreement with the corresponding analytic estimates over a wide range of radii. In regions of disks with kpc, the deviation from the original epicycle orbits is quite small. It nevertheless enables well-defined spiral structure there, as we will discuss in §4. In the extended disks, on the other hand, strong tidal perturbations severely affect the orbits of particles, causing them to traverse over large radial distances.
Since the tidal force is asymmetric, particles at the near side to the perturber are more easily pulled radially outward and will subsequently find themselves subject to even greater tidal force at larger .333In the case of model A2, the ratio of the tidal forces at the near and far sides is 2.0 and 7.5 at and , respectively. Particles whose velocities exceed the escape velocity become unbound, and either are captured by the perturber or escape from the combined galaxy-perturber system (Toomre & Toomre, 1972). The fraction of the captured particles and the non-captured, freely escaping particles are given in columns (5) and (6) of Table 1, respectively; these are fitted roughly with and for . In model C3 with , the tidal force is too weak to accelerate particles to the escape velocity. Although less than 7% of the total even in our strongest encounter model A1, the amount of mass stripped off by the tidal force depends fairly steeply on the tidal strength, and can be substantial for encounters with large .
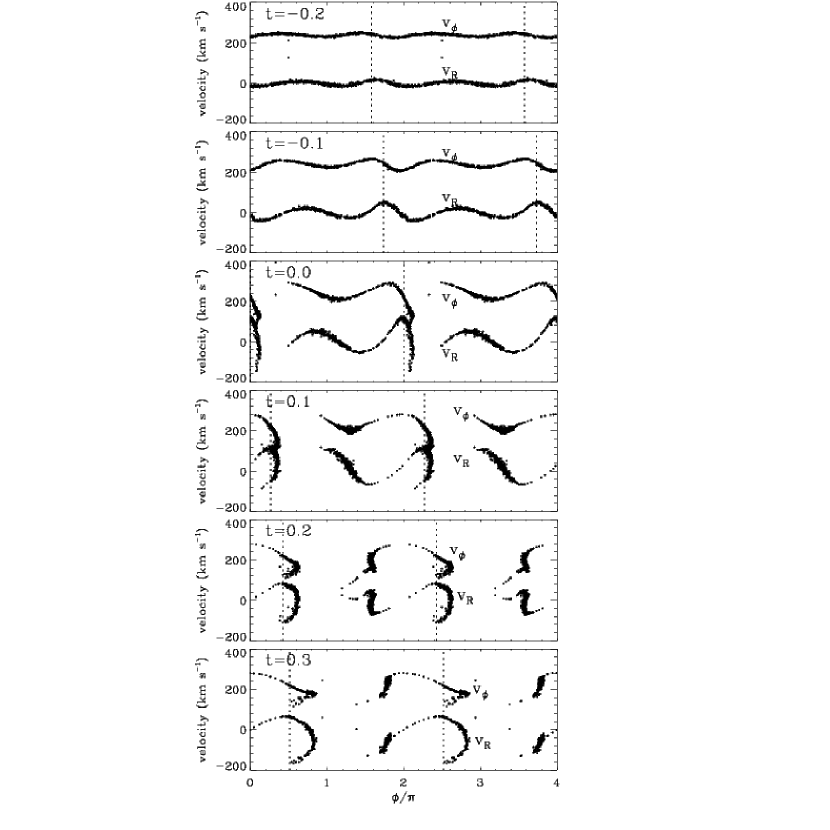
While the bridge is a pathway through which mass transfer occurs, it also contains a significant amount of bound particles. Due to strong tidal force, the orbits of these bound particles are eventually arranged in such a manner that the maximum radial velocities always occur in the direction to the perturber while the perturber remains close to the pericenter. This is well illustrated in Figure 4 which plots the azimuthal distributions of the particle velocities at kpc in model A2 for . In each panel, the vertical dotted lines indicate the direction, , to the perturber. Although the morphological change of the disk is almost absent when (see Fig. 1), the signature of the tidal interaction is already apparent in the azimuthal variations of the particle velocities. Note that in the bridge both and are maximized at at the epochs shown in Figure 4. That is, the phases of particle orbits are locked to the perturber during this time interval. Since the epicycle motions occur in the opposite sense to the disk rotation, this phase locking implies that steadily decreases as the particles continue galactic rotation past the perturber. It attains minimum values near the leading edge of the bridge. It is at this leading edge where the particles fall rapidly radially inward, rendering the leading boundary of the bridge rather sharp.
Figure 5 displays distortions of rings at several different initial radii during the early phase of the tidal encounter. Near-side particles in a ring with larger are pulled out earlier and by greater amount toward the perturber, shaping the ring into an egg-shaped oval. The tips of outer ovals become lagging behind the perturber.444The perturber in model A2 has an angular velocity of at the pericenter. Since the corresponding corotation radius is kpc in the disk, all the near-side particles shown in Figure 5 would lead the perturber were it not for strong tidal perturbations and the resulting phase locking. At the same time, new particles from inner rings that rotate fast are pulled out to lead the perturber. This constructs a transient pattern that persists while the perturber is close to the pericenter ( a few tenths of Gyrs), with the pattern speed roughly equal to the instantaneous angular velocity of the perturber. As Figure 1 shows, the bridge in model A2 (and also in other models) lasts until after which the perturber is too far away to tightly enforce the alignment of the epicycle orbits. Therefore, the bridge is a transient structure that not only allows mass transfer to the companion but also consists of bound particles that execute coherent forced oscillations in response to the applied tidal perturbations.
3.2 Tidal Tail
Tidal torque applied at the far side of the disk causes the leading (lagging) particles with respect to the line connecting the disk center and the perturber to lose (gain) angular momentum and thus to rotate slower (faster). This gives rise to a negative gradient of the circular velocity along the azimuthal direction. One may naively expect that the compressive velocity fields in the azimuthal direction should be a cause of a tidal tail at the far side, but this is not the case. The third panel of Figure 4 shows that the velocity gradient amounts to for the far-side particles at when the perturber is at the pericenter. Assuming that this value remains constant over a time interval , the resulting fractional change of the surface density would be for Gyr, which is too small to build a tidal tail in its own right. Therefore, the tail formation must involve additional processes.
Figure 5 demonstrates the tail-making process in our models. Let us pay attention to the two groups of particles, denoted by dots in black or cyan, in the ring with kpc. The dots in cyan representing a group of far-side particles at are slowly rotating about the disk center, with a period of Gyr, by following moderately perturbed epicycle orbits. With relatively weak tidal force, the locking of the epicycle phases is not significant at the far side. On the other hand, the near-side particles in black that were ahead of the perturber at have highly perturbed orbits, plunging toward the disk center as deep as kpc at . The constraint of angular momentum conservation requires the particles to rotate faster at small , providing them with a shortcut route to reach the far side (). A tidal tail develops as these strongly-perturbed, fast-rotating, near-side particles catch up with those mildly-perturbed, far-side particles ( (e.g., Pfleiderer 1963; Toomre & Toomre 1972).
Note that the outer-disk particles located in between the black and cyan dots, i.e., the particles with at in the red ring in Figure 5, are all gathered into the tail extending to kpc from the disk center. Since the tail at a given radius is comprised of particles from a wide range of radii in the unperturbed disk, it has large velocity dispersions both in the radial and azimuthal directions ( frame of Fig. 4). Accordingly, the tail in model A2 becomes weak and dispersed as the particles continue galactic rotation. This implies that the tails in our models are transient material arms.
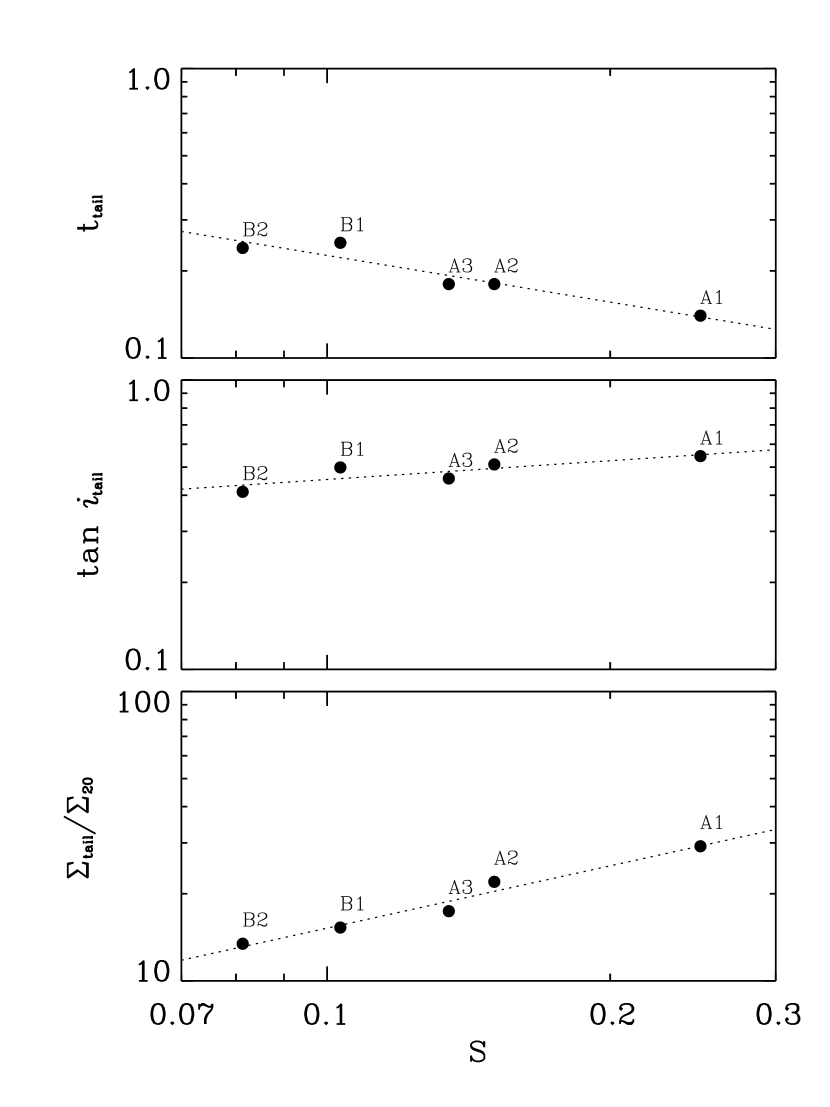
Figure 2 shows that the tail in model A2 forms at , is more or less logarithmic in shape with a pitch angle of , and becomes more pronounced than the bridge. Time of tail formation , its pitch angle , and its strength as defined by the surface density at kpc and of course depend on the the strength of tidal perturbations and the presence of self-gravity. Columns (7)-(9) in Table 1 list , , and for models with ; models B3, C1, C2, and C3 with very weak tidal perturbations do not produce readily identifiable tail structure. These values are plotted in Figure 6 as solid circles against , which are well fitted with power laws: , , and , where indicates the surface density of the initial disk at . Definitely, a tail develops earlier and stronger for stronger tidal perturbations, although the pitch angle depends weakly on . Note that the tidal tail in the non-self-gravitating model A2* is weaker and more loosely wound than that in model A2.
As mentioned above, a tidal bridge in the near side consists of particles in coherent forced oscillations, while a tail in the opposite side forms by temporary particle overlapping. Both are transient features whose amplitudes decay after . As the perturber on a parabolic orbit moves away from the galaxy in our models, the diminished tidal force no longer aligns the phases of the particle orbits in the bridge. In addition, the large velocity dispersions of the tail are unable to keep it as narrow as when it first forms. Consequently, the particles making up the bridge and tail gradually spread out and follow galactic orbits with large eccentricities. They interact with each other and also with spiral arms, producing complicated structures seen at the extended parts of the disk in Figures 1 and 2. The further diffusion and interactions of particles eventually make the outer disk almost featureless in our simulations.
4 Disk Structure
We have seen in §3.1 that the enhancement of epicycle amplitudes due to tidal perturbations is rather small in regions of disks with kpc. Nevertheless, the phases of perturbed epicycle orbits at different radii drift at different rates and are kinematically organized to develop a trailing two-armed spiral pattern there (e.g., Toomre 1969; Donner et al. 1991). Figure 7 displays close-up views of density snapshots of model A2 in the – plane. A well-defined, two-armed spiral pattern is apparent for , becoming most conspicuous at . The spiral arms that appear as straight lines in the plane (see Fig. 2) are approximately logarithmic, with a pitch angle varying with time.
An inspection of Figure 2 reveals that the arms extend inward up to kpc, corresponding to the inner Lindblad resonance (ILR), and smoothly join the the extended-disk features at . Since the pattern speed of the arms is smaller than the angular speed of the disk rotation, however, they soon decouple from the tidal tail (), and from the bridge at later time () when the phase locking becomes inefficient. The spiral arms in our models are not stationary in the sense that their pattern speed is not constant over radius and that their pitch angle and amplitude vary with time. In this section, we explore the quantitative properties of the spiral arms.
4.1 Pitch Angle
Since the spiral arms that form in our models are logarithmic, it is useful to define the Fourier coefficients in and as
| (4) |
where is the total number of particles, (, ) are the coordinates of the -th particle, and is related to the pitch angle of an armed spiral through (Sellwood & Carlberg, 1984; Sellwood & Athanassoula, 1986). A positive (negative) value of corresponds to trailing (leading) spirals.
Figure 8 plots the temporal evolution of the Fourier amplitudes of the logarithmic spiral mode in model A2 before the arms reach the maximum strength (). We consider particles only at where the pattern in model A2 achieves large amplitudes and contamination from the bridge and tail is almost absent. At early time (), the modal growth occurs as the dominant shifts from negative to positive values. This is suggestive of mild swing amplification in which seed perturbations grow as they change from leading to trailing. Since the corresponding amplification factor is less than 10 when (Goldreich & Lynden-Bell, 1965; Julian & Toomre, 1966; Toomre, 1981) and since swing amplification becomes no longer efficient at (e.g., Sellwood & Carlberg 1984), however, the further growth of the spiral modes cannot be attributable to swing amplification. It is rather due to the kinematic effects, enhanced by self-gravity, of the perturbed epicycle orbits in a manner described in Toomre (1969). As the phases of the epicycle orbits drift and are coherently arranged, the density associated with the pattern grows quite rapidly and saturates at in model A2.
It is well known that kinematic density waves without self-gravity tend to wind up due to the background differential rotation, with the pitch angle varying as
| (5) |
(e.g., Binney & Tremaine 1987). In the theory of quasi-stationary density waves hypothesized by Lin & Shu (1964, 1966), self-gravity of the spirals compensates for the winding tendency of the arms, keeping their pattern speed at a constant value over a wide range of radii. In order to check if this is the case in our simulations, we calculate the pitch angle of the arms determined from that maximizes at a given time. Figure 9 shows the temporal changes in of the spiral arms located at kpc, kpc, and kpc for the self-gravitating models A2, B2, and C2, respectively. For comparison, Figure 9 also plots the results of the non-self-gravitating model A2* for the arm segments in an annulus with kpc, over which is almost constant. Although the arm pitch angle in model A2* exhibits small fluctuations, the late-time portion can be well described by , consistent with the theoretical prediction (eq. [5]).555 Since the Fourier method picks up, in a given annulus, the most dominant spiral modes that propagate radially inward, the time dependence of can also be affected by the radial variation of if the annulus is wide enough. For instance, the average pitch angle of the arms in the kpc region in model A2*, over which varies by 13% relative to the mean value, decays as . For the self-gravitating models, the arms have moderate pitch angles amounting to when they grow and stand out initially. After attaining substantial strength, they begin to wind as , with a smaller power index corresponding to stronger arms. This suggests that although self-gravity reduces the winding rate considerably, it cannot completely suppress the winding tendency of the spiral arms in our models.666 In addition to the background shear, short trailing waves in the presence of self-gravity would increase their radial wavenumber as they propagate inward from the corotation radius, capable of decreasing the pitch angle further (Toomre, 1969).
Once finding the arm pitch angle and pattern speed (see below), we are able to compare the WKB theory of linear density waves with the simulation results. The local theory for tightly-wound linear waves in a stellar disk states that the perturbed radial velocity and azimuthal velocity are related to the perturbed surface density through
| (6) |
| (7) |
(Lin, Yuan, & Shu, 1969). Here, is the local radial wavenumber of the waves, , is the dimensionless angular frequency with denoting the pattern speed, and and are the reduction factors defined by equations (B9) and (B17) of Lin, Yuan, & Shu (1969), respectively. In equation (7), the imaginary unit represents the phase shift between and .
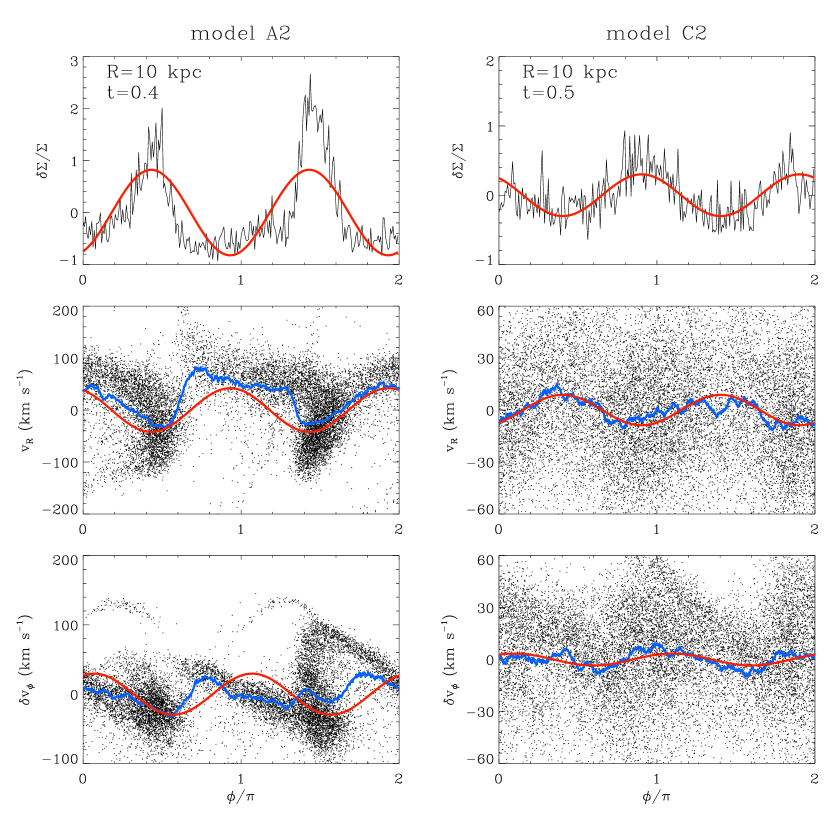
Figure 10 gives exemplary comparisons between the numerical results and the linear-theory predictions for the azimuthal variations of the perturbed variables. Two sets of numerical data near at in model A2 and at in model C2 are arbitrarily taken. In the top panels, black curves with some fluctuations draw from numerical simulations, while red lines plot the corresponding Fourier modes . In the middle and bottom panels, red curves draw equations (6) and (7) corresponding to . Blue curves represent the azimuthally-binned averages of and that are plotted as dots from the simulations. Apparently, the perturbed density in model C2 is in the linear regime and dominated by the mode. Note that in spite of large dispersions in and , there is fairly good agreement between the numerical and analytic results for model C2. On the other hand, the spiral arms in model A2 are asymmetric and clearly in the nonlinear regime. In this case, the perturbed velocities have significant contributions from high- modes (e.g., Vandervoort 1971), rising more steeply than a simple sinusoidal curve as particles leave the spiral arms.
Among the models listed in Table 1, we found that models B3, C2, and C3 with relatively weak tidal perturbations () produce linear spiral arms with sinusoidal density distributions. All the other models we considered show significantly nonlinear features in the density and velocity profiles. This implies that tidally-excited stellar spiral arms in grand-design spiral galaxies probably have non-linear amplitudes.
4.2 Arm Strength
One of the key parameters that directly influence gas flows in spiral galaxies is the strength of stellar spiral arms. Stronger spiral arms imply larger enhancement of gas density at the galactic shocks and hence more active star formation. To quantify the arm strength, we define
| (8) |
where denotes the amplitude of . Since the corresponding gravitational potential perturbation is given by for a tightly-wound spiral in an infinitesimally-thin disk, measures the gravitational force due to the spiral arms in the direction perpendicular to the arms relative to the the axisymmetric radial force in the unperturbed state (e.g., Roberts 1969; Shu, Milione, & Roberts 1973; Kim & Ostriker 2002).
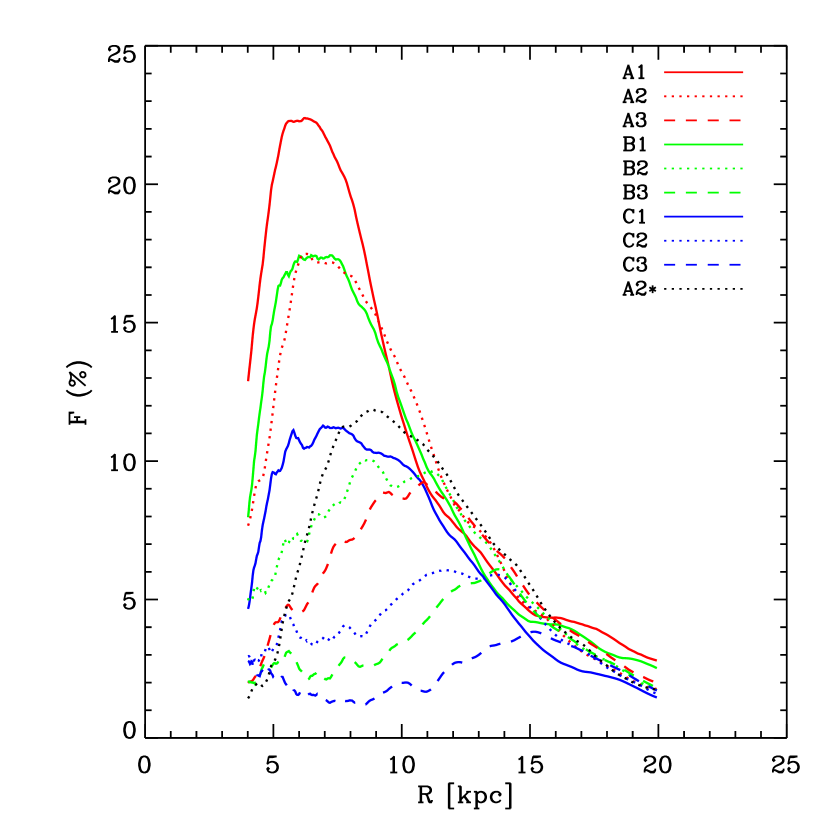
Figure 11 plots the radial variations of for the arms averaged over the time interval centered at the epoch when the arm amplitudes are maximized. In a given model, broadly peaks at a certain range of radii; kpc for models A1, A2, B1, and C1, kpc for models A2*, A3, and B2, and kpc for models B3, C2, and C3. This demonstrates that more distant encounters excite spiral features in regions with larger . The arms become progressively weaker toward the disk center since the ratio of the tidal perturbations to the background gravity is proportional roughly to for small radii. They eventually attain vanishingly small amplitudes inside kpc corresponding to the ILR through which stellar spiral waves cannot propagate.777It is unclear whether the absence of spiral arms at in our models is mainly due to the ILR barrier or just because the tidal perturbations are too weak to excite density waves there. We have run a model simulation (not listed in Table 1) corresponding to model A2 but without the bulge (hence no ILR) only to find that the inner disk is contaminated by the formation of a central bar (e.g., Noguchi 1987). Although the tidal perturbations are strong in extended disks, on the other hand, still decreases with increasing (). This is because the amount of mass available to construct spiral arms in the background stellar disk declines very rapidly with radius. Figure 11 also shows that self-gravitating spiral arms in model A2 are stronger by about a factor of 1.5 and located relatively closer to the center than non-self-gravitating arms in model A2*.
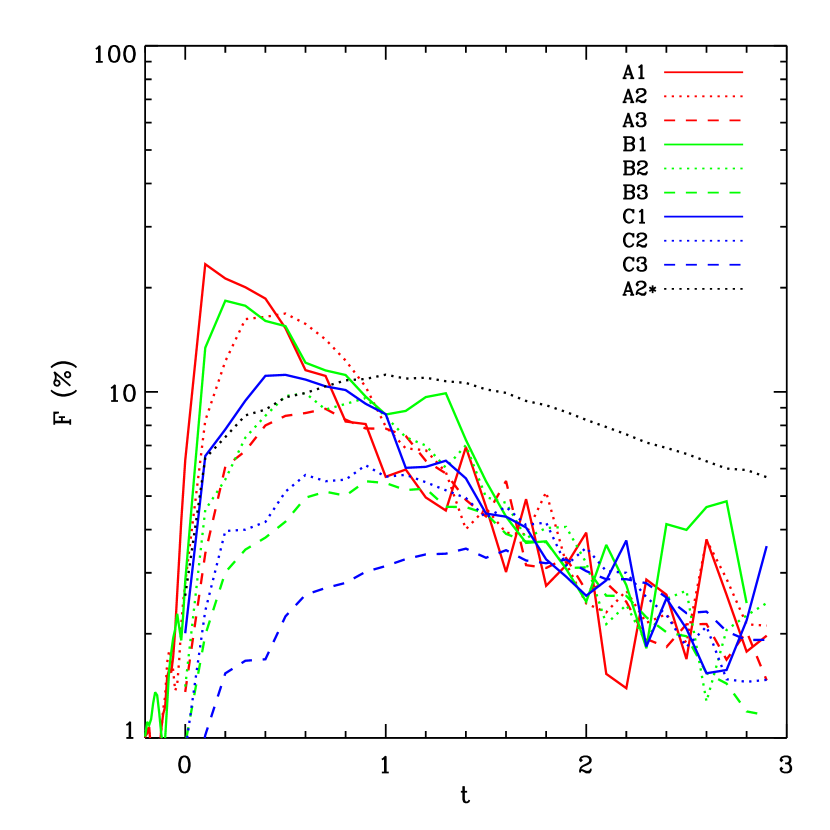
To study how rapidly spiral arms grow and how long they survive, we plot in Figure 12 the temporal variations of averaged over a range of radii where the arms are strongest in each model. Obviously, the arms grow earlier and more rapidly for models with stronger tidal perturbations. For instance, it takes only Gyrs for the strong-encounter models A1 and A2 to achieve the peak strength, while more than 1 Gyrs are required for the weak encounter models. Figure 13 plots the peak value of the arm strength as a function of the tidal strength , showing roughly .
Since the formation of tidal spiral arms in a disk involves the gathering of particles from different radii, the velocity dispersions increase as the arms grow. In addition, gravitational scatterings of stellar particles off the arms become efficient to heat the disk once the arms acquire considerable amplitudes, counterbalancing the arm-amplifying effect of self-gravity (e.g., Sellwood & Carlberg 1984; Binney & Tremaine 1987; Binney 2001). In all the models we have considered, the arms never become fully self-gravitating. They stop growing and decay as the enhanced velocity dispersions make the once well-organized epicycle orbits kinematically less coherent. Figure 12 shows that for the self-gravitating models, decreases after the peak almost exponentially in a time scale of Gyrs, whereas spiral arms in the non-self-gravitating model A2* decay much more slowly since they do not experience secular disk heating. Strong encounter models possess spiral arms with for Gyrs, corresponding to four disk rotations at kpc, while spiral arms in the weak-encounter model C3 have throughout the entire evolution. Small-amplitude fluctuations of at are caused by the interactions with the particles once pertaining to the bridge and tail.
4.3 Pattern Speed
Finally, we discuss the pattern speed of the tidal arms formed in our simulations. To measure the pattern speed at a given radius, we define the normalized cross-correlation of the perturbed surface densities at two fixed times separated by as
| (9) |
For a sufficiently small value of , the instantaneous arm pattern speed at a given radius is then determined by , where denotes the phase angle at which is maximized. We take in calculating from the numerical data.
Figure 14 plots as contours the amplitudes of on the radius ()frequency () domain for some selected time epochs of models A2 and A2*. The solid and dashed lines draw the radial variations of and , respectively, from the initial disk rotation. At , the spiral arms in both models are relatively weak and the cross-correlation is dominated by the extended-disk features, especially by the tidal bridge. The bridge rotates almost rigidly at a fixed pattern speed (), corresponding to the angular frequency of the perturber at the pericenter. This evidences the phase locking of particle orbits in the bridge explained in §3.1. The tail at the opposite side of the perturber becomes strong at about , significantly contributing to at . Interestingly, the instantaneous pattern speed of the tail is similar to that of the bridge at this time. As time evolves further, the extended tidal structures become weaker since the perturber moves farther away, while the spiral arms become more pronounced in the distribution of .
When the arms are quite strong () in model A2, their patten speed decreases with radius, indicating that they are not a “pattern” in a strict sense. This is the reason why the pitch angle of the arms decreases with time. Since the axisymmetric background state of the stellar disk as well as the shape and pitch angle of the arms are already known, one can calculate the theoretical pattern speed predicted from the WKB dispersion relation
| (10) |
for tightly-wound density waves (Lin, Yuan, & Shu, 1969). The dotted line in each of the left panels of Figure 14 shows obtained from equation (10), which traces the loci of maximum fairly well. Note that equation (10) would simply yield or without self-gravity, in excellent agreement with the pattern speed of spiral arms in model A2* for . Although the presence of self-gravity tends to enhance the arm pattern speed, our numerical results suggest that its effect is quite small; for all the models considered, is below even when the arms reach the peak strength, and it comes very close to the curve at . This implies that the spiral arms at least at late time are kinematic spiral waves in which the large velocity dispersions of particles as well as the kinematic winding of the arms make self-gravity unimportant.
5 Summary & Discussion
5.1 Summary
Galactic spiral shocks and their substructure-forming instabilities in disk galaxies are strongly affected by stellar spiral arms that are often triggered by tidal interactions with a companion galaxy. To gain an insight on the large-scale star formation occurring in the gaseous component and related evolution of disk galaxies, it is crucial to understand the physical properties of tidally-induced stellar arms. While the literature abounds with studies of tidal interactions of galaxies, most of them concentrate mainly on morphological transformation, especially in the extended parts, of disk galaxies.
In this paper, we have initiated numerical -body experiments for tidal encounters to quantify the properties of spiral arms that form in the disks and study how their properties vary with tidal strength. We also study the nature of the tidal bridge and tail that develop in the outer regions. We consider a simple galaxy model consisting of a rigid halo/bulge and a razor-thin stellar disk with Toomre stability parameter of . A perturbing companion galaxy is treated as a point-mass potential moving on a prescribed, prograde, parabolic orbit in the same plane as the galactic disk. By varying the mass and pericenter distance of the perturber, we explore tidal interactions with strength in the range of , where is the dimensionless momentum applied by the perturber to stars at outer disks (see eq. [3]).
Our main results are summarized as follows.
1. The tidal bridge forms at the near side to the perturber as particles in outer disks are pulled out by strong tidal perturbations. Some particles with velocities exceeding the escape velocity become unbound, and either are captured by the perturber or escape from the system, but these are less than 7% of the total for . On the other hand, bound particles with low velocities in the bridge execute coherent forced oscillations in such a way that the maximum radial velocities and the maximum gradient of the azimuthal velocities are always attained in the direction toward the perturber. This phase locking of the perturbed particle orbits allows the bridge to construct a transient pattern that corotates with the perturber as long as the perturber remains close to the pericenter (). The phase locking is also a cause of the sharp leading edge of the bridge, where particles begin to fall radially inward during their forced oscillations.
2. Only strong tidal encounters with produce a recognizable tail (or counterstream) at the far side of the disk. The tail develops as strongly-perturbed, near-side particles overtake mildly-perturbed, far-side particles. When the tail achieves a peak strength, it is very narrow and in a roughly logarithmic shape. For we have considered, the formation epoch , pitch angle , and the surface density of the tail depend on the tidal strength parameter as , , and at . Comprising of particles collected from a wide range of radii in the unperturbed disk, the tail is a material arm and has large velocity dispersions, so that it widens and weakens with time.
3. Even though the boost of epicycle amplitudes due to tidal perturbations is quite small in regions with kpc, the perturbed particle orbits are kinematically organized to generate two-armed global spiral arms there. With in the unperturbed disk, the self-gravity of stars does not play a dominant role in growing the spiral modes, although it appears to enhance the amplitudes considerably when the arms are nonlinear. The spiral arms are approximately logarithmic in shape and subject to kinematic winding. For the parameters we have explored, the pitch angle of the spiral arms is in the range of when the arms attain peak amplitudes and then decreases as , with a smaller decay rate corresponding to stronger arms.
4. Stronger encounter models tend to develop stronger spiral arms earlier and more toward the galaxy center, resulting in the arms at , Gyr after the pericenter passage for models with . Arms are absent inward of corresponding to the inner Lindblad resonance. In terms of the parameter (eq. [8]) that measures the perturbed radial force due to the spiral arms relative to the mean axisymmetric gravity, the maximum strength of the spiral arms behaves as . Because of large velocity dispersions associated with the particle gathering and secular heating, the arms never become fully self-gravitating and decay after the peak almost exponentially in a time scale of Gyr.
5. Analyses using the normalized cross-correlation of the perturbed densities reveal that the arm pattern speed is not constant in both radius and time, indicating that spiral arms that form in our models are not exactly a pattern. In fact, decreases with radius, causing the pitch angle to decrease with time. Self-gravity tends to increase , but only below even when the arms are strongest. Self-gravity becomes unimportant as the arms decay, resulting in at late time.
5.2 Discussion
We have seen in this paper that spiral arms produced by tidal encounters are approximately logarithmic in shape, similarly to observed spiral arms in many grand-design spiral galaxies (e.g., Kennicutt 1981; Elmegreen et al. 1989; Shetty et al. 2007). The occurrence of the logarithmic arms in our models can be understood as follows. As mentioned above, the arms are kinematic density waves modified by self-gravity. Ignoring the effect of self-gravity and assuming that the phases of the waves are aligned along at , corresponding to the impulsive tidal perturbations applied at the pericenter, the pitch angle of kinematic density waves with is given by equation (5). If the right-hand side of equation (5) is independent of , the arms have a perfect logarithmic shape. It turns out that the galaxy rotation curve we adopt (Fig. 15) has an approximately constant value of km s-1 kpc-1 over the distance from the ILR radius out to the edge of the disk. This results in over a range of radii where spiral arms are strong, indicating that the variation of the pitch angle along the arms is in fact very small. The presence of self-gravity as well as epicycle motions of particles are likely to further smooth out the local variation of .
Our numerical results show that self-gravity is unable to keep the arm pitch angles fixed over time. A larger rate of shear in the rotation curve implies a smaller arm pitch angle for kinematic arms. Indeed, Seigar et al. (2005, 2006) reported a well-defined negative correlation between the arm pitch and the shear rate for a sample of (not necessarily tidally-driven) spiral galaxies, suggesting that spiral arms in real galaxies are unlikely to be fully self-gravitating.
While we adopt highly simplified models for both the disk galaxy and the orbital parameters of tidal interactions, it is still interesting to compare the arm properties found in our simulations with those of observed spiral arms. In the case of the M51/NGC5195 system, the mass ratio of the target galaxy to the companion is estimated to be (e.g., Smith et al. 1990; Salo & Laurikainen 2000a). The encounter models that well reproduce the kinematics and morphologies of the M51 system favor an inclined orbit with the pericenter distance of (Salo & Laurikainen, 2000a). Since the thin disk approximation and non-inclined orbits taken in our models tend to produce stronger tidal arms than in the thick-disk, inclined-orbit counterparts, models A1 and A2 can perhaps be best compared with the M51/NGC5195 system. K-band observations indicate that the radially-averaged spiral arm strength is around for M51 (e.g., Scoville et al. 2001; Salo & Laurikainen 2000b; see also Rix & Rieke 1993; Rix & Zaritsky 1995), which is not much different from found for models A1 and A2 at (Figs. 11 and 12). The arms in M51 are logarithmic spirals with a pitch angle of (Shetty et al., 2007), which is again close to the arm pitch angle in model A2 at .
Among the properties of spiral arms, the most intriguing is the pattern speed that is not well constrained by observations. Elmegreen et al. (1989) identified resonance features in the arms of M51 to find , while Zimmer et al. (2004) determined using the Tremaine-Weinberg method. By running collisional models for cloud dynamics under a given spiral potential, García-Burillo et al. (1993) found for the best fit to the observed morphologies of the CO arms in M51. All of these works were based on the premise that the arm pattern speed is a constant with radius. However, our numerical results show that the pattern speed of tidal arms depends on the radius. In the case of model A2, is a decreasing function of radius, varying when the arms are strongest from at the ILR to at the outer parts, and at later time converging to the curve. A similar trend was obtained by Salo & Laurikainen (2000b) who ran more realistic encounter models (with a star-only disk) for the M51 system and found that is close to the curve for a range of radii where the spiral arms are strong. Although much remains uncertain regarding the effects of the cold gaseous component and rotation curve, these results suggest that tidally-driven arms may have a pattern speed that varies with radius in real spiral galaxies.
An age distribution of star clusters in M51 shows a narrow peak at Myrs and a broad peak at Myrs (Lee et al., 2005), indicating active star formation at these epoches. This enhanced star formation is most likely due to strong spiral arms induced by the tidal interactions with the companion NGC 5195. Since it takes about Myrs for the spiral arms in our models A1 and A2 to attain a substantial amplitude, say , after the perturber passes the pericenter, this implies that the closest passages of NGC 5195 might have occurred Myr and Myrs ago. Salo & Laurikainen (2000a) proposed two encounter models for the M51 system: a near-parabolic, single-passage orbit occurred 400–500 Myrs ago and a bound double-passage orbit having taken place 400–500 Myrs and 50–100 Myrs ago. Considering the delay between the pericenter passage and the development of strong arms, the cluster age distribution appears to be more consistent with the double-passage scenario, although it is uncertain what effects the second passage will make on the pre-existing arms generated at the first passage.
It is well known from the seminal paper of Toomre & Toomre (1972) that tidal interactions distort the outer parts of a galactic disk and create a tidal bridge extending toward the perturber as well as a narrow tail at the opposite side. They noted a fraction of the disk material is stripped and transferred through the bridge to the perturber. In this work, we further show that the bridge is in fact a transient pattern constructed by bound particles whose orbits are strongly locked to the perturber. As these particles follow galactic rotation, they are pulled out toward the perturber and then move radially inward at the leading edge, making the bridge rather sharp. By mapping the final to initial particle positions under an impulse approximation, Donner et al. (1991) showed that the sharp boundary of a tidal bridge corresponds to the loci (caustics) of zero Jacobian of the mapping where the orbits of neighboring particles come very close together. Indeed, Figure 4 shows that the leading edge has a large velocity dispersion, consistent with the Liouville theorem that dictates the conservation of the particle density in the phase space.
Unlike a bridge, a tail at the opposite side is a material arm resulting from the overlapping of near-side particles with far-side particles in the extended parts of the disk. Consequently, the tail forms later than the bridge by about a half orbital time, consistent with the results of Donner et al. (1991) and Byrd & Howard (1992). Our experiments show that the formation time and pitch angle of a tail are well correlated with the tidal strength parameter . While we employed simple models for tidal interactions and limited our simulations to the cases with , our results appear to be applicable to models with quite strong tidal perturbations as well. In simulations of merger encounters, for example, Barnes (1992) ran self-consistent models consisting of a live halo/bulge and a disk with both stars and gas. One of his models considered interactions between equal-mass disk galaxies, in which one disk passes directly through the other with the pericenter distance , corresponding to . Figure 3 of Barnes (1992) shows that the tail in this model becomes strongest at , corresponding in our units to after the pericenter passage, and has a logarithmic shape with , which are remarkably similar to the extrapolation of our results in §3.2 that yield and . Through a comprehensive survey of the parameter space, Toomre & Toomre (1972) found that tail shape is insensitive to the orbital eccentricity for as long as the inclination of the orbit is not so large (see also Barnes 1998), which is also consistent with our result that is weakly dependent on .
Numerical studies on tidal encounters often report the formation of double arm structure at the opposite side to the perturber (e.g., Sundin 1989; Elmegreen et al. 1991; Donner et al. 1991). Our simulations also exhibit such double features (see, e.g., frame of Fig. 1) which come out as the tidal tail decouples from the spiral arms that, because of the smooth alignment with the former, are not readily discernible at . Elmegreen et al. (1991) found that the lagging arm forms by gathering particles streaming away from the near side and soon merges with the leading arm. This might be a consequence of the zero velocity dispersion in their unperturbed disk since the ratio of the velocity impulse due to tidal torque to the initial random velocity is too large to set up well-defined spiral arms in the disks of their models. Elmegreen et al. (1991) also found that a prograde, in-plane encounter produces a “ocular” galaxy with oval-shaped, sharp boundaries, provided . A similar structure can be seen in the panel of Figure 1, although the boundaries in our models are less sharp since, as they noted, the formation of ocular shape requires the injected energy from the perturber to be much larger than the kinetic energy in random particle motions.
Appendix A Galaxy Model
In this Appendix we describe the model galaxy we use for tidal encounter experiments. The galaxy consists a rigid halo/bulge and a live stellar disk. For a fixed spherical halo, we adopt a truncated logarithmic potential
| (A1) |
where is the three-dimensional distance from the halo center, is the halo core radius, is the truncation radius, and is the constant rotation velocity the disk would have at large if the halo were not truncated (e.g., Lee et al.. 1999). The corresponding halo mass distribution is for and for . The constant in equation (A1) should equal to make the potential continuous at . For the simulations presented in this paper, we take , kpc, , corresponding to . A spherical bulge is modeled by a Plummer potential
| (A2) |
with the scale radius and the total bulge mass .
Although stars in real galactic disks are distributed with a finite vertical thickness, for example, amounting to pc in the solar neighborhood (e.g., Chen et al. 2001; Karaali et al. 2004), we impose an infinitesimally-thin stellar disk by setting the vertical coordinates and velocities equal to zero throughout the simulations. For the radial distribution of stellar surface density, we adopt an exponential form
| (A3) |
where is the galactocentric radius in the disk, is the disk scale length, and is the surface density at the galaxy center. The total disk mass is . The gravitational potential of the disk is given by
| (A4) |
where and represent modified Bessel functions of the first and second kinds, respectively, and (see e.g., Binney & Tremaine 1987). We take and pc-2, corresponding to .
To obtain the equilibrium velocity distribution of disk particles under the total gravitational potential , we follow a method suggested by Hernquist (1993) and Quinn et al. (1993). We first assume that the radial and azimuthal components, and , of particle velocities obey initially the Schwarzschild distribution function
| (A5) |
where and are the radial and azimuthal velocity dispersions, respectively (e.g., Toomre 1964). The mean azimuthal streaming velocity differs from the circular velocity determined solely from the total gravitational potential as . In the local approximation in which , , and are assumed to vary slowly with , one can show that and are related to each other through
| (A6) |
where is the local rotational angular velocity and is the square of the local epicycle frequency (e.g., Binney & Tremaine 1987). Then, the usual Jeans equation in the radial direction for an equilibrium disk leads to
| (A7) |
Finally, we express the radial velocity dispersion in terms of the Toomre stability parameter
| (A8) |
which determines local gravitational stability of a razor-thin disk to axisymmetric perturbations. We adopt a fixed value of everywhere initially. This value of corresponds roughly to solar neighborhood conditions with km s-1 kpc-1, (Binney & Tremaine, 1987), and pc-2 (Kuijken & Gilmore, 1989), and is large enough to make swing amplification of non-axisymmetric disturbances inefficient. This precludes the possibility of spiral arms driven spontaneously by the stellar self-gravity (e.g., Sellwood & Carlberg 1984; Bertin et al. 1989b).
Figure 15 plots the circular velocity and the mean rotational velocity of our model galaxy as solid and dotted lines, respectively. Also shown as dashed lines are the separate contributions to from halo, bulge, and disk, which have a mass ratio of inside . It is apparent that is usually smaller than , indicating that stars, on average, lag behind a circular orbit at the same galactocentric radius, a phenomenon known as asymmetric drift.
Appendix B Initial Disk Setup
We initialize the exponential stellar disk (eq. [A3]) by distributing =514,000 equal-mass particles and place it under the combined halo and bulge potential (eqs. [A1] and [A2]). Strictly speaking, the model disk constructed in this way is not in perfect equilibrium because equations (A5) and (A7) hold true only in a local sense, that is, only when the gravitational potential and the stellar velocity dispersions do not vary much with radius (e.g., Sellwood 1985). In addition, when the disk is allowed to evolve, any non-axisymmetric modes that grow may interact with particles, feeding them with random kinetic energy. Two-body interactions of particles tending to heat the disk are not completely negligible, either. All of these may cause the disk structure to deviate considerably from the desired one even before undergoing tidal encounters.
To obtain a disk configuration representing a dynamically well-relaxed, global equilibrium, we evolve our model galaxy in isolation for two Gyrs. Figure 16 displays snapshots of particle distributions from the isolated disk evolution. The disk is rotating in the counterclockwise direction and time is expressed in units of Gyr. Other than weak non-axisymmetric, trailing structures seen at its outskirts, the disk does not suffer from dramatic morphological changes. This implies that the disk is globally stable, a consequence of the fact that, when , the growth of perturbations by swing amplification and other instabilities is quite mild (Toomre, 1981; Sellwood, 1989). No additional perturbation from the rigid halo and bulge also helps to keep the disk featureless (Hernquist, 1993).
Figure 17 shows the radial distributions of various physical quantities averaged over the azimuthal direction at , 1, and 2 Gyrs. While and change promptly (within less than 0.1 Gyr) from the initial profiles, remains almost unchanged. The changes in and are largest at where the circular velocity (hence the total gravitational potential) varies rapidly with radius, rendering the local approximation invalid there (e.g., Sellwood 1985). The small increases of at from the initial values are likely caused by mild swing amplification. Except the slight variations of near the center, the changes of the disk properties between 1 and 2 Gyrs are practically negligible, indicating that at late time the disk is in a sufficiently well-relaxed, new equilibrium.
Appendix C Impulse Approximation
In the absence of tidal perturbations, the motions of individual disk particles are in general a superposition of the radial oscillations with epicycle frequency around their guiding centers and the circular oscillations of the guiding centers about the disk center. The dispersion in the epicycle amplitudes is related to the radial velocity dispersion through . Tidal perturbations are able to enhance the epicycle amplitudes for particles whose orbital periods are not so small compared with the duration of a tidal encounter.
Using an impulse approximation, one can estimate of disk particles subject to tidal perturbations. Let us assume that the tidal forcing is applied impulsively near the pericenter during the time interval of . Then, the increment in the radial velocities of particles at radius is given approximately by
| (C1) |
where is the orbital velocity of the perturber at the pericenter (e.g., Binney & Tremaine 1987). Assuming that the kinetic energy associated with is absorbed into the epicycle motions, one obtains
| (C2) |
as a measure of the mean radial excursion of disk particles under the influence of tidal perturbations. Figure 3 plots as thin curves from equations (C1) and (C2) with differing corresponding to models A2, B2, and C2, while the thick curve draws .
References
- Adams et al. (1989) Adams, F. C., Ruden, S. P., & Shu, F. H. 1989, ApJ, 347, 959
- Balbus (1988) Balbus, S. A. 1988, ApJ, 324, 60 (B88)
- Barnes (1988) Barnes, J. 1988, ApJ, 331, 699
- Barnes (1992) Barnes, J. 1992, ApJ, 393, 484
- Barnes (1998) Barnes, J. 1998, in Galaxies: Interactions and Induced Star Formation eds. D. Friedli, L. Martinet, & D. Pfenniger (Springer: Heidelberg), 275
- Barnes & Hernquist (1992) Barnes, J., & Hernquist, L. 1992, Nature, 360, 715
- Barnes & Hernquist (1996) Barnes, J., & Hernquist, L. 1992, ApJ, 471, 115
- Barnes & Hut (1986) Barnes, J., & Hut, P. 1986, Nature, 324, 446
- Bertin & Lin (1996) Bertin, G., & Lin, C. C. 1996, Spiral Structure in Galaxies: A Density Wave Theory (Cambridge: MIT Press)
- Bertin et al. (1989a) Bertin, G., Lin, C. C., Lowe, S. A., & Thurstans, R. P. 1989a, ApJ, 338, 78
- Bertin et al. (1989b) Bertin, G., Lin, C. C., Lowe, S. A., & Thurstans, R. P. 1989b, ApJ, 338, 104
- Binney (2001) Binney, J. 2001, in ASP Conf. Ser. 230, Galaxy Disks and Disk Galaxies, ed. J. G. Funes & E. M. Corsini (San Francisco: ASP) 63
- Binney & Tremaine (1987) Binney, J., & Tremaine, S. 1987, Galactic dynamics (Princeton: Princeton Univ. Press)
- Byrd & Howard (1992) Byrd, G. G., & Howard, S. 1992, AJ, 103, 1089
- Chen et al. (2001) Chen, B., Stoughton, C., Smith, A. et al. 2001, ApJ, 553, 184
- Donner et al. (1991) Donner, K. J., Engström, S., & Sundelius, B. 1991, A&A, 252, 571
- Dubinski et al. (1996) Dubinski, J., Mihos, J. C., & Hernquist, L. 1996, ApJ, 462, 576
- Durrell et al. (2003) Durrell, P. R., Mihos, J. C., Feldmeier, J. J., Jacoby, G. H., & Ciardullo, R. 2003, ApJ, 582, 170
- Elmegreen & Elmegreen (1982) Elmegreen, D. M., & Elmegreen, B. G. 1982, MNRAS, 201, 1021
- Elmegreen & Elmegreen (1987) Elmegreen, D. M., & Elmegreen, B. G. 1987, ApJ, 314, 3
- Elmegreen et al. (1991) Elmegreen, D. M., Sundin, M., Elmegreen, B. G., & Sundelius, B. 1991, A&A, 244, 52
- Elmegreen (1994) Elmegreen, B. G. 1994, ApJ, 433, 39
- Elmegreen (1995) Elmegreen, B. G. 1995, in The 7th Guo Shoujing Summer School on Astrophysics: Molecular Clouds and Star Formation, eds. C. Yuan & Hunhan You (Singapore:World Scientific), 149
- Elmegreen & Elmegreen (1983) Elmegreen, B. G., & Elmegreen, D. M. 1983, MNRAS, 203, 31
- Elmegreen et al. (1989) Elmegreen, B. G., Elmegreen, D. M., & Seiden, P. E. 1989, ApJ, 602
- Elmegreen et al. (1993) Elmegreen, B. G., Kaufman, M., & Thomasson, M. 1993, ApJ, 412, 90
- García-Burillo et al. (1993) García-Burillo, S., Combes, F., & Gerin, M. 1993, A&A, 274, 148
- Gerin et al. (1990) Gerin, M., Combes, F., & Athanassoula, E. 1990, A&A, 230, 37
- Goldreich & Lynden-Bell (1965) Goldreich, P., & Lynden-Bell, D. 1965, MNRAS, 130, 125
- Hernquist (1990) Hernquist, L. 1990, Dynamics and Interactions of Galaxies, ed. R. Wielen (Berlin: Springer), 108
- Hernquist (1993) Hernquist, L. 1993, ApJS, 86, 389
- Howard & Byrd (1990) Howard, S., & Byrd, G. G. 1990, AJ, 99, 1798
- Julian & Toomre (1966) Julian, W. H., & Toomre, A. 1966, ApJ, 146, 810
- Karaali et al. (2004) Karaali, S., Bilir, S., & Hamzaoğlu, E. 2004, MNRAS, 355, 307
- Kennicutt (1981) Kennicutt, R. 1981, AJ, 86, 1847
- Calzetti et al. (2005) Calzetti, D., Kennicutt, R. C. et al. 2005, ApJ, 633, 871
- Kim & Ostriker (2002) Kim, W.-T., & Ostriker, E. C. 2002, ApJ, 570, 132
- Kim & Ostriker (2006) Kim, W.-T., & Ostriker, E. C. 2006, ApJ, 646, 213
- Kormendy & Norman (1979) Kormendy, J., & Norman, C. A. 1979, ApJ, 233, 539
- Kuijken & Gilmore (1989) Kuijken, K., & Gilmore, G. 1989, MNRAS, 239, 605
- La Vigne et al. (2006) La Vigne, M. A., Vogel, S. N., & Ostriker, E. C. 2006, ApJ, 650, 818
- Lee et al.. (1999) Lee, C. W., Lee, H. M., Ann, H. B., & Kwon, K. H. 1999, ApJ, 513, 242
- Lee et al. (2005) Lee, M. G., Chandar, R., & Whitmore, B. C. 2005, AJ, 130, 2128
- Lin & Shu (1964) Lin, C. C., & Shu, F. H. 1964, ApJ, 140, 646
- Lin & Shu (1966) Lin, C. C., & Shu, F. H. 1966, Proceedings of the National Academy of Science, 55, 229
- Lin, Yuan, & Shu (1969) Lin, C. C., Yuan, C., & Shu, F. H. 1969, ApJ, 155, 721
- McKee & Ostriker (2007) McKee, C. F., & Ostriker, E. C. 2007, ARA&A, 45, 565
- Noguchi (1987) Noguchi, M. 1987, MNRAS, 228, 635
- Ostriker et al. (1992) Ostriker, E. C., Shu, F. H., & Adams, F. C. 1992, ApJ, 399, 192
- Patsis et al. (2001) Patsis, P. A., Héraudeau, Ph., & Grosbøl, P. 2001, A&A, 370, 875
- Pfleiderer (1963) Pfleiderer, J. 1963, ZAp, 58, 12
- Press & Teukolsky (1977) Press, W. H., & Teukolsky, S. A. 1977, ApJ, 213, 183
- Rand (1993) Rand, R. J. 1993, ApJ, 410, 68
- Rix & Rieke (1993) Rix, H.-W., & Rieke, M. J. 1993, ApJ, 418, 123
- Rix & Zaritsky (1995) Rix, H.-W., & Zaritsky, D. 1995, ApJ, 447, 82
- Roberts (1969) Roberts, W. W. 1969, ApJ, 158, 123
- Rots et al. (1990) Rots, A. H., Bosman, A., van der Hulst, J. M., Athanassoula, E., & Crane, P. C. 1990, AJ, 100, 387
- Rybicki (1971) Rybicki, G. B. 1971, Ap&SS, 14, 15
- Quinn et al. (1993) Quinn, P. J., Hernquist, L., & Fullagar, D. P. 1993, ApJ, 403, 74
- Salo & Laurikainen (1993) Salo, H., & Laurikainen, E. 1993, ApJ, 410, 586
- Salo & Laurikainen (2000a) Salo, H., & Laurikainen, E. 2000a, MNRAS, 319, 377
- Salo & Laurikainen (2000b) Salo, H., & Laurikainen, E. 2000b, MNRAS, 319, 393
- Scoville et al. (2001) Scoville, N. Z., Polletta, M., Ewald, S., Stolovy, S. R., Thompson, R., & Rieke, M. 2001, AJ, 112, 3017
- Seigar et al. (2005) Seigar, M. S., Block, D. L., Puerari, I., Chorney, N. E., & James, P. A. 2005, MNRAS, 359, 1065
- Seigar et al. (2006) Seigar, M. S., Bullock, J. S., Barth, A. J., & Ho, L. C. 2006, ApJ, 645, 1012
- Sellwood (1985) Sellwood, J. A. 1985, MNRAS, 217, 127
- Sellwood (1989) Sellwood, J. A. 1989, in Dynamics of Astrophysical Disks, 155, ed. J. A. Sellwood (Cambridge Univ. Press), 155
- Sellwood & Carlberg (1984) Sellwood, J. A., & Carlberg, R. G. 1984, ApJ, 282, 61
- Sellwood & Athanassoula (1986) Sellwood, J. A., & Athanassoula, E. 1986, MNRAS, 221, 195
- Shetty & Ostriker (2006) Shetty, R., & Ostriker, E. C. 2006, ApJ, 647, 997
- Shetty et al. (2007) Shetty, R., Vogel, S. N., & Ostriker, E. C. 2007, ApJ, 665, 1138
- Shu, Milione, & Roberts (1973) Shu, F. H., Milione, V., & Roberts, W. W. 1973, ApJ, 183, 819
- Smith et al. (1990) Smith, J., Gehrz, R. D., Grasdalen, G. L., Hackwell, J. A., Dietz, R. D., & Friedman, S. D. 1990, ApJ, 362, 455
- Springel et al. (2001) Springel, V., Yoshida, N., & White, S. D. M. 2001, New Astronomy, 6, 79
- Sundelius et al. (1987) Sundelius, B., Thomasson, M., Valtonen, M. J., & Byrd, G. G. 1987, A&A, 174, 67
- Sundin (1989) Sundin, M. 1989, in Dynamics of Astrophysical Discs, ed. J. A. Sellwood (Cambridge Univ. Press: Cambridge), 215
- Toomre (1964) Toomre, A. 1964, ApJ, 139, 1217
- Toomre (1969) Toomre, A. 1969, ApJ, 158, 899
- Toomre (1981) Toomre, A. 1981, in Structure and Evolution of Normal Galaxies, eds. S. M. Fall & D. Lynden-Bell (Cambridge:Cambridge Univ. Press), 111
- Toomre & Toomre (1972) Toomre, A., & Toomre, J. 1972, ApJ, 178, 623
- Tremaine & Weinberg (1984) Tremaine, S., & Weinberg, M. D. 1984, ApJ, 282, L5
- Vandervoort (1971) Vandervoort, P. O. 1971, ApJ, 166, 37
- Vogel et al (1988) Vogel, S. N., Kulkarni, S. R., & Scoville, N. Z. 1988, Nature, 334, 402
- Wetzstein et al. (2007) Wetzstein, M., Naab, T., & Burkert, A. 2007, MNRAS, 375, 805
- White (1988) White, R. L. 1988, ApJ, 330, 26
- Willner et al. (2004) Willner, S. P., et al. 2004, ApJS, 154, 222
- Woodward (1975) Woodward, P. R. 1975, ApJ, 195, 61
- Zimmer et al. (2004) Zimmer, P., Rand, R. J., McGraw, J. T. 2004, ApJ, 607, 285
|
|
|
|
|
|
|
|
|
|
||||||||||||||||||||
|---|---|---|---|---|---|---|---|---|---|---|---|---|---|---|---|---|---|---|---|---|---|---|---|---|---|---|---|---|---|
| A1 | 0.4 | 25 | 0.250 | 4.99 | 1.97 | 0.14 | 0.546 | 29.2 | 0.22 | ||||||||||||||||||||
| A2 | 0.4 | 35 | 0.151 | 1.99 | 0.08 | 0.18 | 0.511 | 22.0 | 0.18 | ||||||||||||||||||||
| A2* | 0.4 | 35 | 0.151 | 1.84 | 0.08 | 0.19 | 0.707 | 11.6 | 0.11 | ||||||||||||||||||||
| A3 | 0.4 | 45 | 0.103 | 0.46 | 0.006 | 0.25 | 0.499 | 15.3 | 0.09 | ||||||||||||||||||||
| B1 | 0.2 | 25 | 0.135 | 1.95 | 1.33 | 0.18 | 0.457 | 17.4 | 0.17 | ||||||||||||||||||||
| B2 | 0.2 | 35 | 0.081 | 0.79 | 0.03 | 0.24 | 0.411 | 13.4 | 0.10 | ||||||||||||||||||||
| B3 | 0.2 | 45 | 0.056 | 0.07 | 0.002 | 0.06 | |||||||||||||||||||||||
| C1 | 0.1 | 25 | 0.070 | 0.73 | 0.67 | 0.11 | |||||||||||||||||||||||
| C2 | 0.1 | 35 | 0.043 | 0.22 | 0.01 | 0.06 | |||||||||||||||||||||||
| C3 | 0.1 | 45 | 0.029 | 0.04 |