Far-infrared signature of the superconducting gap in intercalated graphite CaC6.
Abstract
Terahertz reflectance spectra of the Ca-intercalated graphite CaC6 reveal a superconducting gap below 11 K. The gap signature lacks a sharp onset to full reflectivity at , but rather shows a distribution of gap values consistent with an anisotropic gap. The experimental data were successfully fitted to the gap distribution obtained from density functional calculations by Sanna et al. (Phys. Rev. B75, 020511, 2007). The temperature dependence of the superconducting gap is characteristic for a BCS type superconductor.
pacs:
74.70.Ad, 74.25.Gz, 78.30.-j, 81.05.UwCaC6 is exceptional in the series of intercalated graphite compounds because of its high superconducting transition temperature, K. Weller et al. (2005); Emery et al. (2005) The temperature dependence of the magnetic penetration depth shows an exponential behavior at low temperatures, characteristic for a -wave2 pairing mechanism. Lamura et al. (2006) The temperature and magnetic field dependences of the electronic specific heat are consistent with a fully gapped superconducting order parameter. Kim et al. (2006a) Isotope effect studies show that superconductivity in CaC6 is dominated by coupling of the electrons by Ca phonon modes. Hinks et al. (2007) It has been argued that coupling with low energy Ca vibrations must be very strong to obtain the observed , in disagreement with the specific heat data that suggests a weak coupling regime. Mazin et al. (2007) For an overview of theoretical and experimental studies see ref. Kim et al., 2007. Despite of the recent efforts the origin of the superconducting mechanism in CaC6 is still not fully understood.
One of the important parameters of a superconductor is the magnitude and the temperature dependence of the superconducting gap size. The gap of CaC6 was measured Bergeal et al. (2006) by scanning tunneling spectroscopy, cm-1 yielding , slightly less than the weak coupling BCS value of 3.53. A subsequent scanning tunneling spectroscopy experimentKurter et al. (2007) reported a much larger gap size cm-1, with in the strong coupling regime. This discrepancy of 50% in the gap values deserves further clarification. The temperature dependence and the magnitude can be easily tested by infrared spectroscopy. Glover and Tinkham (1956) Infrared photons with energy larger than break a Cooper pair in a process of scattering off impurities and create a pair of quasiparticles. Mattis and Bardeen (1958); Pöpel (1991) The signature of the superconducting gap in infrared reflectance spectra increases along with the scattering rate of quasiparticles. Here we report the results of an infrared reflectance spectroscopy experiments on CaC6 which reveal a distribution of superconducting gaps with the average value consistent with the weak coupling BCS value of 3.53. The gap distribution is in very good agreement with the distribution obtained from an ab initio density functional calculations by Sanna et al. Sanna et al. (2007)
In our study we investigated the reflectance of single crystals of CaC6 between 3 K and 15 K. We found typical signatures of the superconducting gap in the reflectance ratios of the superconducting and the normal state, respectively, and followed its temperature dependence. The appearance of the gap signature in indicates that CaC6 is in the dirty limit with the quasiparticle scattering rate large compared to .
We measured the reflectivity of total of three samples, 26, 31, and 42, grown in Stuttgart Kim et al. (2006a), with dimensions in the plane , , and , respectively. The sample 31 was a mosaic composed of two pieces. The surfaces used for the reflectance measurements on samples 31 and 42 were obtained by cleaving the crystals while for 26 the outer surface of an as-grown sample was investigated. The superconducting properties of the samples were characterized by magnetic susceptibility and d.c. measurements. The conductivity measured in the normal state at 12 K was . Samples were loaded in a glove box in a controlled argon atmosphere into the reflectance probe. After mounting into the cryostat Ar gas was replaced by He heat exchange gas. A polarizing Martin-Puplett interferometer SPS200 (Sciencetech Inc.) equipped with a -cooled bolometer kept at was used to measure the spectra between 4 and . A mercury arc lamp was used as a light source. A small wire-grid polarizer was placed at the exit port of a light pipe inside the sample chamber in front of an aluminum-coated glass mirror which focused light on the sample. The vector of light was perpendicular to the plane of incidence and parallel to the plane of carbon atoms, the plane. With this scattering geometry the conductivity in the plane can be probed without contaminations from the -axis conductivity. Light intensity reflected by the sample at was divided by the light intensity reflected by the sample in the normal state at 15 K.
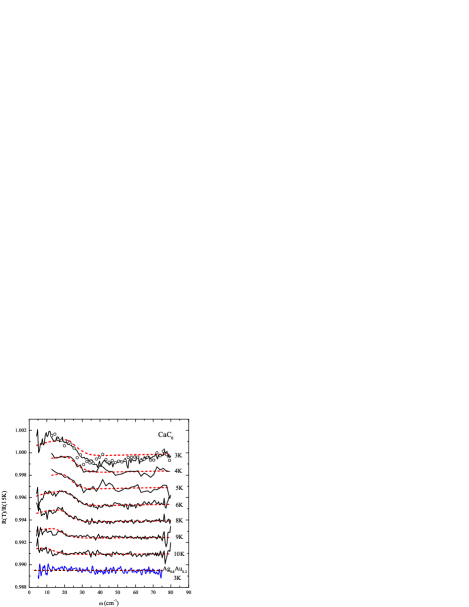
The dependence of relative reflectance is shown in Fig.1. A step-like feature observed below 30 cm-1 with its largest amplitude at 3 K decreases and shifts to lower frequency as approaches . To rule out the possibility of the step-like feature in the CaC6 spectra being an artefact of the measurement method, a reference sample made of solid solution Ag0.8Au0.2 was measured simultaneously with the CaC6 samples. Below 15 K, Ag0.8Au0.2 has a very small dependence of the resistivity. Fujishiro et al. (1994) Between between 4 and 80 cm-1 the reflectance ratio obtained from Ag0.8Au0.2 was a flat line with a noise to signal amplitude . The deviation from the flat line is an order of magnitude smaller than the step size features observed in spectra of CaC6 (Fig.1).
To fit the data we calculated the zero angle reflectance using well-known relations between the complex dielectric constant and the complex conductivity assuming a Drude-like conductivity for the normal state. Dressel and Grüner (2002) In the superconducting state the expression by Zimmermann et al.Zimmermann et al. (1991) for a BCS superconductor was used. The Zimmermann expression yields the complex conductivity normalized to the normal state conductivity and depends on parameters , , , and the scattering rate . To calculate the (relative) reflectance, the d.c. conductivity and the dielectric constant are needed. We used , where contributions of all lattice and electronic oscillators above 80 cm-1 are included. is related to the plasma frequency and the scattering rate according to , and one of them, or is needed as an additional input parameter. The expression of Zimmermann et al. can be extended to superconductors with a distribution of by assuming that the conductivity in the superconducting state is given by the superposition of conductivities according to , where is the distribution function of the gap. In the fitting procedure of the parameters , and were fixed. In the first step a temperature independent value for was obtained for each sample and used in the second step to perform a complete fit of . In the case of gap distribution the result was the scaling factor , where . To compensate for detector drifts an additional fitting parameter was introduced which multiplied the relative reflectance and ranged from 0.9982 to 0.9999.
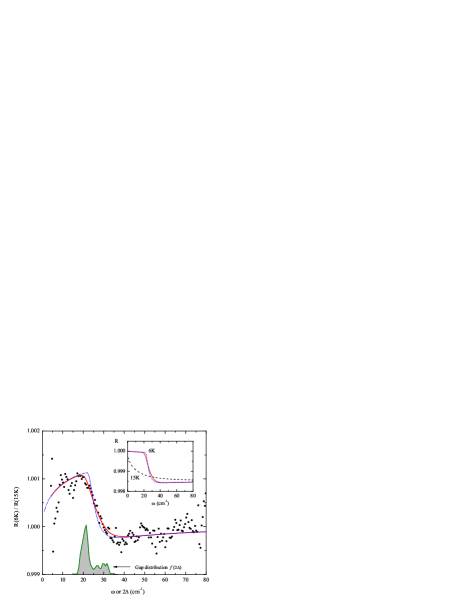
The fits assuming two different gap models and corresponding absolute reflectances are shown in Fig.2. The absolute reflectance in the superconducting state at frequencies below is unity and drops at frequencies above the gap, (see inset to Fig.2). There are two different regimes in the normal conducting state. Dressel and Grüner (2002) At low frequencies , the Hagen-Rubens square root behavior is observed, . At higher frequencies , the reflectance flattens to . First we fitted the 6 K spectrum using the single gap model and the plasma frequency as calculated by Mazin et al. Mazin et al. (2007) The fit obtained with cm-1 is not perfect since the measured spectrum lacks a sharp onset of full reflectivity at . The fit can be significantly improved (cf. Fig.2) if the gap distribution as obtained from the first principles density functional calculation of Sanna et al. Sanna et al. (2007) is used. rig The gap model of Sanna et al. scaled by a factor of was used to to fit the whole temperature range of relative reflectances (cf. Fig.1). The fit of relative reflectance spectra yielded normal state conductivities for sample 26 and for samples 31 and 42, in good agreement with the measured d.c. conductivity (see above). Although the fit of relative reflectance gave a lower conductivity for sample 26, the quality of the fit (not shown) and the scaling factor were similar to that of other two samples (cf. Fig.3). Apparently there is a higher level of defects in the as-grown surface of sample 26 that reduce the conductivity but do not affect the superconducting state.
In the following we discuss the results obtained for the samples with the higher conductivity if not otherwise stated. The scattering rate obtained, cm-1, is not much larger than the maximum value of twice the gap. Assuming a Fermi velocity cm s-1 (Ref. Mazin et al., 2007) the calculated mean free path amounts to nm. The coherence length determined by other experimental probes Emery et al. (2005); Bergeal et al. (2006); Kim et al. (2006a); Jobiliong et al. (2007) is rather small, nm, compared to the mean free path . From we must conclude that CaC6 is in the clean limit. On the other hand the maximum value of the gap in the distribution function, cm-1, puts CaC6 into intermediate limit, between dirty () and clean (). Lamura et al. Lamura et al. (2006) concluded that is in the dirty limit. Also conduction electron spin resonance measurements suggest that superconductivity in CaC6 can be described in the dirty limit. Muranyi et al. (2008) This contradiction, (clean limit) versus (intermediate limit), could be due to the overestimation of . The mean free path is calculated from using theoretical estimates for plasma frequency and Fermi velocity and will be reduced by increasing and reducing . Indeed, from the comparison of nm to a theoretical value of coherence lengthTinkham (1996) nm (we take cm-1 as the maximum of gap distribution) we see that the theoretical value of is overestimated.
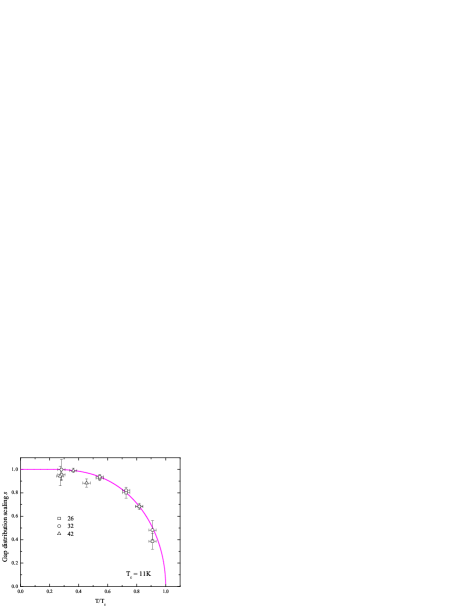
The gap scaling factor (Fig. 3) follows the temperature dependence of a -wave superconductor.Mühlschlegel (1959) The experimental errors close to , however, are too large to obtain an independent determination of from reflectance spectra. Smaller than expected reflectance above the gap in K spectra (Fig.1) can be caused by strong coupling effects that reduce the imaginary part of the complex conductivity. Shaw and Swihart (1968) It is not clear why such a deviation appears (for all measured samples) only at 3 K and not at 4 K, both temperatures substantially less than . We saw no evidence of the expected low-frequency phonon mode Calandra and Mauri (2005, 2006); Kim et al. (2006b); Hlinka et al. (2007) around cm-1 as it was outside the limits of optimal performance of our measurement set-up.
To conclude, we have measured the temperature dependence of far infrared reflectance spectra of CaC6. The results suggest that CaC6 is a -wave superconductor with an anisotropic gap. Our results provide evidence of strong coupling effects in the spectra at 3 K. The gap signature in the far infrared spectra indicates that CaC6 is in the dirty limit, in accordance with other experiments.
I Acknowledgments
Support by Estonian Science Foundation grants 5553, 6138, and 7011 is acknowledged.
References
- Weller et al. (2005) T. E. Weller, M. Ellerby, S. S. Saxena, R. P. Smith, and N. T. Skipper, Nat. Phys. 1, 39 (2005).
- Emery et al. (2005) N. Emery, C. Herold, M. d’Astuto, V. Garcia, C. Bellin, J. F. Mareche, P. Lagrange, and G. Loupias, Phys. Rev. Lett. 95, 087003 (2005).
- Lamura et al. (2006) G. Lamura, M. Aurino, G. Cifariello, E. D. Gennaro, A. Andreone, N. Emery, C. Hérold, J.-F. Marêché, and P. Lagrange, Phys. Rev. Lett. 96, 107008 (2006).
- Kim et al. (2006a) J. S. Kim, R. K. Kremer, L. Boeri, and F. S. Razavi, Phys. Rev. Lett. 96, 217002 (2006a).
- Hinks et al. (2007) D. G. Hinks, D. Rosenmann, H. Claus, M. S. Bailey, and J. D. Jorgensen, Phys. Rev. B 75, 014509 (2007).
- Mazin et al. (2007) I. I. Mazin, L. Boeri, O. V. Dolgov, A. A. Golubov, G. B. Bachelet, M. Giantomassi, and O. K. Anderson, Physica C 460-462, 116 (2007).
- Kim et al. (2007) J. S. Kim, L. Boeri, J. R. O’Brien, F. S. Razavi, and R. K. Kremer, Phys. Rev. Lett. 99, 027001 (2007).
- Bergeal et al. (2006) N. Bergeal, V. Dubost, Y. Noat, W. Sacks, D. Roditchev, N. Emery, C. Herold, J.-F. Mareche, P. Lagrange, and G. Loupias, Phys. Rev. Lett. 97, 077003 (2006).
- Kurter et al. (2007) C. Kurter, L. Ozyuzer, D. Mazur, J. F. Zasadzinski, D. Rosenmann, H. Claus, D. G. Hinks, and K. E. Gray, Phys. Rev. B 76, 220502(R) (2007).
- Glover and Tinkham (1956) R. E. Glover and M. Tinkham, Phys. Rev. 104, 844 (1956).
- Mattis and Bardeen (1958) D. C. Mattis and J. Bardeen, Phys. Rev. 111, 412 (1958).
- Pöpel (1991) R. Pöpel, IEEE Trans. Mag. 27, 1306 (1991).
- Sanna et al. (2007) A. Sanna, G. Profeta, A. Floris, A. Marini, E. K. U. Gross, and S. Massidda, Phys. Rev. B 75, 020511(R) (2007).
- Fujishiro et al. (1994) H. Fujishiro, M. Ikebe, K. Noto, M. Matsukawa, T. Sasaoka, K. Nomura, J. Sato, and S. Kuma, IEEE Trans. Mag. 30, 1645 (1994).
- Dressel and Grüner (2002) M. Dressel and G. Grüner, Electrodynamics of solids (Cambridge University Press, 2002).
- Zimmermann et al. (1991) W. Zimmermann, E. Brandt, M. Bauer, E. Seider, and L. Genzel, Physica C 183, 99 (1991).
- (17) Such an approach is not rigorous since the gap distribution function results from an average over different directions in Brillouin zone while the quasi-particle and photon interactionTinkham (1996) depends on the angle between the quasi-particle vector and the light vector.
- Jobiliong et al. (2007) E. Jobiliong, H. D. Zhou, J. A. Janik, Y.-J. Jo, L. Balicas, J. S. Brooks, and C. R. Wiebe, Phys. Rev. B 76, 052511 (2007).
- Muranyi et al. (2008) F. Muranyi, G. Urbanik, V. Kataev, and B. Buchner, Phys. Rev. B 77, 024507 (2008).
- Tinkham (1996) M. Tinkham, Introduction to Supereconductivity, International Series in Pure and Applied Physics (The McGraw-Hill, Inc., 1996), 2nd ed.
- Mühlschlegel (1959) B. Mühlschlegel, Z. Phys. 155, 313 (1959).
- Shaw and Swihart (1968) W. Shaw and J. C. Swihart, Phys. Rev. Lett. 20, 1000 (1968).
- Calandra and Mauri (2005) M. Calandra and F. Mauri, Phys. Rev. Lett. 95, 237002 (2005).
- Calandra and Mauri (2006) M. Calandra and F. Mauri, Phys. Rev. B 74, 094507 (2006).
- Kim et al. (2006b) J. S. Kim, L. Boeri, R. K. Kremer, and F. S. Razavi, Phys. Rev. B 74, 214513 (2006b).
- Hlinka et al. (2007) J. Hlinka, I. Gregora, J. Pokorny, C. Hérold, N. Emery, J. F. Marêché, and P. Lagrange, Phys. Rev. B 76, 144512 (2007).