Characterizing Video Responses in Social Networks
Abstract
Video sharing sites, such as YouTube, use video responses to enhance the social interactions among their users. The video response feature allows users to interact and converse through video, by creating a video sequence that begins with an opening video and followed by video responses from other users. Our characterization is over 3.4 million videos and 400,000 video responses collected from YouTube during a 7-day period. We first analyze the characteristics of the video responses, such as popularity, duration, and geography. We then examine the social networks that emerge from the video response interactions.
1 Introduction
Online social video networking sites allow for video-based communication among their users. Video-based functions are offered as alternative to text-based ones, such as video reviews for products, video ads and video responses [13]. A video response feature allows users to interact and converse through video, by creating a video sequence that begins with an opening video followed by video responses from other users.
In this paper, we present a thorough characterization of video response in a social networking site, namely YouTube. Streaming over 3.4 billion videos a month (as of December 2007) according to ComScore, YouTube is the most popular social video-based media network today generating high-volumes of Internet traffic. Our characterization of over 3.4 million videos spanning a one week period is done at two different levels. At the bottom level, video responses are characterized in terms of their popularity, duration, geographical origin, and other features. At the top level, social networks created by the interactions among users and videos are analyzed. Such a characterization is of interest for three reasons. The first is a technical reason, stemming from the necessity to understand video-based communication, in order to evaluate new protocols and design choices for video services. The second reason is the volume of traffic generated by video responses. The total number of views of the videos analyzed in our data set exceeds 20 billion and 14% of this total refer to views of video responses. The third reason is sociological, relating to social networking issues that influence the behavior of users interacting primarily with stream objects, instead of textual content traditionally available on the Web.
1.1 Contributions
Based on an extensive sample collected from YouTube, a dataset that consists of over 3.4 million videos collected over a one-week period, we provide a statistical analysis of video responses and a network analysis of how users make use of this functionality in social networking environment. The principal contributions of our study can be summarized as follows:
The distributions of video responses across responsive and responded users and responded videos follow power laws. This means that the majority of the video-based interactions in YouTube occur between a small fraction of users. Moreover, the majority of the video responses are concentrated on a small fraction of the videos.
The durations of responded videos and video responses follow Weibull distributions, although the duration of responses are more skewed towards shorter values. Moreover, there is a strong correlation between the duration of the responded video and the average duration of its responses.
A significant fraction (27%) of responses to a video are actually uploaded to YouTube before the original video is uploaded. However, about 42% of all responses are posted within one month after the original video, and 17% are posted at least 100 days after it. Thus, for some videos, new user interactions are initiated longer after it was expected.
The vast majority (99%) of the responded videos triggered interactions for which each user participated only once, resembling what occurs in a guest-book. Nevertheless, a few videos triggered very lively interactions, with each responsive user participating at least 3 times.
40% of the responded videos have a percentage of responses from the same country superior to 60%, which may be exploited in the design of content distribution mechanisms.
35% of the responded videos receive at least one self-response, that is, a response posted by the user who posted the original video. However, the correlation between the number of video responses and the number of views of a responded video is weak.
The community structure of the social network formed by video responses possesses a small strongly connected component (SCC) and large number of small communities (up to 20 members) and singletons (one degree nodes). We found that the network created by users of a SCC is tightly connected, with an average clustering coefficient equal to 0.137, which is much greater than 0.04 of the whole network. Our findings suggest that the community structure developed by video responses is at an early stage, for the size of the SCC is around 5% of the network size.
1.2 Related Work
Given the novelty of video response, it is natural to ask whether its characteristics are similar to traditional videos and other objects of the web. Indeed, over the last few years, there has been a number of studies that explored the various aspects of social networking sites. For example, the works in [2, 10, 4] explored the overall scope, structure, and relation patterns of the popular online social networks: Flickr, YouTube, LiveJournal, and Orkut. A study of YouTube is presented in [2]. Reference [5] studies temporal access and social patterns in Facebook. The authors analyze content characteristics and system issues that can be used to improve video distribution mechanisms, such as caching and peer-to-peer distribution schemes. Such studies are important because they allow us to understand characteristics of different types of online social networks. Another important consideration relates to the patterns of accesses targeting social networks and in particular how such access patterns impact the portion of web traffic induced by social networking sites. Unlike these studies, our analysis of YouTube focuses on characterizing video responses in online social networks. To the best of our knowledge, this is the first effort towards understanding the video response functionality in social network.
1.3 Paper Outline
The rest of the paper is organized as follows. Next section describes how we crawled and sampled YouTube. Section 3 presents a statistical characterization of video responses. In the following section we present a characterization of video interactions in the social network formed by relationships between users. We conclude and present directions for future research in Section 5.
2 Crawling a Social Network
To collect data, we visit pages on the YouTube site (that is, crawl) and gather information about YouTube video responses and their contributors. Every YouTube video post has a single contributor, who is a registered YouTube user. We say a YouTube video is a responded video if it has at least one video response. A responded video has a sequence of video responses listed chronologically in terms of when they were created. We say a YouTube user is a responded user if at least one of its contributed videos is a responded video. Finally, we say that a YouTube user is a responsive user if it has posted at least one video response.
A natural user graph emerges from video responses. At a given instant of time , let be the union of all responded users and responsive users. The set is, of course, a subset of all YouTube users. We denote the video response user graph as the directed graph , where is a directed arc in if user has responded to a video contributed by user . In general, the video response user graph have multiple weakly connected components. Some components may have thousands of users, and some components may have only two users. Ideally, we would like to obtain the complete video response user graph . Although YouTube provides lists of the 100 most responded videos of all time, it does not currently provide a means to systematically visit all the responded videos. In particular, it is difficult to find the users in the small components in the graph .
0.7
0.7
0.7
0.7
0.7
0.7
0.7
Instead, we design a sampling procedure that allows us to obtain a large representative subset of . For a given sampled subset of , let be the directed graph, where is a directed arc in if user has responded to a video contributed by user . Note that sampled graph is a sub-graph of . It is desirable that the sampled set of users has the following properties: 1) Each connected component in is a connected component in ; that is, the sampled subgraph consists of (entire) connected components from . This property is important in order to analyze the social networking interactions engendered by video responses. 2) The subset covers a large fraction of (at least 60%). Our sample would then include the majority of the responded and responsive users. 3) The most responded users are included in . This property ensures that we are including the most important users, and only neglecting users who have few responded videos. To this end, we designed the sampling procedure described in Algorithm 1.
Starting with any seed set, the above algorithm ensures that our resulting sample graph has the first property listed above, namely, consists of (some of the) connected components from the entire video response user graph . We discuss the other properties subsequently.
We ran this sampling procedure with two different seed sets. Our first seed set uses the contributors of the all-time top-100 responded videos. Our second seed set is based on the random sampling technique described in Algorithm 2.
0.5
0.5
0.5
0.5
0.5
Let be the sample graph determined with seed set consisting of the all-time top-100 most responded videos. We now verify that our sampling procedures have Properties 2 and 3 in addition to Property 1. Of the 100 random seed users, we find that 67 of those users belong to . Thus, our sampling scheme satisfies Property 2. To verify Property 3, we use the second data set (generated with the 100 random seeds), and rank order the 10 most, 100 most and 1000 most responded users. We find that our sampled graph contains all 10 of the 10 most responded users, 98 of the 100 most responded users, and 951 of 1000 most responded users. Thus, Property 3 is verified as well.
| characteristic | top-100 | random |
|---|---|---|
| Period of sampling | 09/21-09/26/07 | 10/21-10/24/07 |
| video-data | ||
| # videos collected | 3,436,139 | 3,974,579 |
| # video responses | 417,759 | 485,716 |
| # views | 20,645,583,524 | 24,380,755,065 |
| # views of responses | 2,826,822,374 | 3,309,004,711 |
| # videos without response | 3,225,560 | 3,729,522 |
| Common videos | 3,112,660 | |
| Common responded videos | 200,113 | |
| Common video responses | 372,566 | |
| User-data | ||
| # users collected | 160,765 | 182,725 |
| Common users | 146,799 | |
The basic statistics of our two crawl are provided in Table 1. To summarize, our all-time top-100 video crawler collected data about 3.4 million videos and 160 thousands users. We now discuss the data in more detail, focusing first on the video crawl, and then on the user crawl.


3 Video Response Characteristcs
Figure 1 (left) shows the distribution of the number of video responses posted by different users. Note that the 20% most responsive users contributed with 65% of all video responses whereas 84% of all responsive users posted, each, less than 5 video responses. In fact, the distribution is well fitted by a power-law distribution (Prob(i posts a video response) ) with . Similarly, Figures 1 (middle) and (right) show the distributions of the numbers of video responses per responded user and responded video, respectively. Both distributions are also well fitted by power-laws with and , respectively. Thus, most interactions are initiated by a few (responsive) users, involve few (responded) users and concentrate around a few videos.
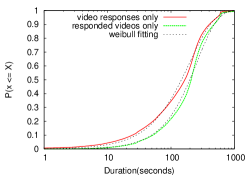
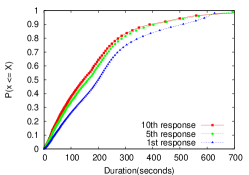
Figure 2 (top) shows the distributions of video durations, considering, separately, only responded videos and only video responses. Both distributions are very skewed, with 80% of all samples being under 5 minutes. In fact, both follow Weibull distributions 111The pdf for Weibull distribution is given by: , with parameters and , for video responses, and and for responded videos. However, video responses have durations slightly more skewed towards shorter values. Moreover, we found that, although the duration of a responded video has a small impact on the number of responses it receives (correlation coefficient ), there is a strong correlation between the duration of the responded video and the average duration of its responses (). Longer responded videos tend to receive longer responses. Moreover, Figure 2 (bottom) shows that, considering only the responses of videos that had at least responses, the duration distribution becomes more skewed as increases. These results mimic the expected pattern in real-life human interactions, whereas longer (but interesting) expositions tend to trigger longer replies, initially. However, replies tend to become shorter as the interaction progresses, and the discussion dies down.
Interestingly, we found that 25% of all video responses are self-responses, i.e., responses posted by the user who posted the original video. Roughly 35% of the responded videos received at least one self-response, and around 12% of them received only self-responses. Whereas some of these responses might be replies to other responses, others might be an attempt at self-promotion, aiming at gaining visibility in order to place video and user in the most-responded lists. Thus, a question that arises is whether a user can exploit the video response feature to raise its video popularity, i.e., if a video receives many responses, is it also viewed many times? The correlation coefficient between the number of responses and the number of views of a responded video shows this is not often the case (). If we disregard all responded videos with at least one self-response, the correlation increases somewhat (), but remains low, indicating that the popularity of a video can not be artificially increased by simply adding video responses to it. In other words, posting (self-)responses aiming at (self-)promotion does not necessarily pay off in YouTube.
A user can post a video response in one of three ways: 1) directly from the user’s webcam; 2) choose a video from one of the user’s own, pre-existing YouTube contributions; 3) upload a video from the user’s disk drive. Unfortunately, YouTube does not provide a means to automatically determine in which manner a video was created. We thus propose to categorize video responses based on the time it was uploaded to YouTube, relative to the upload time of the responded video. We define the Video-Response-Interval (VRI) as the upload time of the response minus the upload time of the responded video.
The cumulative distribution of the VRIs is shown in Figure 3 (left). About 27% of responses correspond to videos uploaded before the responded video, and thus, were certainly not created as responses to it. This might be explained by the video content itself. For instance, we observed that one of the responded videos having many previously uploaded responses explicitly actually requested existing YouTube videos for responses. On the other hand, it might also be the result of users uploading existing (and not necessarily related) videos as self-responses. Moreover, 42% of responses are added within the first month after the responded video was uploaded, indicating a prompt reaction from responsive users. Nevertheless, a non-negligible fraction (17%) of responses are added long after the responded video appeared in the system (i.e., VRI 100 days), meaning that some videos exhibit long-term popularity, and new interactions are initiated long after it was uploaded.
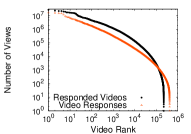
3.1 Video Response Popularity Distribution
Figure 3 (right) shows the rank distribution of responded videos and video responses in terms of number of views in YouTube. We observe that the total numbers of views for responsive and responded videos are not dominated by a very small number of very popular videos. From Figure. 3 (right), we calculated that there are more than 33,000 video responses and 57,000 responded videos that have been viewed more than 10,000 times each. The median number of views for the video responses and responded videos is 508 and 2,028 respectively, while 90% of video responses and responded videos we crawled were viewed more than 61 and 129 times, respectively. This in turn raises interesting questions about the consumption behavior of YouTube. Note that the number of views reported include both complete and incomplete views (where users stopped viewing after a few seconds or more). We conjecture that due to the low effort and cost of viewing a video and the rich interconnections between videos on the site, there is a large amount of fairly random surfing and exploration where visitors and users serendipitously explore videos. This could explain the large number of views of even unpopular videos and contrasts with traditional Web content, dominated by Zipf’s behavior. One may conjecture that a video service that charges even a small amount per video started would exhibit a very different behavior.

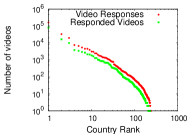
3.2 Video Response Geographical Distribution
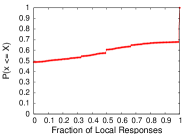
An important question that is often asked regarding web characterization studies has to do with the geographical representativeness of the sample. Geography and friendship have been used to build real social network models [9]. As evident from Figure 4 (left), the sample we characterize is fairly large in terms of the number of countries (as identified by the country described in the user profile) and the number of video responses and responded videos uploaded by users of different countries. Using the country identification, we are able to map the contributor population to over 236 countries. The top five countries in our sample account for 76.8% of total video responses uploaded to YouTube. The plots suggest a power law-like profile, with parameter () and () for video responses and responded videos, respectively. We also defined the percentage of local video responses as the ratio of video responses from the same country of the responded video to the total number of video responses. Figure 4 (right) shows the cumulative distribution of the percentage of local video responses over all responded videos of our sample. We notice that more than half of the “video conversations” involves at least some participants from the same country of the original contributor. For example, 40% of responded video has a percentage of local responses superior to 60%, which may be useful information for designing content distribution mechanisms.
3.3 Video-Based Interactions
Our characterization of user interactions at the video level consists of examining the sequence of video responses following a YouTube video. For each responded video , let denote the number of video responses, and denote the sequence of responses as , where is the video response.
A user may add multiple video responses in sequence to the same video. We define a sequence of responses as a series of consecutive responses from the same user to video . Thus, the ordered list of video responses to video can also be expressed as , , where is the sequence of consecutive responses from user . Note that the same user may post multiple (non-consecutive) sequences of responses to the same video , i.e., we may have for [j-1,j+1].
In the following example, video received 7 video responses grouped into 4 sequences, posted by 3 users (, and ):
Our characterization focuses on a simple metric, defined as the ratio U/S of the Number of Unique Responsive Users to the Number of Sequences of Responses. In the above example, this ratio is 0.75. A video-based interaction with a ratio U/S close to 0 indicates an asynchronous video dialogue between a relatively small number of highly active users, who keep the discussion alive with multiple (not necessarily consecutive) responses to each other. This type of interaction is akin to the exchanges and debates in a parlor or public forum, in which the communication underscores a many-to-many dialogue between participants. At the other extreme, when the ratio approaches one, there may be two types of interaction. One type occurs when the number of unique responsive users equals the number of sequences of responses, resembling a register, petition or guest-book, for which the communication is many-to-one, and the purpose of a video response is to record a comment (or support a petition, etc.). The other type has just one user posting a single sequence.
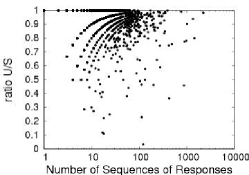
Figure 5 shows the ratio U/S versus the number of sequences of responses for each responded video in our data set. Different types of interactions can be seen across all responded videos, characterized by a wide range of U/S values. However, only a relatively small number of videos triggered lively interactions, with each responsive user adding on average at least 3 sequences of responses. In fact, the vast majority of the responded videos (99%) triggered interactions with only one sequence of responses per responsive user (i.e., ratio equal to 1). In fact, Figure 5 shows these interactions occur among groups of responsive users of varying sizes (i.e., number of sequences).
4 Network Characteristics
Out of the several networks that emerge from the user interactions enabled by YouTube features, we select the user graph (see Section 2) for an in-depth analysis. Table 2 presents the main statistics of the network built from the all-time top-100 data set and for its largest strongest connected component.
| Characteristic | Dataset | Largest SCC |
|---|---|---|
| # nodes | 160,074 | 7,776 |
| # edges | 244,040 | 33,682 |
| Avg Clustering Coefficient | 0.047 | 0.137 |
| # nodes of largest SCC | 7,776 | 7,776 |
| # components | 149,779 | 1 |
| -0.017 | 0.017 | |
| Avg distance | 8.40 | 8.40 |
| Avg (CV) | 1.53 (9.38) | 4.33 (3.14) |
| Avg (CV) | 1.53 (1.717) | 4.33 (1.28) |
| Avg | 3.06 | 8.66 |
4.1 Degree Distribution
The key characteristics of the structure of a directed network are the in-degree and the out-degree ) distributions. As shown in Figure 6, the distributions of the degrees for the entire graph follow power laws , with exponent and with the following coefficient of determination: and . The scaling exponents of the whole network lie in a range of 2.0 and 3.4, which is a very common range for social and communication networks [3]. Our results agree with previous measurements of many real-world networks that exhibit power law distributions, including the Web and social networks defined by blog-to-blog links [8].


The in-degree exponent is smaller than the exponent of the out-degree distribution, indicating that there are more users with larger in-degree than out-degree. This fact suggests a link asymmetry in the directed interaction network. Unlike other social networks that exhibit a significant degree of symmetry [10], the user interaction network shows a structure similar to the Web graph, where pages with high in-degree tend to be authorities and pages with high out-degree act as hubs directing users to recommended users [7]. In order to investigate this point further, Figure 7 (left) shows the cumulative distribution of ratios between in-degree and out-degree for the user interaction network. The network has 60% of the users with out-degree higher than in-degree and 5% of the users with significantly higher in-degree than out-degree. This is evidence that a few users act as “authorities” and “hubs”. Interestingly, we have observed in our dataset that authority-like users (that is, highly responded users), with high in-degree, are typically media companies that upload professional content, including sports, entertainment video and TV series. This type of node in our network receives video response from many YouTube users. Nodes with very high out-degree may indicate either very active users or spammers, i.e., users that distribute content (i.e., video responses) that legitimate users have not solicited.
According to [12], assortative mixing and high clustering coefficient are two graph theoretical quantities typical of social networks. We now investigate assortative mixing. Clustering Coefficient is analyzed in the next section. A network is said to exhibit assortative mixing if the nodes with many connections tend to be connected to other nodes with many connections. Social networks usually show assortative mixing. The assortative (or disassortative) mixing is evaluated by the Pearson coefficient , which is calculated as follows. [11]:
| (1) |
where and are the excess in-degree and out-degree of the vertices that the ith edge leads into and out of, respectively, and is the total number of edges in the graph.
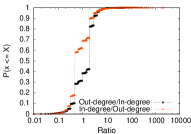
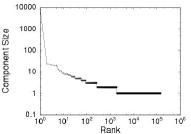
Table 2 shows values of for the directed graph of the interaction network. The video-response network has a disassortative mixing , where high degree nodes preferentially connect with low degree ones and vice versa. By contrast social networks have significant assortative mixing, which accords with the notion of social communities. So, the entire user interaction graph does not show evidence of the formation of a large social community.
4.2 Clustering Coefficient
It has been suggested in the literature that social networks possess a topological structure where nodes are organized into communities [12], a feature that can account for the values for the clustering coefficient and degree correlations. The clustering coefficient of a node , is the ratio of the number of existing edges over the number of all possible edges between ’s neighbors. The clustering coefficient of a network, , is the mean clustering coefficient of all nodes. The average CC over the whole network is , whereas the mean clustering coefficient for a random graph with identical degree distribution but random links is , which shows the presence of small communities in the video-response network. The leftmost part of Figure 8 shows the cumulative distribution of the clustering coefficient. The network contains a significant fraction of their nodes with zero clustering coefficient. Specifically, of all nodes in the entire user interaction network have . This feature indicates that there is a clear difference on average between clustering in the entire network and the components of the network. The right part of the figure shows how the clustering coefficient varies with the node out-degree. Higher values of the clustering coefficient occur among low degree-nodes, suggesting the lack of large communities around high-degree nodes. Our conjecture is that highly responsive users do not necessarily have social links with the contributors of the videos that they are responding to. Therefore, there may not exist a sense of community among the users that receive video responses from a single responsive user. Low degree nodes might explain the formation of very small communities, composed of a few people like a family or a group of friends that share videos and interact through video responses.


Table 2 shows the size of the largest strongly connected component (SCC) and the total number of other strongly connected components of the video response user graph (, ). Figure 7 (right) shows the distribution of the size of the networked components sorted from the largest component to the smallest one. The distribution suggests a general structure that includes the largest SCC, the middle components (i.e., 1974), and a large number of components with just one node (i.e., 147805). As we are working with a directed graph, these components with size one are nodes with links in only one direction. The middle components are tightly connected groups of users, representing small size communities (e.g., families and groups of friends) that express their interests and establish communication via video responses. The largest SCC represents about 5% of the nodes, but it is considerably larger than the others. It concentrates 10% of the views and 22% of the video responses and deserves further analysis. Although it includes about 5% of the nodes, its size is comparable to the size of SCC in other networks, derived from blogosphere samples [1]. The differences in size of connected components may be due to time factors, that account for the adoption by users of specific features (i.e., video response) in social networking environments. In order to understand its characteristics, we investigate network properties of the giant component in the video response user graph. The average clustering coefficient of the giant component is , three times greater than the clustering coefficient of the entire network. Thus, user interactions captured by the giant component might form a more tightly connected community.
5 Conclusion
We crawled YouTube to obtain a large representative subset of the video response user graph. Our characterization was done from two perspectives: video response view and interaction network view. In addition to providing statistical models for various characteristics (popularity profiles, duration, geographical, etc.), our study has unveiled a number of interesting findings. For example, the characteristics of social video sharing services are significantly different from those of traditional stored object workloads, based on text and image. Part of the difference stems from the change from textual communication to stream-based communication, creating a new paradigm for online communication.
Our current and future work is focused on leveraging many of the findings and conclusions presented in this paper along a number of dimensions. First, we are looking into using the characteristics found in this paper as models to be used for designing mechanisms for content distribution (i.e., pre-fetching, replication and caching) based on social network characteristics. For instance, if a particular stream is posted by a user, then for a distribution server at a particular location, we can associate that stream with the social community of that individual, identified by the video-response network. Second, we are evaluating the use of network node characteristics (i.e., degree distribution, degree correlation, etc) to identify spam in online social networks [6].
References
- [1] N. Ali-Hasan and L. Adamic. Expressing social relationships on the blog through links and comments. In Int’l. Conf. on Weblogs and Social Media, 2007.
- [2] M. Cha, H. Kwak, P. Rodriguez, Y. Ahn, and S. Moon. I tube, you tube, everybody tubes: Analyzing the world’s largest user generated content video system. In Proc. of IMC, 2007.
- [3] H. Ebel, L. Mielsch, and S. Bornholdt. Scale-free topology of e-mail networks. Physical Review E, 66:035103, 2002.
- [4] P. Gill, M. Arlitt, Z. Li, and A. Mahanti. Youtube traffic characterization: A view from the edge. In Proc. of IMC, 2007.
- [5] S. Golder, D. Wilkinson, and B. Huberman. Rhythms of social interaction: Messaging within a massive online network. Proc. of the Int’l. Conf. on Communities and Technologies, 2007.
- [6] P. Heymann, G. Koutrika, and H. Garcia-Molina. Fighting spam on social web sites: A survey of approaches and future challenges. IEEE Internet Computing, 11(6):36–45, 2007.
- [7] J. Kleinberg. Hubs, authorities, and communities. ACM Computing Surveys, 31, 1999.
- [8] R. Kumar, J. Novak, P. Raghavan, and A. Tomkins. On the bursty evolution of blogspace. In Proc. of WWW, 2003.
- [9] D. Liben-Nowell, J. Novak, R. Kumar, P. Raghavan, and A. Tomkins. Geographic routing in ocial network. In Proc. of National Academy of Sciences, 2005.
- [10] A. Mislove, M. Marcon, K. Gummadi, P. Druschel, and B. Bhattacharjee. Measurement and analysis of online social networks. In Proc. of IMC, 2007.
- [11] M. Newman. Assortative mixing in networks. Phys. Rev. Letters, 89:208701, 2002.
- [12] M. Newman and J. Park. Why social networks are different from other types of networks. Phys. Rev. E, 68:036122, 2003.
- [13] M. Shannon. Shaking hands, kissing babies, and…blogging? Communications of the ACM, 50, 2007.