Model-based pattern speed estimates for 38 barred galaxies
Abstract
We have modelled 38 barred galaxies by using near-IR and optical data from the Ohio State University Bright Spiral Galaxy Survey. We constructed the gravitational potentials of the galaxies from -band photometry, assuming constant mass-to-light ratio. The halo component we chose corresponds to the so called universal rotation curve. In each case, we used the response of gaseous and stellar particle disc to rigidly rotating potential to determine the pattern speed.
We find that the pattern speed of the bar depends roughly on the morphological type. The average value of corotation resonance radius to bar radius, , increases from in types SB0/a – SBab to in SBb and in SBbc – SBc. Within the error estimates for the pattern speed and bar radius, all galaxies of type SBab or earlier have a fast bar (), whereas the bars in later type galaxies include both fast and slow rotators. Of 16 later type galaxies with a nominal value of , there are five cases, where the fast rotating bar is ruled out by the adopted error estimates.
We also study the correlation between the parameter and other galactic properties. The clearest correlation is with the bar size: the slowest bars are also the shortest bars when compared to the galaxy size. A weaker correlation is seen with bar strength in a sense that slow bars tend to be weaker. These correlations leave room for a possibility that the determined pattern speed in many galaxies corresponds actually that of the spiral, which rotates more slowly than the bar. No clear correlation is seen with either the galaxy luminosity or colour.
keywords:
galaxies: evolution – galaxies: fundamental parameters – galaxies: kinematics and dynamics – galaxies: structure1 Introduction
Studies in near-IR, where the extinction is lower than in visual wavelengths and majority of light comes from the old stellar population, have shown that about 60-70% of all spiral galaxies have a large scale stellar bar (Eskridge et al., 2000; Whyte et al., 2002; Laurikainen et al., 2004; Menéndez-Delmestre et al., 2007; Marinova & Jogee, 2007). According to recent analysis of over 2000 spiral galaxies (Sheth et al., 2008), the bar fraction decreases from about 65% in the local universe to about 20% at redshift (see also Abraham et al., 1999; Elmegreen et al., 2004; Jogee et al., 2004; Menéndez-Delmestre et al., 2007). Anyhow, bars are so common that they are either very robust or they represent a recurrent phenomenon in the life of a spiral galaxy (Bournaud et al., 2005). In contrast with some earlier studies (Thompson, 1981; Elmegreen et al., 1990), Hernández-Toledo et al. (2007) claim the bar frequency is roughly the same in different environments – modest interactions do not seem to play a major role in bar formation and destruction.
Bars can be roughly divided into two classes based on their light distribution: flat and exponential bars (Elmegreen & Elmegreen, 1985; Elmegreen et al., 1996a). In the first type, which is more typical to early type barred galaxies, the radial surface brightness profile along the bar major axis is flatter than in the surrounding disc, whereas in the exponential bars the profile is quite similar to the surrounding disc. Furthermore, the flat bars can display twisting of isophotes (Elmegreen et al., 1996b). Bar morphology can also be either classical or of ansae-type, characterized by blops at the both ends of the bar (Laurikainen et al., 2007; Martinez-Valpuesta et al., 2007).
Another approach to characterize a bar is its strength. Some attempts have based on the ellipticity of the deprojected bar (e.g. Martin, 1995; Whyte et al., 2002; Laurikainen & Salo, 2002). Recently, there have been attempts to estimate the actual gravitational perturbation of the bar by using near-IR photometry (Buta & Block, 2001; Laurikainen & Salo, 2002; Laurikainen et al., 2004; Laurikainen et al., 2005; Buta et al., 2005). There is also another bar strength estimate, namely the -Fourier amplitudes of density (Laurikainen et al., 2004; Laurikainen et al., 2005), which is an approximation of the relative mass of the bar. All these bar strength estimates are discussed with respect to the Hubble sequence by Laurikainen et al. (2007).
Perhaps the most important parameter defining a bar is its pattern speed, , or how fast the bar rotates. In principle, this determines how far the orbits of stars and gas clouds are affected by the bar. The pattern speed has a physical upper limit – a bar cannot reach beyond its corotation resonance (CR) radius , i.e. the region in the disc where the angular speed of circular rotation equals the bar pattern speed. This limitation is based on the studies of stellar orbits in barred potentials – the orientation of the major axes of closed orbits becomes perpendicular with the bar beyond , thus the orbits in the outer disc are not able to support the bar (Contopoulos, 1980). On the other hand, there is no evident lower limit based on stellar orbits for the bar pattern speed.
In the literature an often used nomenclature is based on the value of a dimensionless parameter , where is the semi major axis of the bar. The cases where are usually called “fast bars”, whereas those with a larger ratio are “slow bars” (Debattista & Sellwood, 2000). This is shown as a schematic drawing in Fig. 1. Considerable effort has been devoted to determine for individual galaxies and to study if it depends on other properties of the bar itself or the other galactic components.

One way to study the evolution of galaxies is to make self-consistent N-body simulations, where the original particle distribution forms different kinds of structures depending on its initial stage. If a bar forms by a global bar instability in these simulations, it tends to be fast rotating (Sellwood, 1981). On the other hand, it has been suggested that if a bar forms in a galaxy due to an interaction with other galaxies, it can be a slow rotator, perhaps extending only near its inner Lindblad resonance (Miwa & Noguchi, 1998). This may also be the case with gradual bar growth (Lynden-Bell, 1979), or when the initial bulge-to-disc mass ratio is low (Combes & Elmegreen, 1993). The pattern speed of the bar does not depend only on its initial value – the bar interacts with the other components of the galaxy. Secular evolution due to interaction between the bar and the outer disc decelerates the bar rotation, but this seems to be compensated by the growth of the bar length by capturing more particles (Sellwood, 1981). The situation is different with the interaction between the bar and the dark halo: if the halo density is high in the inner parts of the galaxy, the resonant interaction can decelerate an initially fast rotating bar so much that it becomes a slow rotator (Debattista & Sellwood, 1998; Athanassoula, 2003). Thus, the observed bar pattern speed could be considered as a rough estimator for the halo contribution.
Much weight has been given to a model-independent kinematic method, the so-called Tremaine–Weinberg method, hereafter TW (Tremaine & Weinberg, 1984). It is based on photometric and spectroscopic observations along slits parallel to the galaxy’s major axis and assumes a rigidly rotating component, which satisfies the continuity equation. TW-method has been used to determine pattern speeds of about 20 large scale stellar bars. The results range from probably unphysical to slow bar regime with . This has been considered to be in accordance with fast bars, at least when the quite large error estimates (e.g. due to sensitivity to errors in the position angle of the disc, Debattista, 2003) are taken into account (Kent, 1987; Merrifield & Kuijken, 1995; Gerssen, Kuijken & Merrifield, 1999, 2003; Aguerri, Debattista & Corsini, 2003; Debattista & Williams, 2004; Corsini, Aguerri, Debattista, Pizzella, Barazza & Jerjen, 2007; Treuthardt, Buta, Salo & Laurikainen, 2007). This apparent lack of slowly rotating bars has been interpreted to indicate that the density of a dark halo is small in the inner parts of barred galaxies (Debattista & Sellwood, 2000; Aguerri et al., 2003), which is in disagreement with some cosmological simulations of structure formation, typically producing centrally peaked dark matter component (Navarro et al., 1996). However, due to limitations set by the initial assumptions, measurements using stellar absorption line spectrometry have been made almost exclusively for SB0-galaxies, which are almost free of gas and dust.
Although some attempts (Zimmer et al., 2004; Rand & Wallin, 2004) have been made to use TW-method with CO observations, the pattern speeds of late type barred galaxies have been usually determined by various indirect methods. Many of these rely on morphological features in barred galaxies such as spiral arms, rings or leading offset dust lanes. In a classic scenario, a two-armed spiral starts from the ends of the bar, but exceptions to this are not rare: there can be an “empty” region between the bar and the spiral (e.g. NGC 210) or an offset between the bar position angle and the starting points of the spiral arms (e.g. NGC 799). There can also be more than two arms either in the whole scale of spiral structure (e.g. ESO 566-24) or as a multiply armed outer disc (e.g. NGC 4303). The clearest correlation with the bar properties is observed in the sizes and shapes of rings (for a detailed review, see Buta & Combes, 1996): outer rings whose semi major axis is about twice the bar radius and inner rings whose major axis is usually the same as the major axis of the bar. There is also a third ring type, the nuclear rings, whose radius is roughly 1/10 of the bar radius, but with a large scatter. Leading offset dust lanes are straight or curved dust features inside the bar and are located in its leading side.
Models of individual galaxies have been constructed either by fitting analytical potential components to observations or by determining the potential from photometry, making some assumption about mass-to-luminosity ratio, orientation and internal geometry of galaxies. In principle, modelling is more economical than using TW-method - the pattern speed can be estimated by comparing the simulated and observed morphology. Naturally, kinematical observations can help to determine the acceptable parameter range. Modelling has produced both high and low pattern speed estimates for the bars (Hunter et al., 1988; Sempere et al., 1995; Lindblad & Kristen, 1996; Salo et al., 1999; Rautiainen et al., 2004). The given error estimates of models are typically smaller than with TW-method.
Pattern speed estimates have also been done by identifying various morphological or photometric features with resonances. Inner and outer rings are usually considered to form by gravitational torque of the rotating bar, which causes gas to flow in the radial direction. The net torque vanishes in major resonances, where gas then accumulates (Buta & Combes, 1996). Comparison with results of gas dynamical simulations and analysis of orbits in barred galaxies have led to the following identifications: an outer ring should be located near the Outer Lindblad resonance (OLR) and the inner ring near the inner 4/1-resonance, which is located inside (Schwarz, 1981, 1984; Byrd et al., 1994; Salo et al., 1999; Rautiainen & Salo, 2000; Patsis et al., 2003). When the rotation curve is known, these resonance identifications can be used to determine the pattern speed (Buta & Purcell, 1998). Another approach is based on two-colour photometry (Puerari & Dottori, 1997): the location of shock induced star forming regions should change side related to spiral arms when crossing . This crossing should be detectable from two-colour photometry. Especially, the results of Aguerri et al. (1998) gave a hint (the total sample consisted of 10 galaxies) that late type spirals could be slower rotators than early types.
In addition there are at least two other methods worth mentioning. A kinematical method to determine the corotation radius, which is based on the residual patterns in the velocity field after removal of circular velocities, was suggested by Canzian (1993). However, it has been rarely applied. Recently, Zhang & Buta (2007) suggested that the calculated phase shifts between potential and density could be used to determine . The validity of this approach is still questionable: for several galaxies it found corotation radii well inside the bar, which is in disagreement with the analysis of orbits in barred potentials.
Using the previously published pattern speed estimates in studying a possible dependency on the morphological type is problematic. Very different methods have been used, the data is of uneven quality or the definition of the bar differs. There are several papers where quite successful simulation models are presented, but only one pattern speed has been tried (e.g. by assuming ) – this cannot be taken as a determination of the pattern speed.
Large galaxy surveys and the increase of computing power makes it possible to improve the situation by mass production of galaxy models: here we present a simulation series where we estimate the pattern speeds of 38 moderately inclined barred galaxies, using data from the Ohio State University Bright Spiral Galaxy Survey (Eskridge et al., 2002, hereafter OSUBSGS). To our knowledge, this is the largest sample of barred spiral galaxies whose pattern speeds are determined with a consistent method. Furthermore, the morphological types of these galaxies range from SB0/a to SBc, based on Third Reference Catalogue of Bright Galaxies (de Vaucouleurs et al., 1991, hereafter RC3), so that each morphological type is represented by several galaxies. The initial modelling results for this sample were published in Rautiainen et al. (2005, hereafter RSL2005), and part of the analysis in this paper was also presented in Salo et al. (2007).
Whereas we find all the bars of early type galaxies (SBab or earlier) of the sample are fast rotators, our models also suggest that galaxies of later morphological types include both fast and slow rotating bars. The slow rotation seems to be related to the small size of the bar. An alternative interpretation to this is that the spiral arms in these galaxies have a lower pattern speed than the bar, a situation often seen in N-body models (Sellwood & Sparke, 1988; Rautiainen & Salo, 1999).
2 Modelling
Our modelling method is essentially the same as we used in modelling IC 4214 and ESO 566-24 (Salo et al., 1999; Rautiainen et al., 2004), the main difference being that we do not have kinematical data for this larger sample. We assume that the -band light distribution corresponds to the projected distribution of luminous matter (constant ) and that there is only one pattern speed in each galaxy.
We simulated the behavior of two-dimensional discs of collisionless stellar test particles and inelastically colliding gas particles in the determined potentials. In each collision, the relative velocity component of two gas particles in the direction joining the particle centres was reversed and multiplied by the coefficient of restitution, here assumed to be zero. The main modelling parameter was the pattern speed of the non-axisymmetric part of the potential. For more details on the simulation code, see Salo (1991) and Salo et al. (1999). The best fitting pattern speed and a rough estimate of the error (the average error estimate for is about %) was determined by visual comparison between the simulation morphology and the morphology in the - and -band images.
2.1 Mass model
We used the -band images from the OSUBSGS, for which a bulge–disc–bar decomposition was made by Laurikainen et al. (2004). This multiple-component process gives more realistic bulge parameters than fitting just disc and bulge. For each image the bulge component was first removed, after which the disc was deprojected to face-on orientation. The light distribution and surface density of the disc was approximated by a Fourier decomposition using the same approach as in Laurikainen & Salo (2002).
The disc gravity was calculated using even azimuthal components from m=0 to 8. The strongest of the odd components is usually m=1. However, it can represent lopsidedness caused by a recent interaction and even if it is related to an internal mode, it can have a different pattern speed than the m=2 mode. The omission of odd modes can cause some of the models look more regular than the observed galaxy.
In the vertical direction, an exponential distribution was assumed, with a constant scale height throughout the disc: the scale height was chosen according to the morphological type of the galaxy, using the typical ratio of vertical to radial scale lengths given by de Grijs (1998). The gravitational potential of the bulge was added to the disc potential, assuming that the bulge mass is spherically distributed. In our standard mass model we also included a dark halo component based on the universal rotation curve of Persic et al. (1996), in a similar manner as in Buta et al. (2004). To calculate the halo profile, we used calculated from the RC3 and NED (NASA/IPAC Extragalactic Database) data and distance from Tully (1988) (except for NGC 6782 for which the distance was calculated from the radial velocity assuming Hubble constant ). For more details of the potential calculation see Laurikainen & Salo (2002). An example of a calculated rotation curve and corresponding frequency diagram showing (circular frequency) and (where is the epicycle frequency), is shown in Fig. 2.

Because we do not have kinematical data, we cannot fine-tune our mass models. However, we can estimate the robustness of our pattern speed fits by trying different mass models. In addition to our standard model with universal rotation curve, we also made simulations without the dark halo component. In general, the calculated rotation curves were then falling in the outer parts of the discs, but the determined pattern speeds were quite similar because the fitting was done mostly using features in the inner parts. For eight galaxies (six with slow bars, two with fast bars), we also studied the effect of increasing the halo contribution. This was tested by multiplying the even Fourier amplitudes of the force by a factor 0.75 or 0.5. The effect to the fitted pattern speed was quite small, in all cases within the error estimates of the standard model series. In a couple of cases, the fit was marginally better when the amplitudes were multiplied by 0.75, but in all cases the fit was worse with multiplication factor 0.5. This is in good agreement with our tests with the mass models for ESO 566-24 (see Figures 4 and 12 in Rautiainen et al., 2004), where we found that three mass models (no halo, a halo closely corresponding to universal rotation curve and dominating halo) all gave essentially the same pattern speed, although the quality of the fit was clearly different. Also, modifying the mass model so that the major axis rotation curve determined from the simulated velocity field matched the observed one as closely as possible, changed the corotation resonance distance only slightly.
2.2 Bar radius
There is no unambiguous way to determine the bar radius (for a detailed analysis see e.g. Athanassoula & Misiriotis, 2002). Some approaches rely on Fourier analysis of the surface brightness: the bar is identified with the region where the (or ) phase angle is almost constant, or where the amplitude drops to a certain fraction of its maximum value. Another method is to fit ellipses to isophotes – bar radius is then determined as the radius where the ellipticity reaches a maximum or where there is a steep drop in it. Besides these, there are also several other methods.
In RSL2005 we estimated lengths of the bars by using visual inspection of deprojected H-band images and isophotes and Fourier phase angles. In this study,we have basically followed the same approach as Erwin (2004, 2005) (see also Michel-Dansac & Wozniak, 2006), with slight modifications. We first remove the surface brightness of the fitted bulges from the images and then deproject them. Next ellipses are fitted on the isophotes of the deprojected images by using routine ELLIPSE in IRAF. For the lower limit of the bar radius we normally use the semimajor axis of maximum ellipticity (the outermost maximum that is still within the bar). As the upper limit we use which is the minimum of two ellipse-fit measures – the first minimum ellipticity outside , or the point where the position angles of the fitted ellipses differ more than 10∘ from the position angle of the bar (the smaller one of these is chosen). If a galaxy have an inner ring that interferes the determination of and/or , we use the inner edge of the ring as the lower limit and its outer edge as the upper limit for the bar radius, both measured along the bar major axis. The bar radius is then determined as and its error estimate is taken as . The adopted values are given in Table 1, which also lists the error estimates. The error estimates in the bar radius are in range 4% – 24 %, the average being about 14%.
When comparing our results with other bar length measurements, we limit to those done with near-IR photometry. The bar lengths used in this study are on average about 10% longer than the values given by Laurikainen et al. (2004), who used the phase angle method. This typically corresponds to our lower limits for the bar lengths. In five cases our bar radius estimate is clearly smaller compared to Laurikainen et al. (2005): the difference is related to the identification of the bar: for example if a galaxy has an outer ring of type , then the innermost part of the ring is close to the major axis of the bar, and can make the phase angle almost constant far beyond the actual bar region. A good example of this is NGC 3504.
Eleven of our galaxies are common with Erwin (2004, 2005), who used essentially the same method to determine the bar radius. Their bar radius estimates (taking into account possible differences in the adopted orientation parameters) are in good accordance with our results: typically our bar radius estimate is between their values for and , and if that is not the case, the difference is only marginal. The only exception of this is NGC 4303, for which we get 60 % higher value.
Marinova & Jogee (2007) used the OSUBSGS images in their study of bar properties. They give bar radii based on isophote ellipse fitting for 34 galaxies that are also in our sample. Typically our bar radius estimates are few percent larger than their values (median is about 5%), which is not surprising taking into account that this is expected to correspond to our lower limit. The difference is largest for NGC 1317 where Marinova & Jogee (2007) gives measurements for a feature we consider to be a secondary bar or a nuclear ring. It is the only case in their sample, where the given bar radius is not within our error estimates. In addition to previous examples, three of the galaxies are common with Laine et al. (2002) (who used the maximum of fitted ellipticity) and one with Reese et al. (2007) (distance where 10% of the maximum of fitted bar intensity profile is reached). Our bar radius estimates agree well with their results when error estimates are taken into account.
2.3 Defining the best fit
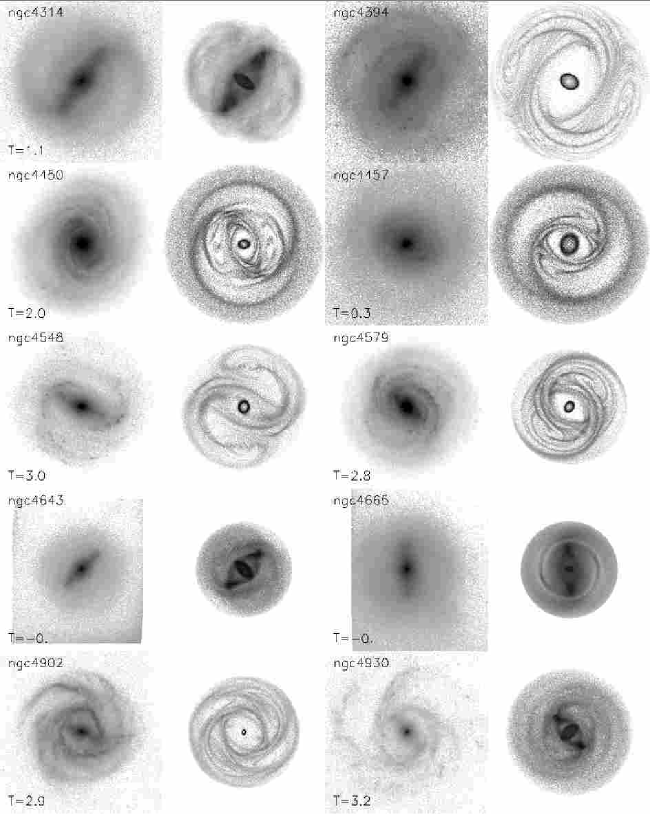
The morphological features we used in the comparison are typically the spiral arms, the inner rings which surround the bar, and the outer rings. With spiral arms we compared their extent, location and pitch angles, and occasionally other features such as straight arm segments. With rings we compared the shapes and sizes to the observed ones. This comparison was done with the help of a crosshair figure (cross + circles indicating the disc scale length and its multiples), that was overplotted on both the galaxy images and the modelled gas and stellar particle distributions.
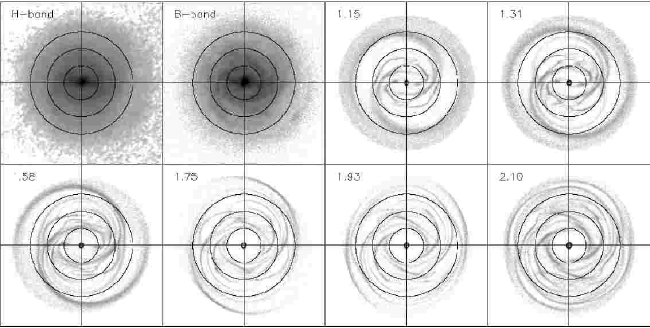
An example of our modelling approach is shown in Fig. 3, where we compare models with six different pattern speeds to - and -band images of NGC 4303. In a few cases we could not determine a single best-fitting pattern speed because the outer parts favored lower pattern speed than the inner parts. A possible reason for this is that a galaxy might have many pattern speeds so that the spiral rotates more slowly than the bar. This is often seen in N-body simulations of barred galaxies (Sellwood & Sparke, 1988; Masset & Tagger, 1997; Rautiainen & Salo, 1999). If two fits are considered to be of equal quality, the value adopted in this study corresponds to the smaller (faster bar), best characterizing the bar region. The ambiguity of pattern speed determination was also faced by Lindblad & Kristen (1996): for galaxy NGC 1300 they found two values giving or , both producing equally good fit.

Several of the galaxies contain leading offset dust lanes in their bars. Although such features are sometimes seen also in our models (see Fig. 3), we did not include them to pattern speed determination: the dust lanes correspond to highest density in the interstellar medium and it is probable that our gas modelling method (Salo, 1991) is not suitable for such situations.
Most of our models contain features in their gas components that look like nuclear rings observed in galaxies. Although several studies have connected nuclear rings to inner Lindblad resonance (ILR) or resonances, it has been claimed, based by gas dynamical models, that they are actually not related to resonances but to orbits in the central part of the bar (Regan & Teuben, 2003). Furthermore, in the models of Regan & Teuben the nuclear rings shrank even when the gravitational potential was constant. Even so, in our previous models of IC 4214 and ESO 566-24, the model which gave the best fit to overall morphology and kinematics, produced also a nuclear ring whose major axis diameter was the same with that of the observed ring. However, we have not included the nuclear rings to comparison with the sample galaxies: the image quality is usually not good enough to show a possible nuclear ring and the gravitational potential, calculated from the -band image, is probably not accurate enough in the innermost parts due to low resolution (one pixel corresponds to 0.05 – 0.2 kpc) Also, some of the galaxies included active galactic nuclei or central star bursts, which affect the central parts of the brightness profiles even in the -band, and thus also the deduced potentials (see Figs. 2 and 3 in Salo et al., 1999).
In addition to gaseous nuclear rings, our models often show distinct stellar features, whose major axis is perpendicular to the bar, in the same region. These features, which are usually not seen in real galaxies, are related to -orbits. Patsis (2005) demonstrated that -features can be removed from the collisionless test particle models by fine-tuning the initial conditions. On the other hand, this region often has a secondary bar of about similar size as a typical nuclear ring but a different pattern speed than the main bar (e.g. Friedli & Martinet, 1993; Rautiainen & Salo, 1999; Maciejewski & Sparke, 2000; Heller et al., 2001; Rautiainen et al., 2002; Maciejewski, 2006).


3 Notes on individual galaxies
Here we give comments on some of the modelled galaxies.
NGC 289: this SBbc () galaxy has a small bar, the inner spiral arms start from the ends of the bar. There is also an extended outer spiral structure, which bifurcates from the inner spiral arms. The best-fitting model, which sets reproduces the inner spiral, the bifurcations and the inner part of the outer spiral (see Fig. 4). The outermost part of the outer spiral structure is not reproduced, but it can be related to an interaction with a small companion galaxy, LSBG F411-024. model sets much outside
NGC 613: this SBbc () galaxy has a bar, inner ring and several spiral arms emerging from the ring. The Fourier phase angle method gives too high bar radius, well in the area of spiral arms. The fit, which sets , is not very good (see Fig. 4): only the inner ring and small parts of the arms are reproduced. The inner ring would allow also a bit higher pattern speed, which would set the galaxy clearly to the domain of fast bars.
NGC 1187: this SBc () galaxy has a bar with three spiral arms emerging from it. The best-fitting model (see Fig. 4), setting , has four arms due to using even Fourier components, three of which corresponds well the observed arms. The error estimate for is quite large, and a fast-bar solution cannot be ruled out.
NGC 1241: in this SBb () galaxy the bar is surrounded by an inner pseudoring, which exhibit rectangular features, the spiral structure is not regular, possibly due to interaction with NGC 1242. The best-fitting model (see Fig. 4), setting , reproduces well the rectangular structure of the inner pseudoring and also part of the spiral structure.
NGC 1302: the only distinct feature in this SB0/a () galaxy is the very tightly wound spiral structure. The best-fitting model (see Fig. 4), setting , is chosen by the extent of the gas spiral.
NGC 1832: this SBbc () galaxy has an inner ring whose major axis seems to be larger than the bar. The spiral structure asymmetric. The ring and one spiral arm are reproduced by the best-fitting model (see Fig. 4), setting .
NGC 3275: this is a SBab () galaxy with an inner ring and asymmetric spiral structure. The ring and part of the spiral structure is reproduced with (see Fig. 4). The Fourier phase angle method clearly overestimates the bar radius: it is outside the lopsided inner ring.
NGC 3504: this is a SBab () galaxy with an outer ring. The ring and the extent of the bar is best reproduced with a simulation of stellar test particles giving (see Fig. 4). In the gas component the same pattern speed is favored, but the fit is worse because the outer ring does not form. The outer pseudoring in this galaxy causes the Fourier phase angle criterion to work incorrectly, giving too high value for bar length.
NGC 3507: this SBb () galaxy has really long spiral arms that can be followed about 360∘. The best-fitting model, setting , reproduces the spiral structure in its full extent. Overall, this is one of the best models (see Fig. 4).
NGC 3583: this SBb ()galaxy has an inner pseudoring with rectangular features and two-armed spiral. The best-fitting model, with , reproduces the shape of the pseudoring and also the spiral structure is well fitted (see Fig. 4).
NGC 3726: this SBc () galaxy has a weak and small bar. The inner part of the spiral structure is somewhat polygonal. The best-fitting model reproduces this appearance and gives (see Fig. 4).
NGC 4303: this SBbc () galaxy has a small bar inside far extending spiral structure whose inner part shows straight arm segments, sometimes called “Vorontsov-Velyaminov rows” (Chernin et al., 2000). This structure is reproduced with a narrow pattern speed range (see Fig. 3) by a model giving .
NGC 4548: this SBb () galaxy has spiral arms that seem to start offset to the bar in the leading side – at least the part connecting spiral to the ends of the bar is very weak. The best-fitting model gives (see Fig. 4). One arm of this galaxy shows straight segments, unlike the case of NGC 4303, these are not reproduced by the model.
NGC 5701: the outer pseudoring of this SB0/a () galaxy is almost detached from the bar. It is reproduced with a model giving (see Fig. 4).
NGC 5850: the inner ring of this SBb () galaxy is reproduced with a model giving or (see Fig. 4). The outer structure of this galaxy is not regular, possibly due to interaction with NGC 5846 (Higdon et al., 1998). A hydrodynamical model for this galaxy has been published by Aguerri et al. (2001), giving . We found that an alternative model, giving or is also possible when matching the size of the inner ring, but then the shape is not correct.
NGC 6384: this SBbc () galaxy has a small bar and long extending spiral structure that winds about 360∘. The best-fitting model, giving reproduces the spiral in its full length (see Fig. 4).
NGC 6782: the inner ring and the large part of the spiral of this SBa () galaxy are reproduced by a model giving (see Fig. 4). The main difference between the observed and modeled morphology is that the real galaxy has an outer pseudoring whereas the spiral in the model does not form the pseudoring. The Fourier phase method clearly overestimates the bar radius by setting it well outside the inner ring. This is possibly caused by the outer pseudoring that affects the phase angle of the Fourier decomposition.
NGC 7723: the inner pseudoring and multiple-armed spiral of this SBb () galaxy are best reproduced by a model giving . There is an alternative model, with , which gives about as good fit with the spiral structure. For comparison see Fig. 8.
4 Results and discussion
The results – the bar radii and the fitted corotation resonance distances are listed in Table 1, along with error estimates for both parameters. The differences to preliminary values for that were given in RSL2005 are minor, within the error estimates. With some galaxies the values of has changed considerably due to different way to determine the bar radius. However, in the sample level this does not introduce any significant changes in the observed dependency e.g. on the morphological type.
In addition to vs. Hubble stage comparison that was already done for the preliminary values in RSL2005, here we search possible correlations between the determined pattern speed and the size and the strength of the bar. We also study if the fitted depends on the bulge contribution, galaxy luminosity or colour.
| Galaxy | |||||||
|---|---|---|---|---|---|---|---|
| (arcsec) | (arcsec) | (arcsec) | (arcsec) | ||||
| NGC 0289 | 23.8 | 2.2 | 61.0 | 9.5 | 2.56 | 0.58 | 3.8 |
| NGC 0578 | 23.0 | 2.5 | 78.9 | 15.8 | 3.43 | 0.95 | 5.1 |
| NGC 0613 | 78.6 | 3.2 | 126.2 | 14.6 | 1.61 | 0.24 | 4.2 |
| NGC 1073 | 51.0 | 10.5 | 48.7 | 4.4 | 0.95 | 0.24 | 5.4 |
| NGC 1187 | 37.9 | 4.7 | 74.1 | 16.1 | 1.96 | 0.59 | 5.1 |
| NGC 1241 | 30.8 | 5.2 | 41.5 | 4.0 | 1.35 | 0.31 | 3.1 |
| NGC 1302 | 30.7 | 4.0 | 50.4 | 4.6 | 1.64 | 0.32 | 0.0 |
| NGC 1317 | 61.1 | 7.8 | 54.5 | 10.4 | 0.89 | 0.25 | 0.7 |
| NGC 1832 | 18.9 | 3.3 | 32.8 | 3.1 | 1.74 | 0.40 | 4.1 |
| NGC 3261 | 28.3 | 3.9 | 44.1 | 4.4 | 1.56 | 0.32 | 3.3 |
| NGC 3275 | 28.9 | 4.4 | 44.2 | 4.6 | 1.53 | 0.34 | 1.8 |
| NGC 3504 | 37.4 | 5.0 | 44.5 | 5.6 | 1.19 | 0.27 | 2.1 |
| NGC 3507 | 28.1 | 4.0 | 34.2 | 2.6 | 1.21 | 0.23 | 3.0 |
| NGC 3513 | 29.0 | 2.3 | 43.5 | 5.4 | 1.50 | 0.29 | 5.1 |
| NGC 3583 | 25.9 | 4.0 | 32.1 | 1.8 | 1.24 | 0.23 | 3.2 |
| NGC 3686 | 23.2 | 3.3 | 35.6 | 5.1 | 1.53 | 0.38 | 4.1 |
| NGC 3726 | 42.8 | 6.8 | 83.5 | 13.9 | 1.95 | 0.55 | 5.2 |
| NGC 4051 | 54.1 | 7.3 | 98.0 | 14.0 | 1.81 | 0.44 | 4.2 |
| NGC 4123 | 59.2 | 8.2 | 69.1 | 9.4 | 1.17 | 0.28 | 4.8 |
| NGC 4303 | 52.5 | 12.0 | 89.1 | 8.5 | 1.70 | 0.45 | 4.1 |
| NGC 4314 | 82.9 | 7.1 | 81.7 | 10.2 | 0.99 | 0.19 | 1.1 |
| NGC 4394 | 45.0 | 4.5 | 76.7 | 10.0 | 1.71 | 0.36 | 2.7 |
| NGC 4450 | 49.7 | 6.8 | 52.3 | 4.4 | 1.05 | 0.20 | 2.0 |
| NGC 4457 | 40.7 | 8.4 | 39.9 | 2.8 | 0.98 | 0.23 | 0.3 |
| NGC 4548 | 75.8 | 6.8 | 95.2 | 11.9 | 1.26 | 0.25 | 3.0 |
| NGC 4579 | 48.8 | 5.2 | 71.1 | 8.4 | 1.46 | 0.30 | 2.8 |
| NGC 4643 | 66.4 | 9.3 | 69.1 | 4.6 | 1.04 | 0.19 | -0.1 |
| NGC 4665 | 62.5 | 10.7 | 55.2 | 11.8 | 0.88 | 0.29 | -0.1 |
| NGC 4902 | 26.1 | 3.9 | 44.3 | 4.4 | 1.70 | 0.37 | 2.9 |
| NGC 4930 | 47.2 | 6.1 | 46.6 | 3.9 | 0.99 | 0.19 | 3.2 |
| NGC 4995 | 30.8 | 3.8 | 64.2 | 5.5 | 2.09 | 0.39 | 3.1 |
| NGC 5701 | 45.6 | 3.6 | 64.6 | 10.8 | 1.42 | 0.32 | -0.1 |
| NGC 5850 | 75.8 | 9.8 | 105.1 | 11.7 | 1.39 | 0.29 | 3.0 |
| NGC 5921 | 57.0 | 6.0 | 71.4 | 7.1 | 1.25 | 0.23 | 3.9 |
| NGC 6384 | 31.8 | 7.5 | 72.5 | 8.1 | 2.28 | 0.64 | 3.8 |
| NGC 6782 | 29.6 | 4.1 | 37.1 | 2.6 | 1.25 | 0.23 | 0.7 |
| NGC 7552 | 65.7 | 12.4 | 65.0 | 5.9 | 0.99 | 0.23 | 2.2 |
| NGC 7723 | 25.5 | 3.0 | 33.5 | 4.2 | 1.31 | 0.29 | 3.1 |
4.1 Comparison with previous pattern speed estimates
Before going to analysing the results of the sample we first compare our pattern speed determinations with previous estimates for these galaxies. From literature we found published pattern speed estimates for eight galaxies in our sample. Unfortunately, none of these was based on direct TW-method, instead either morphological arguments or simulation modelling was used to determine (for NGC 1073 and NGC 4123 we found both morphological and model based estimates of pattern speed).
In three cases, NGC 1073, NGC 4123, and NGC 5921, was estimated by the method of Puerari & Dottori (1997) (Aguerri et al., 1998): the - and -band phase angle crossing was taken to be signature of CR, giving 1.17, 1.41 and 1.28, respectively. These compare quite well with our estimates ( and ).
For NGC 613 (Elmegreen et al., 1992) and NGC 3504 (Kenney et al., 1993) the morphological signatures of the outer Lindblad resonance (extent of spiral structure, outer ring) and rotation curves were used to determine (in both cases corresponding to ). For NGC 7723 Aguerri et al. (2000) determined by assuming that the corotation region lack recent star formation. Of these, the cases of NGC 3504 and NGC 7723 are in good agreement with our value (, ), but for NGC 613 the difference is large (our value ). However, our model of NGC 613 was not particularly good: the fit is based just on the inner pseudoring and the innermost part of the spiral arms. Perhaps the complicated spiral structure in beyond our simple model.
Three galaxies of the sample have been previously modelled. For NGC 1073 England et al. (1990) found (our value ), for NGC 4123 Weiner et al. (2001) found (our value ) and for NGC 5850 Aguerri et al. (2001) found (our value ). In addition to these, the pattern speed of NGC 4314 was determined by matching the shapes of particle orbits with the observed outer ring (Quillen et al., 1994) giving (our value ).
Altogether, in half of the eight cases a smaller value of was found than in our study, and in another half a larger one was reported in the literature. For only one galaxy the difference was clearly larger than our error estimate for . If we take into account differences in adopted bar lengths and orientation parameters, our models can be considered to be consistent with previous pattern speed estimates for these galaxies.
4.2 Dependence on Hubble type

Fig. 9 shows the determined values of as a function of Hubble stage , taken from HyperLeda (Paturel et al., 2003). There seems to be a trend between the pattern speed and the Hubble stage : the average value of and its standard deviation are for SB0/a to SBab (), for SBb () and for SBbc to SBc (). Thus, early type (SBab or earlier) galaxies are typically fast rotators (in three cases the nomimal value , but the fast bar is within the error estimates), whereas later type galaxies include both fast (10 cases) and slow rotators (16 cases). Especially, with five galaxies the fast rotating bar is ruled out based on the adopted error estimates for the corotation resonance radius and bar size.
Our results can be compared with other pattern speed estimates also in the sample level – did we find a similar trend as the other researchers. For this purpose we have composed a comparison sample of pattern speed determinations from literature by the following criteria: 1) using the TW-method, 2) using simulation modelling, 3) using the Puerari–Dottori -method, and 4) galaxies whose pattern speed estimate is based on morphological arguments. Each galaxy enters the sample only once: if its pattern speed is estimated by TW-method, then its pattern speed estimates by other methods are omitted and so on. If essentially the same method is used several times for a galaxy, then the newest measurement is selected. The comparison sample is listed in Table 2 and the comparison with our modelling is illustrated in Fig. 10.
| Galaxy | T | Reference | Comments | |
| TW-measurements | ||||
| E 139-09 | -2.0 | 0.80 | Aguerri et al. (2003) | |
| E 281-31 | -0.1 | 1.8 | Gerssen et al. (2003) | |
| IC 874 | -1.9 | 1.40 | Aguerri et al. (2003) | |
| NGC 271 | 2.4 | 1.5 | Gerssen et al. (2003) | |
| NGC 936 | -1.1 | 1.38 | Merrifield & Kuijken (1995) | see also Kent & Glaudell (1989) |
| NGC 1023 | -2.7 | 0.91 | Debattista et al. (2002) | higher of two solutions |
| NGC 1308 | 0.0 | 0.80 | Aguerri et al. (2003) | |
| NGC 1358 | 0.2 | 1.2 | Gerssen et al. (2003) | |
| NGC 1440 | -2.0 | 1.60 | Aguerri et al. (2003) | |
| NGC 2523 | 4.0 | 1.4 | Treuthardt et al. (2007) | |
| NGC 2950 | -2.0 | 1.0 | Corsini et al. (2003) | |
| NGC 3412 | -2.0 | 1.50 | Aguerri et al. (2003) | |
| NGC 3992 | 4.0 | 0.80 | Gerssen et al. (2003) | |
| NGC 4245 | 0.1 | 1.1 | Treuthardt et al. (2007) | |
| NGC 4431 | -1.9 | 0.6 | Corsini et al. (2007) | |
| NGC 4596 | -0.9 | 1.15 | Gerssen et al. (1999) | |
| NGC 7079 | -1.8 | 1.2 | Debattista & Williams (2004) | |
| Modelling | ||||
| ESO 566-24 | 3.6 | 1.60 | Rautiainen et al. (2004) | |
| IC 4214 | 1.8 | 1.4 | Salo et al. (1999) | |
| NGC 157 | 4.0 | 1.43 | Sempere & Rozas (1997) | |
| NGC 1073 | 5.3 | 1.10 | England et al. (1990) | |
| NGC 1300 | 4.0 | 1.30 | Lindblad & Kristen (1996) | alternate fit gives |
| NGC 1365 | 3.1 | 1.31 | Lindblad et al. (1996) | |
| NGC 1433 | 1.5 | 1.60 | Treuthardt et al. (2008) | |
| NGC 2336 | 4.0 | 1.10 | Wilke et al. (1999) | |
| NGC 3783 | 1.3 | 1.3 | García-Barreto et al. (1999) | |
| NGC 4123 | 5.0 | 1.35 | Weiner et al. (2001) | |
| NGC 4314 | 1.0 | 1.17 | Quillen et al. (1994) | orbits in determined potential |
| NGC 4321 | 4.0 | 1.80 | Garcia-Burillo et al. (1998) | |
| NGC 5850 | 3.1 | 1.35 | Aguerri et al. (2001) | |
| NGC 7479 | 4.4 | 1.1 | Wilke et al. (2000) | |
| Puerari&Dottori method | ||||
| NGC 1530 | 3.1 | 1.22 | Aguerri et al. (1998) | |
| NGC 2273 | 1.0 | 1.27 | Aguerri et al. (1998) | |
| NGC 3516 | -2.0 | 0.71 | Aguerri et al. (1998) | |
| NGC 3359 | 5.2 | 1.33 | Aguerri et al. (1998) | |
| NGC 5921 | 4.0 | 1.28 | Aguerri et al. (1998) | |
| NGC 6951 | 3.9 | 1.62 | Aguerri et al. (1998) | |
| NGC 7743 | -0.7 | 1.0 | Aguerri et al. (1998) | |
| Morphological or | ||||
| kinematical arguments | ||||
| ESO 509-98 | 0.9 | 1.30 | Buta et al. (1998) | |
| IC 4290 | 3.3 | 1.70 | Buta et al. (1998) | |
| NGC 0613 | 4.0 | 1.00 | Elmegreen et al. (1992) | |
| NGC 0925 | 7.0 | 3.14 | Elmegreen et al. (1998) | kinematical identification or CR |
| NGC 1326 | -0.8 | 1.40 | Buta et al. (1998) | |
| NGC 3081 | 0.0 | 2.20 | Buta & Purcell (1998) | |
| NGC 3351 | 3.0 | 1.20 | Devereux et al. (1992) | |
| NGC 3504 | 2.1 | 1.00 | Kenney et al. (1993) | |
| NGC 3627 | 3.0 | 1.43 | Chemin et al. (2003) | |
| NGC 4151 | 2.1 | 1.1 | Mundell et al. (1999) | |
| NGC 5236 | 5.0 | 1.40 | Kenney & Lord (1991) | |
| NGC 6221 | 4.9 | 1.05 | Vega Beltran et al. (1998) | |
| NGC 7723 | 3.1 | 1.06 | Aguerri et al. (2000) |

Strictly speaking, our results are in agreement with those obtained with TW-method. Most of the measurements with TW-method have been limited to early type galaxies, which indeed have fast bars. This has been taken to indicate that the dark halo contribution in these galaxies is so low that it cannot decelerate the bar rotation (Debattista & Sellwood, 2000; Aguerri et al., 2003). If so, then the slow bars in our sample could be systems where angular momentum transfer between the bar and the dark halo with a substantial central density has slowed down bar rotation. Alternatively, the difference in pattern speeds can be primordial: the early type galaxies, which have massive bulges, may favor the formation of fast bars (Combes & Elmegreen, 1993).
In future it would be important to increase the overlap of pattern speed estimates based on different methods both by extending the current modelling to earlier type galaxies (e.g. by using the data of the ongoing survey of S0-galaxies, Laurikainen et al., 2005; Buta et al., 2006) and by extending the direct measurements to later types. This would give a better understanding of accuracy and possible bias of pattern speed determinations done with different methods.
The slow bars in our sample cannot be refuted by the ambiguity in the determination of bar length: our values tend to be slightly larger than previous bar length estimates for the same galaxies, thus favoring a faster bar. Furthermore, the comparison with other estimates of corotation radius for the sample galaxies does not show any systematic difference. If our error estimates for and (as listed in Table 1) hold, then of 19 galaxies with nominal value , we can coin five (six if we adopt the alternative pattern speed solution for NGC 7723) as “definitely slow rotating”, i.e. (see Fig. 9), and several others for which a fast bar solution in unlikely. Of these, NGC 289 and NGC 578 both have a very small bar when compared to the extent of the spiral structure. The innermost structure of these galaxies would allow also higher pattern speed than the best fitting model, but even then would be much larger than 1.4. In NGC 1832 the best-fitting model, which gives a slow bar, reproduces the inner ring. The ring disappears when the pattern speed is increased to fast bar domain. The bar does not fill the inner ring, thus also the morphology supports slow bar solution. The innermost structure of NGC 3726 allows also a faster bar pattern speed, but even the inner ring morphology is better reproduced with the value listed in Table 1, which gives a good overall fit. The straight arm segments of the inner spiral structure in NGC 4303 are well reproduced with the listed value of , but disappear when reaching the fast bar domain. However, the bar of this galaxy has leading offset dust lanes, which are usually taken as a signature of fast-rotating bar. Our gas dynamical model is not well-suited for modelling the dust lanes, but indeed we got a better fit for these features with fast-rotating bar. However, the spiral response with such pattern speed choice is quite bad. In the case of NGC 4995 the fit is not very good and a value giving a fast rotating bar cannot be excluded. NGC 6384 has very long spiral arms, which are completely reproduced with the listed value of . Only the innermost part can be reproduced with a fast rotating bar.
An alternative explanation to slow bars, that the spiral structure in late type galaxies typically rotates with a lower pattern speed than the bar, and that our method gives too much emphasis to the spiral, is certainly possible for some galaxies of the sample (NGC 3726, NGC 4303, NGC 4995, NGC 6384). However, there are several galaxies (NGC 289, NGC 578, NGC 1832), where also the fit to the innermost features favours low pattern speed. If the bar in these galaxies is fast rotating, then even the innermost part of the spiral rotates with a lower pattern speed, and the bar may be relatively insignificant in their dynamics.
4.3 Size and strength of the bar
The comparison of the determined corotation radius to the galaxy size, the latter estimated to be proportional to isophotal radius , does not show any clear trend with galaxy morphology. Regardless of the Hubble type, can be anything between 0.3 and 1.0 times . The situation is different if we compare the dimensionless pattern speed to relative bar size, measured by the estimated semi major axes , and scaled to the isophotal radius (Fig. 11, top. Now there is a clear correlation: the slow bars tend to be also the smallest ones: with one exception, the galaxies with have . When all the galaxies are plotted in vs. one can see for the smallest bars (), the corotation resonance is close to 0.4 . This corresponds to typical values for the radii, where Elmegreen & Elmegreen (1995) found the end of the symmetric two-armed spiral to be in non-barred galaxies and galaxies with small bars. For the larger bars, the bar size essentially correlates with the corotation radius (Fig. 11, bottom), but the scatter is large.

In some studies (Patsis et al., 1991; Kranz et al., 2003) it has been suggested that in non-barred galaxies the end of the spiral or at least the end of its symmetric part lies near corotation or inner 4/1-resonance. The possible independence of corotation resonance radius from the bar size in the galaxies with smallest bars could suggest that the spiral in these galaxies indeed has a different pattern speed, whose corotation radius is regulated by the galaxy size.
In Fig. 12 we compare to parameters and from Buta et al. (2005), which characterize the strengths of bar and spiral components (maximum tangential force divided by the azimuthally averaged radial force in each radius). With one exception, galaxies with slow bars () have . However, there are several galaxies with similar bar strength but fast bar. The combined results with bar size and strength are in accordance with Elmegreen & Elmegreen (1995) who found by morphological arguments that the flat (and typically long) bars tend to be faster rotators than the exponential (and typically short) bars. There is no clear correlation between pattern speed and spiral strength.

4.4 Bulge-to-total flux ratio, galaxy luminosity and color
The top frame of Fig. 13 shows as a function of bulge-to-total flux fraction (-ratio) in -band (see also Salo et al., 2007). The apparent bulge contribution is one of the criteria in Hubble classification, so it is not surprising that we get almost a mirror image of Fig. 9.
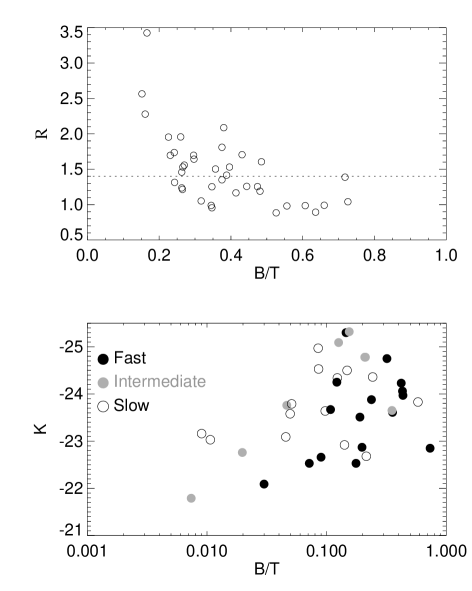
We studied the dependency between and absolute -luminosity (calculated from the -magnitudes in RC3) and distances by Tully (1988), but found no clear correlation. The same was the situation with absolute -magnitudes based on 2MASS data (Jarrett et al., 2003) and neither there was correlation with colour. However, if we plot the galaxies in -plane (Fig. 13, bottom), then the fast and slow galaxies roughly occupy different areas: slower bar favouring lower bulge fraction and/or higher galaxy luminosity.
4.5 Pattern speed vs. dust lane morphology
According to gas dynamical simulations by Athanassoula (1992), the existence of leading offset dust lanes in the bars tells us two things: that there is an ILR and that . The first condition comes from the existence of so-called -orbits, which require the presence of an ILR: the dust lanes form as the orientation of the orbits of gas clouds change from parallel orientation of -orbits (with respect to the bar) in the outer parts of the bar to the perpendicular orientation of -orbits in the inner parts. The second condition comes from the gas dynamical simulation, only in this parameter region the shape of the shock corresponds to the observed dust morphology.
We have checked the dust lane morphology of the sample galaxies from OSUBSGS images and images from various other sources, e.g. NED and the web page of de Vaucouleurs Atlas of Galaxies (Buta et al., 2007). Omitting cases where the inclination makes recognition and classification of dust lanes ambiguous, we found that more than third of the galaxies in the sample does not show classic dust lane morphology. In some of the cases the dust lanes are missing altogether, perhaps due to lack of interstellar matter in the bar region, in others the morphology is more complicated or even chaotic. Of the seven galaxies with , the dust lane morphology is uncertain due to inclination for NGC 3726 and NGC 4995. In NGC 289 the dust lane morphology is not of the “classic” type, in NGC 578 it is more or less chaotic. NGC 1832 and NGC 6384 do not show dust lanes in the bar region. In NGC 4303 the dust lane morphology is of classic type suggesting that the bar in this galaxies may be fast rotating. Indeed, if we compare a model for NGC 4303 with (Fig. 3), then the gas morphology in the bar region shows features that look a bit like the observed dust lanes, but the spiral structure is not well reproduced.
5 Conclusions
We have modelled 38 barred galaxies with simulations using collisionless test particles and inelastatically colliding test particles. The gravitational potentials used were derived from -band images from Ohio State University Bright Spiral Galaxy Survey.
Our findings are as follows:
1) the average value of the dimensionless pattern speed, depends on the morphological type, being about 1.2 for the early type barred galaxies (SB0/a–SBab), 1.4 to intermediate type (SBb) and 1.8 to late type (SBbc–SBc).
2) When error estimates are considered, all early type spiral galaxies in the sample () are in accordance with having fast bars ().
3) If the derived pattern speed corresponds to that of the bar, then intermediate and late type galaxies include both fast and slow bars. In five cases the bar remains in slow bar domain even if a “worst case scenario” allowed by the error estimates in pattern speed and bar size determinations is considered. However, the existence of multiple pattern speeds, i.e. spiral rotating more slowly than the bar, is a viable alternative in some cases, especially for NGC 4303.
4) Slow bars are short when compared to isophotal radius . Especially, with only one exception, galaxies with have a slow bar.
5) With one exception, the slow bars have bar strength , although several bars with similar strength are also found to be fast.
6) There is no clear correlation with the absolute - or -magnitudes of the galaxies or the color index.
7) Galaxies with fast and slow bars seem to occupy different regions when plotted in a two-dimensional coordinate system defined by bulge-to-total flux ratio and absolute -magnitude.
8) Omitting possible systematic errors, the error estimates of the model-based pattern speeds are typically smaller than with Tremaine-Weinberg method. If the results by these two methods are found to be consistent, then modelling would enable pattern speed estimation for large galaxy samples.
Acknowledgments
We thank the referee, whose suggestions helped us to improve the manuscript.
The financial support from the Magnus Ehrnrooth foundation and the Academy of Finland is acknowledged.
This work made use of data from the Ohio State University Bright Spiral Galaxy Survey, which was funded by grants AST-9217716 and AST-9617006 from the United States National Science Foundation, with additional support from the Ohio State University.
We acknowledge the usage of the HyperLeda database (http://leda.univ-lyon1.fr).
We have also used the NASA/IPAC Extragalactic Database (NED) which is operated by the Jet Propulsion Laboratory, California Institute of Technology, under contract with the National Aeronautics and Space Administration.
References
- Abraham et al. (1999) Abraham R. G., Merrifield M. R., Ellis R. S., Tanvir N. R., Brinchmann J., 1999, MNRAS, 308, 569
- Aguerri et al. (1998) Aguerri J. A. L., Beckman J. E., Prieto M., 1998, AJ, 116, 2136
- Aguerri et al. (2003) Aguerri J. A. L., Debattista V. P., Corsini E. M., 2003, MNRAS, 338, 465
- Aguerri et al. (2001) Aguerri J. A. L., Hunter J. H., Prieto M., Varela A. M., Gottesman S. T., Muñoz-Tuñón C., 2001, A&A, 373, 786
- Aguerri et al. (2000) Aguerri J. A. L., Muñoz-Tuñón C., Varela A. M., Prieto M., 2000, A&A, 361, 841
- Athanassoula (1992) Athanassoula E., 1992, MNRAS, 259, 345
- Athanassoula (2003) Athanassoula E., 2003, MNRAS, 341, 1179
- Athanassoula & Misiriotis (2002) Athanassoula E., Misiriotis A., 2002, MNRAS, 330, 35
- Bournaud et al. (2005) Bournaud F., Combes F., Semelin B., 2005, MNRAS, 364, L18
- Buta et al. (1998) Buta R., Alpert A. J., Cobb M. L., Crocker D. A., Purcell G. B., 1998, AJ, 116, 1142
- Buta & Block (2001) Buta R., Block D. L., 2001, ApJ, 550, 243
- Buta & Combes (1996) Buta R., Combes F., 1996, Fundamentals of Cosmic Physics, 17, 95
- Buta et al. (2007) Buta R., Corwin J., Odewahn S., 2007, The de Vaucouleurs Atlas of Galaxies. New York: Cambridge University Press
- Buta et al. (2004) Buta R., Laurikainen E., Salo H., 2004, AJ, 127, 279
- Buta et al. (2006) Buta R., Laurikainen E., Salo H., Block D. L., Knapen J. H., 2006, AJ, 132, 1859
- Buta & Purcell (1998) Buta R., Purcell G. B., 1998, AJ, 115, 484
- Buta et al. (2005) Buta R., Vasylyev S., Salo H., Laurikainen E., 2005, AJ, 130, 506
- Byrd et al. (1994) Byrd G., Rautiainen P., Salo H., Buta R., Crocher D. A., 1994, AJ, 108, 476
- Canzian (1993) Canzian B., 1993, ApJ, 414, 487
- Chemin et al. (2003) Chemin L., Cayatte V., Balkowski C., Marcelin M., Amram P., van Driel W., Flores H., 2003, A&A, 405, 89
- Chernin et al. (2000) Chernin A. D., Zasov A. V., Arkhipova V. P., Kravtsova A. S., 2000, Astronomy Letters, 26, 285
- Combes & Elmegreen (1993) Combes F., Elmegreen B. G., 1993, A&A, 271, 391
- Contopoulos (1980) Contopoulos G., 1980, A&A, 81, 198
- Corsini et al. (2007) Corsini E. M., Aguerri J. A. L., Debattista V. P., Pizzella A., Barazza F. D., Jerjen H., 2007, ApJ, 659, L121
- Corsini et al. (2003) Corsini E. M., Debattista V. P., Aguerri J. A. L., 2003, ApJ, 599, L29
- de Grijs (1998) de Grijs R., 1998, MNRAS, 299, 595
- de Vaucouleurs et al. (1991) de Vaucouleurs G., de Vaucouleurs A., Corwin H. G., Buta R. J., Paturel G., Fouque P., 1991, Third Reference Catalogue of Bright Galaxies. Springer-Verlag Berlin Heidelberg New York
- Debattista (2003) Debattista V. P., 2003, MNRAS, 342, 1194
- Debattista et al. (2002) Debattista V. P., Corsini E. M., Aguerri J. A. L., 2002, MNRAS, 332, 65
- Debattista & Sellwood (1998) Debattista V. P., Sellwood J. A., 1998, ApJ, 493, L5
- Debattista & Sellwood (2000) Debattista V. P., Sellwood J. A., 2000, ApJ, 543, 704
- Debattista & Williams (2004) Debattista V. P., Williams T. B., 2004, ApJ, 605, 714
- Devereux et al. (1992) Devereux N. A., Kenney J. D., Young J. S., 1992, AJ, 103, 784
- Elmegreen & Elmegreen (1985) Elmegreen B. G., Elmegreen D. M., 1985, ApJ, 288, 438
- Elmegreen et al. (1996a) Elmegreen B. G., Elmegreen D. M., Chromey F. R., Hasselbacher D. A., Bissell B. A., 1996a, AJ, 111, 2233
- Elmegreen et al. (2004) Elmegreen B. G., Elmegreen D. M., Hirst A. C., 2004, ApJ, 612, 191
- Elmegreen et al. (1992) Elmegreen B. G., Elmegreen D. M., Montenegro L., 1992, ApJS, 79, 37
- Elmegreen et al. (1998) Elmegreen B. G., Wilcots E., Pisano D. J., 1998, ApJ, 494, L37
- Elmegreen et al. (1990) Elmegreen D. M., Bellin A. D., Elmegreen B. G., 1990, ApJ, 364, 415
- Elmegreen & Elmegreen (1995) Elmegreen D. M., Elmegreen B. G., 1995, ApJ, 445, 591
- Elmegreen et al. (1996b) Elmegreen D. M., Elmegreen B. G., Chromey F. R., Hasselbacher D. A., Bissell B. A., 1996b, AJ, 111, 1880
- England et al. (1990) England M. N., Gottesman S. T., Hunter J. H., 1990, ApJ, 348, 456
- Erwin (2004) Erwin P., 2004, A&A, 415, 941
- Erwin (2005) Erwin P., 2005, MNRAS, 364, 283
- Eskridge et al. (2002) Eskridge P. B., Frogel J. A., Pogge R. W., Quillen A. C., Berlind A. A., Davies R. L., DePoy D. L., Gilbert K. M., Houdashelt M. L., Kuchinski L. E., Ramírez S. V., Sellgren K., Stutz A., Terndrup D. M., Tiede G. P., 2002, ApJS, 143, 73
- Eskridge et al. (2000) Eskridge P. B., Frogel J. A., Pogge R. W., Quillen A. C., Davies R. L., DePoy D. L., Houdashelt M. L., Kuchinski L. E., Ramírez S. V., Sellgren K., Terndrup D. M., Tiede G. P., 2000, AJ, 119, 536
- Friedli & Martinet (1993) Friedli D., Martinet L., 1993, A&A, 277, 27
- García-Barreto et al. (1999) García-Barreto J. A., Combes F., Koribalski B., Franco J., 1999, A&A, 348, 685
- Garcia-Burillo et al. (1998) Garcia-Burillo S., Sempere M. J., Combes F., Neri R., 1998, A&A, 333, 864
- Gerssen et al. (1999) Gerssen J., Kuijken K., Merrifield M. R., 1999, MNRAS, 306, 926
- Gerssen et al. (2003) Gerssen J., Kuijken K., Merrifield M. R., 2003, MNRAS, 345, 261
- Heller et al. (2001) Heller C. H., Shlosman I., Englmaier P., 2001, ApJ, 553, 661
- Hernández-Toledo et al. (2007) Hernández-Toledo H. M., Zendejas-Domínguez J., Avila-Reese V., 2007, AJ, 134, 2286
- Higdon et al. (1998) Higdon J. L., Buta R. J., Purcell G. B., 1998, AJ, 115, 80
- Hunter et al. (1988) Hunter J. H., England M. N., Gottesman S. T., Ball R., Huntley J. M., 1988, ApJ, 324, 721
- Jarrett et al. (2003) Jarrett T. H., Chester T., Cutri R., Schneider S. E., Huchra J. P., 2003, AJ, 125, 525
- Jogee et al. (2004) Jogee S., Barazza F. D., Rix H.-W., Shlosman I., Barden M., Wolf C., Davies J., Heyer I., Beckwith S. V. W., Bell E. F., Borch A., Caldwell J. A. R., Conselice C. J., Dahlen T., Häussler B., Heymans C., Jahnke K., Knapen J. H., Laine S., 2004, ApJ, 615, L105
- Kenney et al. (1993) Kenney J. D. P., Carlstrom J. E., Young J. S., 1993, ApJ, 418, 687
- Kenney & Lord (1991) Kenney J. D. P., Lord S. D., 1991, ApJ, 381, 118
- Kent (1987) Kent S. M., 1987, AJ, 93, 1062
- Kent & Glaudell (1989) Kent S. M., Glaudell G., 1989, AJ, 98, 1588
- Kranz et al. (2003) Kranz T., Slyz A., Rix H., 2003, ApJ, 586, 143
- Laine et al. (2002) Laine S., Shlosman I., Knapen J. H., Peletier R. F., 2002, ApJ, 567, 97
- Laurikainen & Salo (2002) Laurikainen E., Salo H., 2002, MNRAS, 337, 1118
- Laurikainen et al. (2005) Laurikainen E., Salo H., Buta R., 2005, MNRAS, 362, 1319
- Laurikainen et al. (2007) Laurikainen E., Salo H., Buta R., Knapen J. H., 2007, MNRAS, 381, 401
- Laurikainen et al. (2004) Laurikainen E., Salo H., Buta R., Vasylyev S., 2004, MNRAS, 355, 1251
- Lindblad & Kristen (1996) Lindblad P. A. B., Kristen H., 1996, A&A, 313, 733
- Lindblad et al. (1996) Lindblad P. A. B., Lindblad P. O., Athanassoula E., 1996, A&A, 313, 65
- Lynden-Bell (1979) Lynden-Bell D., 1979, MNRAS, 187, 101
- Maciejewski (2006) Maciejewski W., 2006, MNRAS, 371, 451
- Maciejewski & Sparke (2000) Maciejewski W., Sparke L. S., 2000, MNRAS, 313, 745
- Marinova & Jogee (2007) Marinova I., Jogee S., 2007, ApJ, 659, 1176
- Martin (1995) Martin P., 1995, AJ, 109, 2428
- Martinez-Valpuesta et al. (2007) Martinez-Valpuesta I., Knapen J. H., Buta R., 2007, AJ, 134, 1863
- Masset & Tagger (1997) Masset F., Tagger M., 1997, A&A, 322, 442
- Menéndez-Delmestre et al. (2007) Menéndez-Delmestre K., Sheth K., Schinnerer E., Jarrett T. H., Scoville N. Z., 2007, ApJ, 657, 790
- Merrifield & Kuijken (1995) Merrifield M. R., Kuijken K., 1995, MNRAS, 274, 933
- Michel-Dansac & Wozniak (2006) Michel-Dansac L., Wozniak H., 2006, A&A, 452, 97
- Miwa & Noguchi (1998) Miwa T., Noguchi M., 1998, ApJ, 499, 149
- Mundell et al. (1999) Mundell C. G., Pedlar A., Shone D. L., Robinson A., 1999, MNRAS, 304, 481
- Navarro et al. (1996) Navarro J. F., Frenk C. S., White S. D. M., 1996, ApJ, 462, 563
- Patsis (2005) Patsis P. A., 2005, MNRAS, 358, 305
- Patsis et al. (1991) Patsis P. A., Contopoulos G., Grosbøl P., 1991, A&A, 243, 373
- Patsis et al. (2003) Patsis P. A., Skokos C., Athanassoula E., 2003, MNRAS, 346, 1031
- Paturel et al. (2003) Paturel G., Petit C., Prugniel P., Theureau G., Rousseau J., Brouty M., Dubois P., Cambrésy L., 2003, A&A, 412, 45
- Persic et al. (1996) Persic M., Salucci P., Stel F., 1996, MNRAS, 281, 27
- Puerari & Dottori (1997) Puerari I., Dottori H., 1997, ApJL, 476, L73
- Quillen et al. (1994) Quillen A. C., Frogel J. A., Gonzalez R. A., 1994, ApJ, 437, 162
- Rand & Wallin (2004) Rand R. J., Wallin J. F., 2004, ApJ, 614, 142
- Rautiainen & Salo (1999) Rautiainen P., Salo H., 1999, A&A, 348, 737
- Rautiainen & Salo (2000) Rautiainen P., Salo H., 2000, A&A, 362, 465
- Rautiainen et al. (2004) Rautiainen P., Salo H., Buta R., 2004, MNRAS, 349, 933
- Rautiainen et al. (2002) Rautiainen P., Salo H., Laurikainen E., 2002, MNRAS, 337, 1233
- Rautiainen et al. (2005) Rautiainen P., Salo H., Laurikainen E., 2005, ApJ, 631, L129
- Reese et al. (2007) Reese A. S., Williams T. B., Sellwood J. A., Barnes E. I., Powell B. A., 2007, AJ, 133, 2846
- Regan & Teuben (2003) Regan M. W., Teuben P., 2003, ApJ, 582, 723
- Salo (1991) Salo H., 1991, A&A, 243, 118
- Salo et al. (2007) Salo H., Laurikainen E., Rautiainen P., Buta R., 2007, in Combes F., Palous J., eds, IAU Symposium Vol. 235 of IAU Symposium, Sticky-Particle Simulations of Barred Galaxies. pp 133–133
- Salo et al. (1999) Salo H., Rautiainen P., Buta R., Purcell G. B., Cobb M. L., Crocker D. A., Laurikainen E., 1999, AJ, 117, 792
- Schwarz (1981) Schwarz M. P., 1981, ApJ, 247, 77
- Schwarz (1984) Schwarz M. P., 1984, MNRAS, 209, 93
- Sellwood (1981) Sellwood J. A., 1981, A&A, 99, 362
- Sellwood & Sparke (1988) Sellwood J. A., Sparke L. S., 1988, MNRAS, 231, 25P
- Sempere et al. (1995) Sempere M. J., Garcia-Burillo S., Combes F., Knapen J. H., 1995, A&A, 296, 45
- Sempere & Rozas (1997) Sempere M. J., Rozas M., 1997, A&A, 317, 405
- Sheth et al. (2008) Sheth K., Elmegreen D. M., Elmegreen B. G., Capak P., Abraham R. G., Athanassoula E., Ellis R. S., Mobasher B., Salvato M., Schinnerer E., Scoville N. Z., Spalsbury L., Strubbe L., Carollo M., Rich M., West A. A., 2008, ApJ, 675, 1141
- Thompson (1981) Thompson L. A., 1981, ApJ, 244, L43
- Tremaine & Weinberg (1984) Tremaine S., Weinberg M. D., 1984, ApJ, 282, L5
- Treuthardt et al. (2007) Treuthardt P., Buta R., Salo H., Laurikainen E., 2007, AJ, 134, 1195
- Treuthardt et al. (2008) Treuthardt P., Salo H., Rautiainen P., Buta R., 2008, submitted to AJ
- Tully (1988) Tully R. B., 1988, Nearby galaxies catalog. Cambridge and New York, Cambridge University Press, 1988, 221 p.
- Vega Beltran et al. (1998) Vega Beltran J. C., Zeilinger W. W., Amico P., Schultheis M., Corsini E. M., Funes J. G., Beckman J., Bertola F., 1998, A&AS, 131, 105
- Weiner et al. (2001) Weiner B. J., Sellwood J. A., Williams T. B., 2001, ApJ, 546, 931
- Whyte et al. (2002) Whyte L. F., Abraham R. G., Merrifield M. R., Eskridge P. B., Frogel J. A., Pogge R. W., 2002, MNRAS, 336, 1281
- Wilke et al. (1999) Wilke K., Möllenhoff C., Matthias M., 1999, A&A, 344, 787
- Wilke et al. (2000) Wilke K., Möllenhoff C., Matthias M., 2000, A&A, 361, 507
- Zhang & Buta (2007) Zhang X., Buta R. J., 2007, AJ, 133, 2584
- Zimmer et al. (2004) Zimmer P., Rand R. J., McGraw J. T., 2004, ApJ, 607, 285