STAR measurement of system size and incident energy dependence of correlations at RHIC
Abstract
We present the results on measurement of event-by-event fluctuations and correlations for Cu+Cu collisions at = 62.4 and 200 GeV from STAR experiment at RHIC. These results are compared with those from Au+Au collisions at = 62.4 and 200 GeV to study the system size dependence. We find that the dynamical fluctuations are finite and decrease with increasing collision centrality. The correlations are studied as a function of collision centrality and are observed to decrease as we go from peripheral to central collisions. The square root of correlations scaled by mean are observed to be independent of beam energy as well as colliding ion size.
1 Introduction
The study of event-by-event fluctuations in various quantities like average transverse momentum, multiplicity, and conserved quantities such as net charge, may provide evidence for formation of the Quark Gluon Plasma (QGP) in relativistic heavy-ion collisions lok . The event-by-event transverse momentum fluctuations can be related to the temperature fluctuations which are related to specific heat of the system lok0 . The non-monotonic change of correlations as a function of centrality and/or as the incident energy can also be a possible signal of QGP lok . Several investigations have been carried out on the study of fluctuations and correlations in relativistic heavy ion collisions lok4 . Measurements performed by the STAR collaboration showed that transverse momentum fluctuations in Au+Au collisions at RHIC energies are finite but small relative to prediction invoking the formation of QGP lok3 . We present fluctuations and correlations in Cu+Cu collisions at 62.4 and 200 GeV and compare with those in Au+Au collisions at similar energies to investigate the system size dependence.
2 Data Analysis
Data for this analysis were obtained using the Solenoidal Tracker at RHIC(STAR) detector employing a 0.5 T uniform magnetic field parallel to the beam axis. We study Cu+Cu collisions at = 62.4 and 200 GeV. The detector used in this analysis is the Time Projection Chamber(TPC). The events are required to have a vertex within 25 cm along the beam pipe from the center of STAR. The charged particle tracks used were required to have at least 20 hits in the TPC and have originated within 1 cm of the measured event vertex. Events were accepted within 1 cm of the center of STAR in the plane perpendicular to the beam direction. Tracks from TPC with 0.15 GeV/c 2.0 GeV/c with 1.0 were used in this analysis. The collision centrality is determined by using uncorrected multiplicity of all charged particles measured in TPC within 0.5. Each centrality bin was represented by the number of participating nucleons, , using a Glauber Monte Carlo calculations lok5 . Data analysed are from minimum bias triggers.
The fluctuations are studied by comparing the mean and rms deviations of the event-by event mean ( ) distributions of data and mixed events. Mixed events were constructed by randomly selecting one track from an event chosen from the measured events in the same centrality keeping the same event multiplicity as in the data. We study the dynamical fluctuations defined as: = . Where is the rms value of the distribution of data and is the rms value of the distribution of mixed events.
The transverse momentum correlations are studied using the following equation lok3 :
| (1) |
where is the number of events in a particular centrality, is the transverse momentum of the track in each event, is the number of tracks in the event. The overall event average transverse momentum is given by , where is the average transverse momentum in the event.
3 Results and discussion
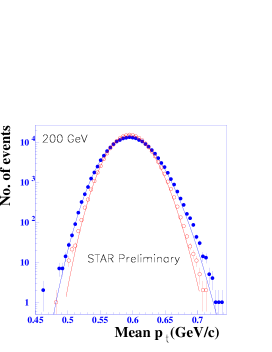
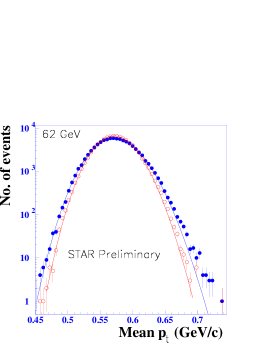
The Fig. 1 shows the event-by-event distributions for data (solid circles)and mixed events (open circles) for 0-10% Cu+Cu collisions at 200 GeV (left) and 62.4 GeV (right). The errors shown in the results are statistical only. Distributions for the data are wider than those of mixed events indicating the presence of non-statistical fluctuations at both incident energies. Similar results are obtained for other centralities. We find that the dynamical fluctuations varies from 4.1% to 2.3% as the collision centrality goes from 30-40 (peripheral) to 0-10 (most central) at both the energies. The lines in figures represent gamma distributions given as:
| (2) |
Where = / and = / in GeV/c. Here is the mean in GeV/c and is the standard deviation in GeV/c of the mean distribution. Tannenbaum lok2 showed that without cuts the /N should be 2 following the gamma distribution and N reflects the temperature of the distribution. Where N is the average charged particle multiplicity for a given centrality. /N varies from 2.21 to 2.13 at 200 GeV and from 2.37 to 2.27 at 62.4 GeV and N varies from 258 MeV/c to 279 MeV/c at 200 GeV and from 231 MeV/c to 252 MeV/c at 62.4 GeV as the collision centrality goes from 30-40 to 0-10.
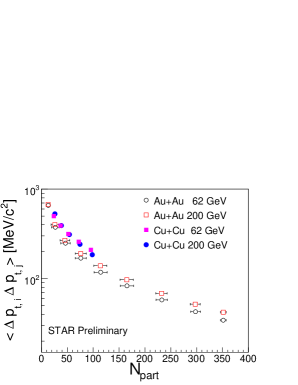
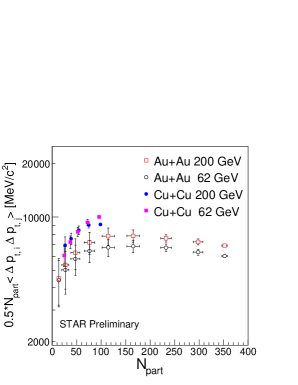
The Fig. 2 (left) shows the two particle transverse momentum correlations obtained using eqn.1 as a function of for Cu+Cu at 62.4 GeV, Cu+Cu at 200 GeV, Au+Au at 62.4 GeV and Au+Au at 200 GeV collisions lok3 . The correlations are finite and decrease with increase in number of participants for both Cu+Cu and Au+Au collisions. This decrease in correlations could be due to correlations being dominated from pair of particles coming from the same nucleon-nucleon collision which get diluted with increasing the number of participants. The correlation seems to grow with decreasing system size having similar number of participants. Fig. 2 (right) displays measured correlation scaled by the number of participating nucleons divided by 2 to account for the dependence of the correlation on the number of sources of particle emission. It is seen that the correlation increases with increasing collision centrality and then saturate in central Au+Au collisions indicating sign of thermalization lok1 whereas in Cu+Cu collisions correlation does not seems to saturate with increasing collision centrality as system size is much smaller as compared to Au+Au.
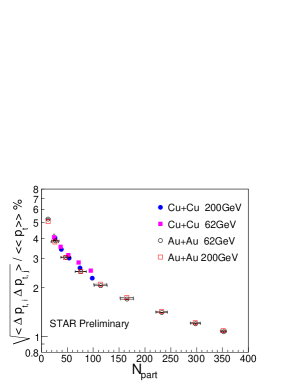
The observed dependence of correlation on energy, system size or centrality may be due to the changes in with beam energy,centrality and colliding ion species. Therefore, we study the square root of the correlation scaled by the as a function of number of participants (Fig. 3). It is seen that the quantity is independent of beam energy as well as system size but decreases with increasing .
4 Summary
We find non-statistical fluctuations in the mean at both the energies. The dynamical fluctuations decrease with increase in collision centrality. The mean distributions follow gamma distributions. The correlations are finite and decrease with increasing in the number of participants in Cu + Cu collisions at = 62.4 and 200 GeV as was observed in Au + Au collisions. The correlation scaled by the number of participating nucleons in Au+Au collisions saturates at higher collision centrality indicating the sign of thermalization lok1 whereas no such saturation is observed in case of Cu + Cu collisions. The quantity seems to be independent beam energy as well as system size.
References
- (1) H.Heiselberg, Phys. Rep. 351, 161 (2001).
- (2) L. Stodolsky, Phys. Rev. Lett. 75, 1044 (1995).
- (3) D. Adamova et al. [CERES Collaboration], Nucl. Phys. A727, 97 (2003); M.M. Aggarwal et al. [WA98 Collaboration], Phys. Rev. C 65, 054912 (2002); H. Appelshauser et al. [NA49 Collaboration], Phys. Lett. B459, 679 (1999); J. Adams et al. [STAR Collaboration], Phys. Rev. C71, 064906 (2005); J. Adams et al. [STAR Collaboration], Phys. Rev. C 68, 044905 (2003); J. Adams et al. [STAR Collaboration], Phys. Rev. Lett. 90, 172301 (2003); K. Adcox et al. [PHENIX Collaboration], Phys. Rev. Lett. 89, 212301 (2002); K. Adcox et al. [PHENIX Collaboration], Phys. Rev. C 66, 024901 (2002); S.S. Adler et al. [PHENIX Collaboration], Phys. Rev. Lett. 93, 092301 (2004).
- (4) J. Adams et al.,[STAR Collaboration], Phys. Rev. C72, 044902 (2005).
- (5) J. Adams et al. [STAR Collaboration], Phys. Rev. C70, 044901 (2004).
- (6) M. J. Tannenbaum, Phys. Lett. B498, 29 (2001).
- (7) S. Gavin, Phys. Rev. Lett. 92, 162301 (2004).