Spectral variability of GX 3394 in a hard-to-soft state transition ††thanks: Based on observations with INTEGRAL, an ESA project with instruments and science data centre funded by ESA member states (especially the PI countries: Denmark, France, Germany, Italy, Switzerland, Spain), Czech Republic and Poland, and with participation of Russia and the USA.
Abstract
We report on INTEGRAL observations of the bright black-hole transient GX 3394 performed during the period August-September 2004, including the fast transition (10 hr) observed simultaneously with INTEGRAL and RXTE on August 15th and previously reported. Our data cover three different spectral states, namely Hard/Intermediate State, Soft/Intermediate State and High/Soft State. We investigate the spectral variability of the source across the different spectral states. The hard X-ray spectrum becomes softer during the HIMS-to-SIMS transition, but it hardens when reaching the HSS state. A principal component analysis demonstrates that most of the variability occurs through two independent modes: a pivoting of the spectrum around 6 keV (responsible for 75% of the variance) and an intensity variation of the hard component (responsible for 21%). The pivoting is interpreted as due to changes in the soft cooling photon flux entering the corona, the second mode as fluctuations of the heating rate in the corona. These results are very similar to those previously obtained for Cygnus X-1. Our spectral analysis of the spectra of GX 3394 shows a high energy excess with respect to pure thermal Comptonisation models in the HIMS: a non-thermal power-law component seems to be requested by data. In all spectral states joint IBIS, SPI and JEM-X data are well represented by hybrid thermal/non-thermal Comptonisation (eqpair). These fits allow us to track the evolution of each spectral components during the spectral transition. The spectral evolution seems to be predominantly driven by a reduction of the ratio of the electron heating rate to the soft cooling photon flux in the corona, . The inferred accretion disc soft thermal emission increases by about two orders of magnitude, while the Comptonised luminosity decreases by at most a factor of 3. This confirms that the softening we observed is due to a major increase in the flux of soft cooling photons in the corona associated with a modest reduction of the electron heating rate.
keywords:
Gamma-rays: observations – accretion, accretion discs – black hole physics – X-rays: binaries – stars: individual: GX 33941 Introduction
Black hole candidates (BHCs) are known to show different spectral states in the X and -ray domain. The two main spectral states are the Low/Hard State (LHS), with the high energy spectrum described by a cut-off power-law (typically 1.5 and 100 keV), and the High Soft State (HSS) with a thermal component peaking at few keV and the high energy power-law much softer () Zdziarski (2000). Usually, this spectral variability is interpreted as due to changes in the geometry of the central parts of the accretion flow (see Done, Gierliński & Kubota 2007 for a recent review). In the LHS the standard geometrically thin and optically thick disc Shakura & Sunyaev (1973) would be truncated far away from the last stable orbit. In the innermost parts, a hot accretion flow is responsible for the high energy emission, via thermal Comptonisation of the soft photons coming from the truncated disc. In the HSS, the optically thick disc would extend close to the minimum stable orbit producing the dominant thermal component. The weak non-thermal emission at higher energy is believed to be due to up-scattering of the soft thermal disc emission in active coronal regions above the disc Zdziarski & Gierkiński (2004).
However, recently long XMM-Newton observations of GX 3394 have shown that a standard thin accretion disc may remain at the innermost stable circular orbit around the black hole also during the LHS (Miller et al. 2006, Reis et al. 2008)
Since its discovery Markert et al. (1973), the X-ray binary GX 3394 has been thoroughly studied at all wavelength from radio to gamma-rays. Its star companion is still unknown, even though upper limit on the optical luminosity allowed to classify the source as Low Mass X-ray Binary (LMXB; Shahbaz, Fender, & Charles 2001). Classified as BHC Zdziarski et al. (1998), GX 3394 is a transient source spending long periods in outburst. Hynes et al. (2003) estimated a mass function of 5.8 0.5 and Zdziarski et al. (2004) derived a lower limit on the distance of 7 kpc. Before the launch of RXTE the source had been observed mostly in the Low/Hard spectral state (LHS), even though few spectral transitions to the Very High state (VHS) were reported before Miyamoto et al. (1991). Thereafter GX 3394 remained bright and mostly in the LHS until 1999 when it went into quiescence. After the quiescent state observed by BeppoSAX (Kong et al. 2000, Corbel et al. 2003), GX 3394 showed two new outbursts: in 2002/2003 (Smith et al. 2002a, Belloni et al. 2005) and in 2004 after one year in quiescence (Buxton et al. 2004, Belloni et al. 2004). The long-term variability of GX 3394 (1987-2004) is extensively presented in Zdziarski et al. (2004).
The spectral evolution of the outburst of a black hole in low-mass system is often investigated by plotting the flux of the source as a function of the X-ray hardness. In this Hardness Intensity Diagram (HID), GX 3394 usually follows a q-like pattern throughout the outburst (Homan & Belloni 2005; Belloni 2005). The HSS and LHS correspond respectively to the left and right hand side vertical branches of the q. State transitions occur when the source crosses the upper or lower horizontal branches, those constitute intermediate states between the LHS and HSS. Depending on the location of the source on a horizontal branch, Belloni et al. (2005) have identified two different flavours of intermediate state: the Hard Intermediate State (HIMS) and Soft Intermediate State (SIMS). An alternative states classification defines the upper horizontal branch as VHS (see Tanaka & Lewin 1995; van der Klis 1995; McClintock & Remillard 2006).
During a typical outburst the source starts in a faint LHS, move upward along the LHS branch, then move leftward towards the HSS along the VHS branch, and when luminosity decreases the source moves down along the HSS before transiting right back to the LHS along the lower horizontal branch, and then back to quiescence in the LHS. A puzzling property of this evolution is that the spectral changes in GX 3394 lag the variations of the luminosity: hard-to-soft state transitions during the rising phase occur at higher luminosities than the soft-to-hard ones during the declining phase. The so-called “hysteresis” Zdziarski & Gierkiński (2004) is also observed in other LMXBs such as GRS 1758–258 and 1E 1740.7–2942 (Smith et al. 2002b; Del Santo et al. 2005).
The aim of this work is to use INTEGRAL Winkler et al. (2003) data collected during the softening of the 2004 outburst to study the broad-band spectral evolution of GX 3394 during a hard-to-soft state transition. Some of these data obtained on 2004 August 14th-16th, right across the HIMS-SIMS fast transition, are presented in Belloni et al. (2006). This transition, marked by the disappearing of type-C QPO and by the appearance of a type-B QPO (Nespoli et al. 2003), is also associated to the ejection of fast relativistic jets, which has led to the identification of a ’jet-line’ in the HID (Fender, Belloni & Gallo 2004). Moreover, focussing on the high energy part of the spectrum, Belloni et al. (2006) reported on the disappearing of the high energy cut-off (measured at 70 keV in the HIMS) in the SIMS. Recently, a similar evolution of such cut-off has been found for the BHC GRO J1655–40 Joinet et al. (2008). These authors propose that the cut-off increased significantly or vanished completely as the radio-jet turned off in the SIMS.
Here, we extend the work preliminarily presented in Del Santo et al. (2006) by studying the spectral evolution of GX 3394 over a longer period of time covering almost the whole span of the LHS-HSS transition (from 2004 August 9 to 2004 September 11). In this work, different Comptonisation models for spectral fitting have been used; furthermore, a principal component analysis provided the variability modes of GX 3394.
2 Observations and data analysis
The 2004 X-ray activity of GX 3394 started on February 9th (Smith et al. 2004, Belloni et al. 2004). This outburst was observed two times by the INTEGRAL satellite: during the first part of the hard X-ray activity (19 February–20 March) and during the decay of the hard X-ray flux, i. e. 9 August–11 September (the evolution of the flux and hardness of the source during this second period is shown in Fig.1). As expected in black hole transients Homan & Belloni (2005), at the beginning of the outburst GX 3394 was in the Low/Hard state (INTEGRAL observations presented in Joinet et al. 2007). On 2004 August 15 (INTEGRAL orbit 224), a fast spectral state transition Hard-Intermediate (HIMS) to Soft-Intermediate (SIMS) was reported using simultaneous RXTE and INTEGRAL observations Belloni et al. (2006). Thereafter GX 3394 displayed a softer state as also shown by the hardness ratio (Fig.1, bottom panel).
This paper is based on INTEGRAL public data collected during the second part of the outburst (including the fast spectral state transition) between revolution 222 and 233. Because of the smaller JEM-X FOV () with respect to IBIS (, fully coded), we selected a data sub-set containing all common pointings of JEM-X Lund et al. (2003), IBIS Ubertini et al. (2003) and SPI Vedrenne et al. (2003), for a total of 76 Science Windows (SCWs111Each SCW corresponds to a pointing of about 30 minutes.) (see Table 1 for details).
We reduced data of the IBIS low energy detector, ISGRI Lebrun et al. (2003), and JEM-X data using the INTEGRAL Off-Line Scientific Analysis (OSA; Courvoisier et al. 2003).
The SPI data analysis has been performed using a model fitting algorithm Bouchet et al. (2005). With the sources emitting in hard X-ray present within about 15 degrees around GX 3394, we built a sky model consisting of 6 sources (4U 1700–377, OAO 1657–415, 4U 1630–47, H 1636–536, IGR J16318–4848 and IGR J16320–4751), considered as constant on over a revolution, except 4U 1700–377, for which a 2000 seconds variability time-scale was used. The background pattern was built from the revolution 220.
The broad-band spectra were averaged in seven groups corresponding to the periods in Tab. 1. A division of the different groups into spectral states based on timing analysis of RXTE data, i. e. on the type of the observed QPOs, is also presented in the same table.
Because of the low statistics, SPI averaged spectra have been used only for spectral fitting of periods 1, 2 and 3. JEM-X1 camera spectra have been averaged in the energy range 4-20 keV for periods 1, 2, 3 and 4, and in the band 3-13 keV for 5 and 7. ISGRI and SPI data above 20 keV and 22 keV, respectively, have been used, while the high energy limits were chosen between 200 and 600 keV depending on the statistics.
Spectral fits were performed using the spectral X-ray analysis package XSPEC v. 11.3.1.

3 Spectral variability
As a first step in quantifying the spectral evolution of the source, we attempted to fit each of the 76 IBIS/ISGRI pointing spectra with a simple power-law (powerlaw under XSPEC) in the energy band 20-80 keV. Due to the consistent flux decreasing of GX 3394 (Fig. 1, panel 3 from the top), from period 3 onward the statistics by pointing is too poor to provide meaningful fit parameters. This is why from period 3 to 7, we fitted the spectra averaged over each data-set. The evolution of the photon index (Fig. 2) indicates that the spectrum softens when reaching the transition ( goes from 1.9 to 2.4). Thereafter it becomes harder when the soft state is reached ( in rev 226). The hard X-ray spectrum therefore appears softer around the end of the transition (i.e. in the SIMS) than in the HSS.
Then, we fitted the seven averaged broad-band spectra (IBIS, JEM-X and SPI when available) with a simple model combining a multicolor disc black-body (diskbb), a pawer-law (with a high energy cut-off when requested) and an emission line (gauss) fixed at 6.4 keV. Since the estimated absorption for GX 3394 is rather low and we did not have low-energy coverage, we fixed it to 5 cm-2 Meńdez & van der Klis (1997). Best-fit parameters of six periods (period 6 was avoided because of the statistic) are summarised in Tab. 2.
The main spectral changes are the steepening of the power-law component and disappearance of the high energy cut-off during the transition (periods 3 and 4). This is in agreement with the results obtained using simultaneous INTEGRAL and RXTE observations and extensively discussed in Belloni et al. (2006). During periods 5 and 7, the spectral parameters are consistent with being constant and the power-law is harder than in the SIMS (period 4). The disc temperature was frozen at 0.5 keV for periods 1 and 2, while for the others it was possible to constrain the parameter .

4 Averaged spectra
Since the cut-off power-law is simply an empirical model describing Comptonised spectra, we have used a further model which provides a physical description of X/-ray spectra. In this section, we present spectral fits obtained using a hybrid thermal/non-thermal Comptonisation model, namely eqpair Coppi (1999), and relativistic iron line line emission and disc reflection. The best-fit parameters of six periods are shown in Tab. 3.
In the eqpair model, emission of the disc/corona system is modeled by a spherical hot plasma cloud with continuous acceleration of electrons illuminated by soft photons emitted by the accretion disc. At high energies the distribution of electrons is non-thermal, but at low energies a Maxwellian distribution with temperature is established.
The properties of the plasma depend on its compactness where is the power of the source supplied by different components, the radius of the sphere ( cm) and is the Thomson cross-section. , , and correspond to the power in soft disc photons entering the plasma, thermal electron heating, electron acceleration and total power supplied to the plasma.
The spectral shape is insensitive to the exact value of the compactness but it depends strongly on the the compactness ratios and . It is customary, when fitting data with this model, to fix to some reasonable value and parametrise the model with these compactness ratios. Leaving as free parameter we do not obtain any improvement on the . We therefore fixed following Gierliński et al. (1999). On the contrary, we cannot fix because it is not included as free parameter in the eqpair version implemented in XSPEC.
If we knew with some accuracy the distance and size of the Comptonising region, the normalisation of the spectrum could provide a constraint on the absolute value of the compactness. Since, however, there are large uncertainties on the size of the emitting region, and since there could be several active regions in the accretion flow contributing to the observed flux, it is not straightforward to unambiguously constrain compactness from the observed luminosity. For this reason, in the version of eqpair used to fit the data there is an additional normalisation parameter which actually disconnects (as a fit parameter) from the observed luminosity.
The energy balance in the Comptonising medium depends mainly on the ratio . For larger values of the energy of the electrons is on average higher and, as a consequence, spectrum from Comptonisation is harder. From the best-fit parameters shown in Tab. 3, we indeed measure lower values of as the spectra become softer. Since in our spectral fits we chose to fix , in this model the variations of are only due to changes in .
However, due to the free normalisation parameter of eqpair we do not know if this what really happens in GX 3394 (i.e . is constant while changes). We know for sure that we observe a change in but we cannot tell from the fit parameters whether this evolution is due to changes in the heating rate of the corona, changes in the luminosity of the disc, or both.
Nevertheless, from the best fitting model we can get important insights by computing the absolute disc and Comptonised fluxes (respectively and ). If we consider the absolute values of and (see Tab. 3), we see that the thermal disc flux changes by more than one order of magnitude while the Comptonised flux decreases by a factor of about three. The softening we observe is therefore caused by a dramatic increase in the disc thermal flux in the corona associated with a modest reduction of the electron heating rate.
The size of the emitting region could be constant, or not. Assuming constant, as we did, it would imply that the size of the emitting region222or more exactly the number of X-ray emitting regions times their typical size increases by a factor of . On the contrary, the timing features usually indicate that the emitting region becomes smaller when a source evolves from the LHS toward the HSS (see e.g. Gilfanov, Churazov, Revnivtsev 1999). If this is the case in our observation, the soft compactness actually increases during the transition. The bolometric luminosity increased by a factor of two during the whole spectral evolution.
The seed photons temperature was frozen at 300 eV for the spectra of revolutions 222 and 223; thereafter it was possible to constrain this parameter and observe a slight increase (Tab. 3) simultaneously with the flux of soft cooling. This suggests that the increase of soft cooling photons is due to the higher temperature of the disc.
However, the disc luminosity tends to decrease for larger temperatures. The highest disc temperatures, achieved during period 5 and 7, do not correspond with the strongest observed blackbody fluxes of period 3 and 4. This suggests that the disc emitting area and geometry of the corona are not constant during the transition. The radiating disc surface area appears smaller in the HSS (periods 5 and 7) than in the intermediate states (periods 3 and 4). This suggests that the corona becomes more compact as the disc temperature increases. This would be consistent with the truncation radius of the accretion disc moving closer to the black hole in the HSS.
In order to consider the case of a hybrid plasma, the model allows for a fraction of the power to be injected in the form of non-thermal electrons rather than heating of the thermalised distribution. The non-thermal electrons are injected with a power-law distribution , with Lorentz factors ranging from to . From our spectral fits, we infer values in the range 2–3, as expected form shock acceleration models. We found large non-thermal fractions in all spectra, including the HIMS ones. This is in agreement with previous eqpair fits of Cygnus X-1 in intermediate states (Gierlinski et al. 1999; Malzac et al. 2006).
However, we tried to fix for all spectra. It resulted that only for the period 1 we obtained a good (i.e. 0.98) with remaining parameters consistent within the errors to the ones in Tab. 3. For the other spectra, not negligible fraction is required. Unfortunately the uncertainties on are quite large and do not allow us to draw any conclusion regarding its evolution during the spectral transition.
Another interesting free parameter is the Thomson optical depth (). It is related to the ionization electrons only. The total optical depth () is the sum of the optical depth of pairs plus . In agreement with previous studies Gierliński et al. (1999) our fits show that the electron-positron pairs constitute only a small, if not negligible, fraction of the Comptonising leptons. An interesting trend is that the Thomson optical depth of the corona decreases significantly during the transition. This could be linked to the ’compactification’ of the corona inferred from the evolution of the soft photon compactness and disc luminosity, if the electron density remains constant while the size of the corona decreases.
The disc reflection component is calculated for neutral material with standard abundances. We assumed an inclination angle of 50 . This component is then convolved with a general relativistic kernel assuming reflection on an accretion disc extending from 6 to 1000 gravitational radii around a Schwarzschild black hole.
We checked the need for the reflection component freezing / at 0. The results show that the are consistently worst (F-test probabilities 10-4), confirming that introducing the reflection component improves significantly the fits. We can conclude that Compton reflection is requested by the data. Our fits suggest that the reflection component increases up to /=1 as the spectrum goes in softer states. This is expected in the truncated disc model as the system evolves from a geometry where the reflecting disc is truncated at a large distance from the black hole (and therefore intercepts a small fraction of the coronal radiation) to a situation where the accretion disc is sandwiched by the illuminating corona. In period, 4, 5 and 7 the statistics was too low to constrain the reflection parameter and we decided to freeze it to .
We used the XSPEC model diskline to model the iron line Fabian et al. (1989). Due to the energy resolution and line sensitivity, the iron line study cannot be performed with JEM-X. The line energy was therefore imposed at 6.4 keV. The inclination angle, inner radius of the disc and the disc emissivity law were fixed at the same values as in the Compton reflection model. The normalisation is therefore the only free parameter for the iron line emission.
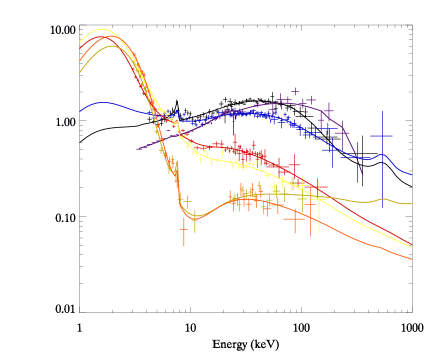
Spectra and models of the six different periods are shown in Fig. 3. For a comparison between all the states, the LHS spectrum observed in July Joinet et al. (2007) has been plotted in the same figure.


5 The high energy excess
During the Low/Hard state of the GX 3394 outburst occurred in 1991, a high energy excess (above 200 keV) was observed with OSSE (Johnson et al. 1993; Wardziński et al. 2002). In March 2004, i. e. during the increasing phase of the 2004 outburst, Joinet et al (2007) observed a similar feature with SPI when GX 3394 was in its canonical LH state. Similar features have been recently reported for other black hole transients in LH states observed during the decreasing phase of the outbursts (Kalemci et al. 2006; Kalemci et al. 2005). It is also more commonly associated with state transitions Malzac et al. (2006) and with soft states Gierliński et al. (1999) ( in which case the non-thermal emission actually dominates over thermal Comptonisation).
Such a hard tail is usually attributed to the presence of a small fraction of non-thermal electrons in the hot Comptonising plasma. In the LHS and HIMS such a high energy excess could also be the result of spatial/temporal variations in the plasma parameters (see e.g. Malzac & Jourdain 2000). In the HIMS of our observations, i.e. rev 222, 223 and 224.1, GX 3394 shows a highly significant evidence of a cut-off around 70-100 keV. This indicates that soft photons are Comptonised by a thermal electrons population with a temperature that can be measured by the cut-off energy. In addition, we found non-negligible values of for revolutions 223 and 224.1, indicating that a non-thermal emission is also requested by the data.
In order to investigate furtherly the possible presence of a non-thermal component during the HIMS, IBIS and SPI spectra of the three HIMS periods (rev 222, 223 and 224.1) have been fitted with the compps model of Poutanen & Svensson (1996) (see Tab. 4). Using this thermal Comptonisation model, some residuals are present at high energy, especially in the spectrum of rev 223 (Fig. 4). In order to mimic the presence of a non-thermal component, we added a power-law to the pure thermal Comptonisation model (Fig. 5). This led to an improvement of the that is highly significant for orbit 223 (Tab. 4). The F-test probability that this improvement was by chance is . On the contrary, because of the low statistics in rev 224.1, adding a power-law to the Comptonisation model is not required.
compps is a highly accurate iterative scattering Comptonisation model in which subsequent photon scatterings are directly followed. In practice this method is limited to Comptonisation in a plasma of reasonably small Thomson optical depth ( for spherical geometry). In order to be sure that the presence of a non-thermal component does not depend on the specific Comptonisation model, we also fitted the data with the comptt model of Titarchuk (1994) which is based on an approximate solution of the kinetic equation with some relativistic corrections. We performed the same fits as with compps. As expected, we found significantly different numerical values of the best-fit parameters (see Tab. 4). However, we obtained a stronger indication regarding the presence of the non-thermal component: the addition of a power-law leads to a highly significant improvement of the both in spectra of rev 222 and rev 223.
6 The principal Component Analysis
In order to study the overall variability of GX 3394 we present in this section a further analysis, i. e. Principal Component Analysis (PCA), based on a different approach. The PCA is a powerful tool for multivariate data analysis used for a broad range of applications in natural as well as social science Kendall (1980). The main use of the PCA is to reduce the dimensionality of a data-set while keeping as much informations as possible. PCA transforms a number of (possibly) correlated variable in a smaller number of uncorrelated variables called principal components.
Details on the method, applied to the analysis of the spectral variability of Cyg X–1 with INTEGRAL, are given in Malzac et al. (2006). It provides us an approximation of the broad-band energy spectrum for each pointing that will be used for a physical interpretation of the variability. This method is much more convenient than fitting the spectra for each SCW, also considering the large number of model parameters and the poor statistic of spectra in short (3-4 ks) exposure times.
Here, we applied a similar procedure to the state transition data of GX 3394. We used p=76 spectra (one for each SCW) binned into n=15 bins corresponding to the following energy bands: 3-4, 4-5, 5-6, 6-7, 7-9, 9-11, 11-13, 13-15, 15-20, 20-30, 30-40, 40-50, 50-70, 70-100, 100-200 keV.
This PCA showed that only two independent components contribute significantly to the variability of GX 3394 during the state transition. These two components are displayed in Fig. 6. The first component (PC1), responsible for 75% of the sample variance, consists in a pivoting of the spectrum around 6 keV. The second component (PC2) consists in intensity variation of the hard power-law component (almost constant slope) on top of constant soft component. It contributes to 21% of the sample variance. The timescale of the two variability modes is not firmly determined because our observations are not continuous. We can only state that, it is comprised between 2 ks, i. e. the minimum duration of a pointing, and one month, i. e. duration of the whole observation.
These results are remarkably similar to those obtained by Malzac et al. (2006) during an intermediate state of Cyg X1. These authors found that the spectral variability occurred through two independent modes: the first consisted in changes in the overall luminosity on time scale of hours with almost constant spectrum (flaring mode); the second mode consisted in a pivoting of the spectrum around 10 keV. The flaring mode was interpreted as fluctuations of the heating rate in the corona possibly associated to some erratic magnetic activity. The pivoting was associated to a mini-state transition. It was interpreted as due to changes in the soft cooling photon flux entering the corona as a consequence of variations of the temperature and luminosity of the optically thick disc.
Unlike Cyg X1, in GX 3394 the pivoting mode is more important than the flaring mode, probably because Cyg X1 was observed during an incomplete spectral transition hard-to-intermediate, while GX 3394 achieved finally a softer state. The presence of a pivot at 6 keV dominating the variability is apparent in the averaged spectra shown in Fig. 3. In the framework of the eqpair model, this pivoting is clearly associated to the disc getting hotter, with the thermal component becoming prominent while the ratio was decreasing, leading to a softer and weaker hard X-ray spectrum. The interpretation of the pivoting mode in both Cyg X1 and GX 3394 as due to variations in the soft cooling photon flux entering the corona is very plausible.
7 Conclusions
We have presented INTEGRAL observations of GX 3394 which covered part of the 2004 outburst. We followed the source spectral evolution through the Hard-Intermediate and Soft-Intermediate states, until the High-Soft state.
During the HIMS-to-SIMS transition we found that the high energy cut-off disappears, in agreement with Belloni et al. (2006). Furthermore, the hard X-ray spectrum appears softer during the transition states than in the HSS.
Our detailed spectral analysis of time averaged spectra at different stages of the transition confirms that the spectral transition is driven by changes in the soft cooling photon flux in the corona associated with an increase of disc temperatures (leading to dramatic increase of disc luminosity). The measured disc temperature versus luminosity relation suggests that the internal disc radius decreases. In contrasts, the heating rate of the electrons in the corona appears to remain nearly constant. Although other models such as dynamic accretion disc corona models cannot be ruled out, these results are consistent with the so-called truncated disc model (Done et al. 2007).
In all spectra, including those in of HIMS, we found a significant contribution from a non-thermal component. This component appears as a high energy excess above the pure thermal Comptonisation spectrum. We associated this component with the presence of a non-thermal tail in the distribution of the Comptonising electron.
Finally we analysed the variability of the source during the state transition with a PCA. The PCA shows that the variability of GX 3394 can be described as produced through two independent modes:
-
•
spectral evolution with the spectrum pivoting around 6 keV (PC1) contributing for 75% of the observed variance. The pivoting mode may be interpreted as caused by changes in the soft cooling photons flux in the hot Comptonising plasma associated with an increase of temperature of the accretion disc. These changes are well in agreement with the variation in the flux of the soft cooling photons found by fitting averaged spectra with eqpair.
-
•
intensity variation of the hard power-law component (almost constant slope) on top of constant soft component (PC2) contributing at 21%, also consistent with the variations of either the compactness ratio or the hard X-ray luminosity, both found by the spectral fitting. This variability mode could be due to magnetic flares or local instabilities in the corona.
Acknowledgments
Data analysis is supported by the Italian Space Agency (ASI), via contract ASI/INTEGRAL I/008/07/0. MDS thanks Memmo Federici for the INTEGRAL data archival support at IASF-Roma. JM acknowledges support from CNRS. TMB acknowledges support from the International Space Science Institute (ISSI) and from ASI via contract I/088/06/0.
References
- Belloni et al. (2004) Belloni T., Homan J., Cui W., Swank J., 2004, ATel #236
- Belloni et al. (2005) Belloni T., Homan J., Casella P., et al. 2005, A&A, 440, 207
- Belloni (2005) Belloni T., 2005, Proceedings of COSPAR Colloquium ”Spectra & Timing of Compact X-ray Binaries,” 2005, Mumbai, India
- Belloni et al. (2006) Belloni T., Parolin I., Del Santo M., et al., 2006, MNRAS, 367, 1113
- Bouchet et al. (2005) Bouchet L., Roques J. P., Mandrou P., et al., 2005, ApJ, 635, 1115
- Buxton et al. (2004) Buxton M., Gallo E., Fender R. P., Bailyn C., 2004, ATel #230
- Coppi (1999) Coppi P. S., 1999, ASP Conf. Ser. 161: High Energy Processes in Accreting Black Holes, 161, 375
- Corbel et al. (2003) Corbel S., Nowak M. A., Fender R. P., Tzioumis A. K., Markoff S., 2003, A&A, 400, 1007
- Courvoisier et al. (2003) Courvoisier T. J.-L., Walter R., Beckmann V., et al., 2003, A&A, 411, L53
- Del Santo et al. (2005) Del Santo M., Bazzano A., Zdziarski A. A., et al., 2005, A&A, 433, 613
- Del Santo et al. (2006) Del Santo M., Malzac J., Ubertini P., Belloni T., 2006, Proceed. VI Microquasar Workshop, 76
- (12) Done C., Gierliński M., Kubota A., 2007, A&A Review, 15, 1
- Fabian et al. (1989) Fabian A. C., Rees M. J., Stella L., White N. E., 1989, MNRAS, 238, 729
- Fender, Belloni & Gallo (2004) Fender R. P., Belloni T., Gallo E., 2004, MNRAS, 355, 1105
- Gierliński et al. (1999) Gierliński M., Zdziarski A. A., Poutanen A. A., et al., 1999, MNRAS, 309,496
- Gilvanov, Churazov & Revnivtsev (1999) Gilfanov M., Churazov E., Revnivtsev M., 1999, A&A, 352, 182
- Hynes et al. (2003) Hynes R. I., Steeghs D., Casares J., Charles P. A., O’Brien K., 2003, ApJ, 583, L95
- Homan & Belloni (2005) Homan J., Belloni T., 2005, in “From X-ray Binaries to Quasars: Black Hole Accretion on All Mass Scales”, Eds. Maccarone, Fender, Ho, in press. (astro-ph/0412597)
- Johnson et al. (1993) Johnson W. N., Kurfess J. D., Purcell W. R., et al., 1993, A&AS, 97, 21
- Joinet et al. (2007) Joinet A., Jourdain E., Malzac J., et al., 2007, ApJ, 657, 400
- Joinet et al. (2008) Joinet A., Kalemci E., Senziani F, 2008, ApJ accepted, astro-ph 0803.3934
- Kalemci et al. (2005) Kalemci E., Tomsick J. A., Buxton M. M., et al., 2005, ApJ, 622, 508
- Kalemci et al. (2006) Kalemci E., Tomsick J. A., Rothschild R. E., et al., 2006, ApJ, 639, 340
- Kendall (1980) Kendall M. G., 1980, “Multivariate analysis”, ed. Griffin & co. London
- Kong et al. (2000) Kong A. K. H., Kuulkers E., Charles P. A., Homer L., 2000, MNRAS, 312, L49
- Lebrun et al. (2003) Lebrun F., Leray J. P., Lavocat, P., et al., 2003, A&A, 411, L141
- Lund et al. (2003) Lund N., Jorgensen C., Westergaard N. J., et al., 2003, A&A, 411, L231
- Malzac & Jourdain (2000) Malzac J., Jourdain E., 2000, A&A, 359, 843
- Malzac et al. (2006) Malzac J., Petrucci P. O., Jourdain E., et al., 2006, A&A, 448, 1125
- Markert et al. (1973) Markert T. H., Canizares C. R., Clark G. W., et al., 1973, ApJ, 184, L67
- (31) McClintock J. E., & Remillard R. A., 2006, in “Compact stellar X-ray sources”, W. H. G. Lewin & M. van der Klis Eds., Cambridge University Press
- Meńdez & van der Klis (1997) Meńdez M., van der Klis M., 1997, ApJ, 479, 926
- Miller et al. (2006) Miller J., Homan J., Steeghs D., et al., 2006, ApJ, 653, 525
- Miyamoto et al. (1991) Miyamoto S., Kimura K., Kitamoto S., Dotani T., Ebisawa K., 1991, ApJ, 383, 784
- Nespoli et al. (2003) Nespoli E., Belloni T., Homan J., Miller J.M., Lewin W.H.G., Méndez M., van der Klis M., 2003, A&A, 412, 235
- Poutanen & Svensson (1996) Poutanen J., Svensson R., 1996, ApJ, 470, 249
- Reis et al. (2008) Reis R. C., Fabian A. C., Ross R., Miniutti G., Miller J. M., Reynolds C., 2008, MNRAS, in press, arXiv:0804.0238
- Shahbaz, Fender, & Charles (2001) Shahbaz T., Fender R. P., Charles P. A., 2001, A&A, 376, L17
- Shakura & Sunyaev (1973) Shakura N. I., Syunyaev R. A., 1973, A&A, 24, 337
- (40) Smith D. M., Belloni T., Heindl W. A., et al., 2002a, ATel #95
- Smith et al. (2004) Smith D. M., Heindl W. A., Swank J. H., Wilms J., & Pottschmidt K., 2004, ATel # 231
- (42) Smith D. M., Heindl W. A., Swank J. H., 2002b, ApJ, 569, 362
- Tanaka & Lewin (1995) Tanaka Y., Lewin W. H. G., 1995, in “X-ray Binaries”, Cambridge Astrophysics Series (Cambridge, MA: Cambridge Univ. Press), ed. W. H. G. Lewin, J. van Paradijs & E. P. H. van den Heuvel, 126
- Titarchuk (1994) Titarchuk L., 1994, ApJ, 434, 313
- Ubertini et al. (2003) Ubertini P., Lebrun F., Di Cocco G., et al., 2003, A&A, 411, L131
- (46) van der Klis M., in “X-ray Binaries”, Cambridge Astrophysics Series (Cambridge, MA: Cambridge Univ. Press), ed. W. H. G. Lewin, J. van Paradijs & E.P.H. van den Heuvel, 252
- Vedrenne et al. (2003) Vedrenne G., Roques J. P., Schnfelder V., et al., 2003, A&A, 411, L63
- Wardziński et al. (2002) Wardziński G., Zdziarski A. A., Gierliński M., Grove J. E., Jahoda K., Johnson W. N., 2002, MNRAS, 337, 829
- Winkler et al. (2003) Winkler C., Courvoisier T. J.-L., Di Cocco G., et al., 2003, A&A, 411, L1
- Zdziarski et al. (1998) Zdziarski A. A., Poutanen J., Mikolajewska J., et al., 1998, MNRAS, 301, 435
- Zdziarski et al. (2004) Zdziarski A. A., Gierkiński M., Mikolajewska J., et al., 2004, MNRAS, 351, 791
- Zdziarski & Gierkiński (2004) Zdziarski A. A., Gierkiński M., 2004, Progress of theoretical Physics, 155, 99
- Zdziarski (2000) Zdziarski A. A., 2000, Proceedings of IAU Symposium, 195, 153
| Period | Rev. | Start (MJD) | End (MJD) | Exp. IBIS (ks) | Exp. JEM-X | SCW | State |
|---|---|---|---|---|---|---|---|
| 1 | 222 | 53226.14 | 53227.12 | 24.8 | 24.3 | 6 | HIM |
| 2 | 223 | 53228.36 | 53229.78 | 32.1 | 31.8 | 8 | HIM |
| 3 | 224.1 | 53231.93 | 53232.65 | 48.5 | 48.6 | 22 | HIM |
| 4 | 224.2 | 53232.68 | 53233.13 | 30.4 | 29.0 | 14 | SIM |
| 5 | 226 | 53236.61 | 53237.77 | 33.3 | 32.5 | 10 | HS |
| 6 | 227-229 | 53241.67 | 53245.90 | 9.07 | 6.05 | 3 | HS |
| 7 | 232-233 | 53255.12 | 53259.51 | 25.2 | 25.4 | 13 | HS |
| Period | Rev. | (keV) | (keV) | (dof) | |
|---|---|---|---|---|---|
| 1 | 222 | (0.5) | 1.0(243) | ||
| 2 | 223 | (0.5) | 1.1 (214) | ||
| 3 | 224.1 | 1.2(216) | |||
| 4 | 224.2 | 1.1(173) | |||
| 5 | 226 | 1.1(121) | |||
| 7 | 232-233 | 1.0(98) |
| Period | Rev | kTbb | / | kTe | (dof) | Flux | |||||||
|---|---|---|---|---|---|---|---|---|---|---|---|---|---|
| [eV] | [keV] | [erg cm-2 s-1 ] | |||||||||||
| 1 | 222 | (300) | 2.72 | 23.2 | 0.99(243) | 11.3 | 1.0 | 9.4 | |||||
| 2 | 223 | (300) | 2.05 | 19.2 | 1.17(219) | 12.4 | 2.1 | 8.9 | |||||
| 3 | 224.1 | 0.20 | 45.0 | 1.14(215) | 21.0 | 15.4 | 5.6 | ||||||
| 4 | 224.2 | (1) | 0.36 | 29.4 | 1.06(173) | 24.3 | 17.8 | 6.5 | |||||
| 5 | 226 | (1) | 0.1 | 21.7 | 1.15(121) | 13.8 | 10.9 | 2.9 | |||||
| 7 | 232-233 | (1) | 0.7 | 5.5 | 1.0(98) | 18.4 | 13.8 | 4.2 | |||||
| Rev | Model | (keV) | tau-y | / | (dof) | F-test | ||
|---|---|---|---|---|---|---|---|---|
| 222 | ||||||||
| comptt | ||||||||
| comptt+po | ||||||||
| compps | ||||||||
| compps+po | 0.1 | |||||||
| 223 | ||||||||
| comptt | ||||||||
| comptt+po | ||||||||
| compps | ||||||||
| compps+po |