Molecular Gas and Star formation in ARP 302
Abstract
We present the Submillimeter Array observation of the CO =21 transition towards the northern galaxy, ARP 302N, of the early merging system, ARP 302. Our high angular resolution observation reveals the extended spatial distribution of the molecular gas in ARP 302N. We find that the molecular gas has a very asymmetric distribution with two strong concentrations on either side of the center together with a weaker one offset by about 8 kpc to the north. The molecular gas distribution is also found to be consistent with that from the hot dust as traced by the 24 m continuum emission observed by the Spitzer. The line ratio of CO =21/10 is found to vary strongly from about 0.7 near the galaxy center to 0.4 in the outer part of the galaxy. Excitation analysis suggests that the gas density is low, less than 103 cm-3, over the entire galaxy. By fitting the SED of ARP 302N in the far infrared we obtain a dust temperature of =26–36 K and a dust mass of Mdust=2.0–3.6108 M⊙. The spectral index of the radio continuum is around 0.9. The spatial distribution and spectral index of the radio continuum emission suggests that most of the radio continuum emission is synchrotron emission from the star forming regions at the nucleus and ARP302N-cm. The good spatial correspondance between the 3.6 cm radio continuum emission, the Spitzer 8 & 24 m data and the high resolution CO =21 observation from the SMA shows that there is the asymmetrical star forming activities in ARP 302N.
1 Introduction
Most luminous infrared (IR) galaxies (LIRGs; 1011 L⊙ LIR 1012 L⊙) are found in interacting or merging systems with disturbed morphologies. In the standard scenario proposed by Sanders et al. (1988a,b), the formation of LIRGs, or ultra-luminous infrared galaxies (ULIRGs) is due to the interaction and merging of two gas-rich galaxies. Numerical simulations of interacting galaxies (Barnes & Hernquist, 1991; Mihos & Hernquist, 1996) indicate that a stable bar is formed during the first encounter. Under the gravitational torque induced by the bar, the molecular gas is channelled into the central regions of the galaxies forming a huge reservoir to fuel intense starbursts. Recent high angular resolution observations (Downes & Solomon, 1998) seem to support this picture by revealing rotating disks of molecular gas that has been driven into the centers of the mergers.
A lot of (U)LIRGs have been studied at high angular resolution, for example ARP 299 (Casoli et al., 1999), NGC5394/95 (Kaufman et al., 2002), ARP 220 (Wiedner et al., 2002), NGC4038/39 (Zhu et al., 2003), NGC5194/95 (Matsushita et al., 2004), NGC 6090 (Wang et al., 2004), NGC5218 (Olsson et al., 2007). A few samples of the sources along the merging sequence are also been investigated. Xilouris et al. (2004) found evidence for an increase in 100- to 850-m flux density ratio along the merging sequence and interpreted this trend as an increase of the mass fraction of the warm dust in comparison to the cold dust, inferring the possible enhanced star formation rate (SFR). Bergvall et al. (2003), however, question the ubiquitous connection between interactions and starburst activity. Gao & Solomon (1999) find the enhanced star formation efficiency (SFE) for the later merging systems, but the effect is cancelled by the decrease in the amount of molecular gas. That might result in no change in the infrared luminosity, i.e. the indicator of the starburst activity. Thus more sources in high resolution are needed and multiple CO transtions are essential to investigate the gas properties for the mergers at different stages.
Here we present another case study of an early merger system, ARP 302. This galaxy is also named as VV 340 or UGC 9618, which consists of two galaxies (ARP 302N and ARP 302S) with a separation of about 40 between the two nuclei, which is 27 kpc at the angular distance of 138 Mpc (the luminosity distance is 147 Mpc), and has an infrared luminosity of 4.51011 L⊙. ARP 302 is the most CO luminous system known in the local universe, and more luminous in CO than those ultraluminous galaxies out to redshifts of 0.27 (Solomon et al. 1997). The detected molecular gas mass is 9.11010 M⊙ (Lo, Gao & Gruendl, 1997) (corrected by the adopted comsmology here). HI data gives a mass of atomic hydrogen 2.71010 M⊙ (van Driel, Gao & Monnier-Ragaigne, 2001). In all observations it was found that ARP 302N contributes most of the IR emission and molecular gas mass.
Previous high resolution CO =10 observation on ARP 302 by Lo, Gao & Gruendl (1997) (the angular resolution is 75) reveals two extended CO disks ( 10 kpc), and ARP 302N shows roughly an exponential disk with a scale length of 7 kpc extending out to 23 kpc in diameter. Based on the unusually extended distribution of the molecular gas, Lo, Gao & Gruendl (1997) concluded that the high IR luminosity in ARP 302 arises simply because an extremely large amount of molecular gas is forming high-mass stars at a rate similar to the Galaxy, instead of the starburst activities in the galactic nucleus.
In this study, we report the high angular resolution CO =21 observation of ARP 302N and the analysis of archival data in the radio and mid/far infrared to study the physical properties of the gas as well as the star formation activities in this early merger. In §2, we show the details of our observations together with the information about the archive data used in this paper. In §3.1, §3.2 and §3.3, we present the results of spatial distribution and the kinematics of the molecular gas of our observations. In §3.4 and §3.5, the results of the radio emission and the mid/far infrared emission from the archive data are presented. Finally we present the dust properties using a dust model in §4.1, the excitation condition of the gas in §4.2, the star formation activities in §4.3 and a comparison with other mergers in §4.4. A summary of this study is given in §5. In this paper, we use a cosmology with km s-1 Mpc-1, and (Spergel et al., 2003).
2 Observations
2.1 CO =21 observation with the Submillimeter array
We carried out the observation of the CO =21 line from ARP 302N on 2005 March 26, using the Submillimeter array (SMA555The Submillimeter Array is a joint project between the Smithsonian Astrophysical Observatory and the Academia Sinica Institute of Astronomy and Astrophysics, and is funded by the Smithsonian Institution and the Academia Sinica.) (Ho, Moran & Lo, 2004) in its most compact configuration. At that time the SMA consists of 7 antennas of 6 meter in diameter. The weather condition during our observations is average, with atmospheric opacity at zenith 0.35. The single sideband system temperature is about 450 K. Because of the large extent of ARP 302N, we cover the whole galaxy using a two-pointing mosaic, with a separation of 20 between the two pointings located at 10 north and south of the nucleus (=14h57m00s.67, =+24o3702.8).
The total on-source time was about 2 hours per one pointing. We observed the CO =21 line in the upper sideband of the double sideband receiver. The SMA digital correlator was configured to provide twenty-four independent spectral windows in each sideband. Each window was divided into 128 channels, which provided 0.8 MHz frequency resolution (i.e. 1.1 km s-1) at 223 GHz, giving a total frequency coverage in each sideband of 1.97 GHz (i.e. 2650 km s-1). We tuned the SMA receivers to the redshifted CO =21 line at the frequency of 222.967 GHz, which corresponds to the systemic velocity of 10180 km s-1. We observed Jupiter and Callisto for bandpass and flux calibration respectively, and estimated the flux density scale to be accurate to about 10% at 1.3 mm band. The nearby quasar 1357+193 was observed every 20 minutes to correct for time-dependent gain variations due to atmospheric fluctuations. The data were calibrated using the MIR-IDL package, which was specially developed for the SMA. We then exported the data into MIRIAD format for further processing. The mosaiced images made from SMA data were deconvolved using the Steer-Dewdney-Ito clean algorithm (Steer et al., 1984). The synthesized beam size is 3.42.5 for the CO =21 observatrion with the uniformed weighting and the resulting noise level is 60 mJy beam-1 at a velocity resolution of 20 km s-1. The 230 GHz continuum image of ARP 302N was formed from the line-free channels and the rms noise level is 5 mJy beam-1. No 1.3 mm continuum emission was detected from our observation at 3 level of 15 mJy beam-1.
2.2 CO =21 observation with the Submillimeter Telescope
To estimate the amount of CO J=2–1 flux recovered in our SMA observations, we also observed the CO =21 line in ARP 302N with a single dish telescope, the Submillimeter Telescope (SMT), in Arizona on 2005 December 14 under excellent weather condition ( 0.08). The observation was done in beam switching mode, with a beam throw of 2 arcmins and a chopping frequency of 1.25 Hz. The half-power beamwidth (HPBW) of the SMT telescope at the frequency of CO J=2–1 line is 28, which is large enough to cover most of the CO emitting region of ARP 302N. The acousto-optical spectrometer (AOS) was used as the backend, with a usable bandwidth of 1 GHz and a velocity resolution of 1.3 km s-1. A single pointing observation was made toward the nucleus of ARP 302N. The on-source integration time was 45 minutes. The data was reduced with the GILDAS software package. All the spectra were then co-added to produce the final CO J=2–1 spectrum of ARP 302N. The final spectra were smoothed to the resolution of 14 km s-1. The noise level on antenna temperature scale was 3 mK. We converted the spectrum into main beam temperature scale using a main beam efficiency of 0.66.
2.3 VLA archive data
We searched the Very Large Array data archive, which is provided by the National Radio Astronomy Observatory (VLA666The National Radio Astronomy Observatory is a facility of the National Science Foundation operated under cooperative agreement by Associated Universities, Inc.), for data on ARP 302N. Previous observations were found for X band (8.44 GHz, i.e. 3.6 cm), C band (4.86 GHz, i.e. 6.0 cm) and L band (1.49 GHz, i.e. 20 cm). We used the NRAO data reduction package to reduce the available data sets. Continuum images were made using a natural weighting. For X-band data, which were obtained in the extended configuration, we applied tappering to the data in order to recover the more extended continuum emission.
2.4 Spitzer archive data
To compare with our SMA data, we also searched for the archival data on ARP 302N produced by the Spitzer telescope. We found that ARP 302N was imaged with the Infrared Array Camera (IRAC; Fazio et al. 2004) in all four channels (3.6, 4.5, 5.8, and 8.0 m) on 2005 July 16 and with Multiband Imaging Photometer for Spitzer (MIPS; Rieke et al. 2004) in 24, 70 and 160 m on 2005 January 25. The images were reduced with the Spitzer Science Center (SSC) IRAC reduction pipeline and combined with the SSC mosaicker. The point spread functions are 2.2, 6, 18 and 40 for 8, 24, 70 and 160 m wavelengths, respectively. We only use the 8.0 m and the MIPS data in this paper. The uncertainties on the final absolute calibrations are estimated at 10%, 10%, 20%, and 20% for the 8, 24, 70, and 160 m data, respectively.
3 Results
3.1 Spatial distribution of the molecular gas
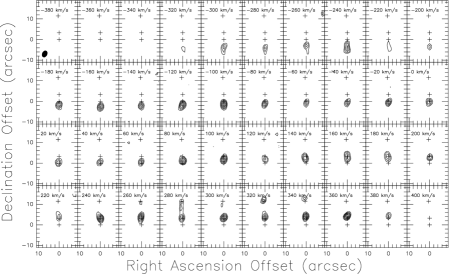
In Figure 1 we show the channel maps of CO =21 emission for ARP 302N. There is a clear positional shift of the emission centroid with the velocity along the north-south direction, consistent with the rotation of the gas in the galactic disk. In each velocity channel we find that the emission is just barely resolved in the east-west direction, which is perpendicular to the galactic plane. In the channels with the velocity within 80 km s-1, the emission is compact and only slightly resolved by the SMA, showing a symmetric distribution. The emission in this velocity range is centered at the nucleus and the emission of some channels is weaker than the channels outside this range. In higher redshifted and blueshifted velocity channels the emission is slightly more extended in the north-south direction, especially for the channels above 220 km s-1. For the receding part of the galaxy the CO J=2–1 emission is resolved into two distinct components, which are separated by about 8.
Because the total extent of the CO emission is significant by comparison with the primary beam of the SMA, part of the CO flux could be resolved out in our SMA observations. In Figure 2 we compare the spectrum of CO J=2–1 obtained with the SMT at the resolution of 28 and that obtained by convolving our SMA channel maps to the same resolution. The CO =21 flux detected by the SMA within one SMT beam centered at the nucleus is 356(8) Jy km s-1. It suggests that the SMA recovers about 60% of the CO =21 flux from Arp 302 in comparison with a total flux of 576 Jy km s-1detected by the SMT. The total CO =21 flux detected by the SMA is 382 (10) Jy km s-1. The most significant difference between both spectrum is the comparatively lower emission in the SMA spectrum from 220 to 320 km s-1, which could be due to extended emission that is partially resolved out by the SMA in the outer northern region. The similarity in the line shape between single dish and the SMA spectrum suggests that the missing flux is more or less uniformly distributed across the line.
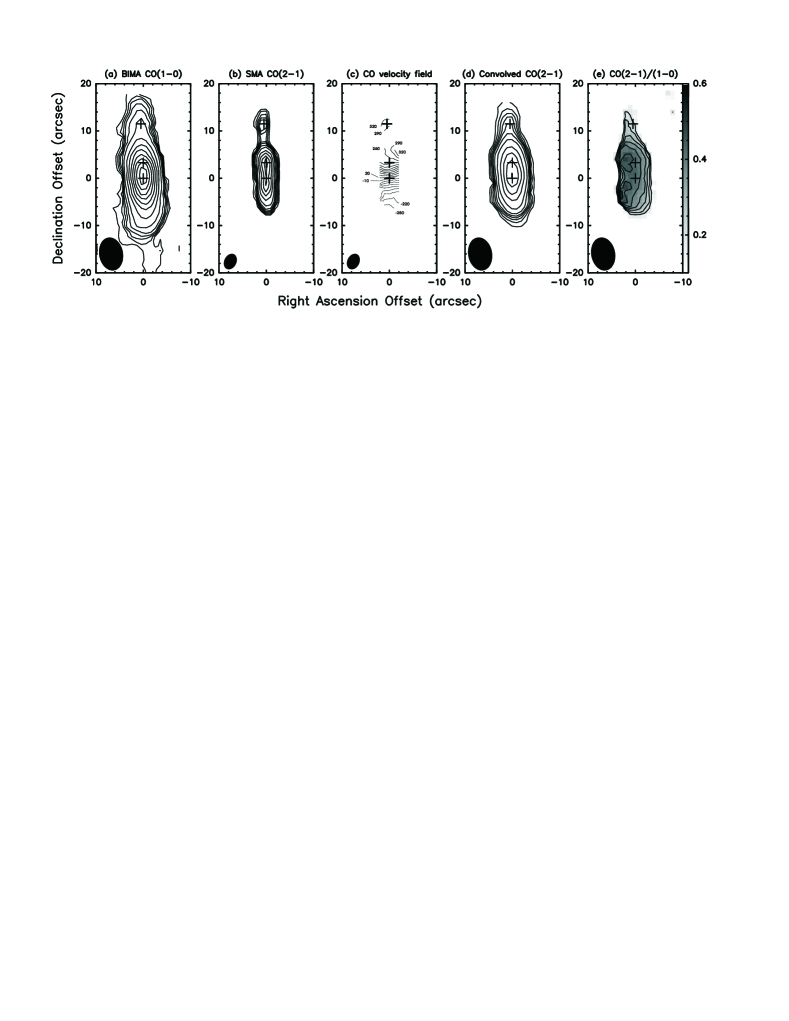
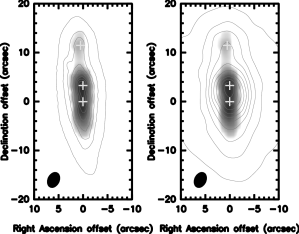
Figure 3(b) shows the contours of integrated CO =21 intensity map at 3.42.5 resolution by the SMA. The molecular gas almost covers the entire optical disk of the galaxy seen almost edge on and distributes over a region with the size of about 15 kpc. We find that the molecular gas has a very asymmetric distribution with two strong concentrations on either side of center together with a outmost weaker concentration offset by about 8 kpc to the north. In the figure, we show three crosses from bottom to top: one is at the nucleus, the second is at the peak of 3.6 cm emission outside of the nucleus (see §3.4) and the third one is at the outmost north for the weak CO J=2–1 emission concentration. To compare with the BIMA data, we show the BIMA CO =10 map in Figure 3(a). Our higher resolution map allows us to investigate the molecular gas distribution with three concentrations along the north-south direction, which the BIMA data can not tell us. We also convolved the SMA beam to the BIMA’s and the map is shown in Figure 3(d). The BIMA map shows more extended distribution of the gas with large radial distance comparison with the SMA result, which may be due to the different exciation conditions for the gas at large radial distance.
3.2 CO =21/=10 line ratio
In Figure 3(e), we present the map of the brightness temperature ratio of CO =21 emission from the SMA to CO =10 emission from the BIMA. To calculate the line ration, we first convolve our CO =21 map to the same angular resolution of 75 of the BIMA data as shown in Figure 3(d) and form the line ratio map. We find that the line ratio varies from 0.2 at the outer region to about 0.5 at the peaks. The ratio should be the lower limit since the missing flux of the SMA is about 36% but there is no missing flux for the BIMA data – the flux of 30445 Jy km s-1 from the BIMA CO =10 observation (Lo, Gao & Gruendl, 1997) is similar to the value of 29035 Jy km s-1 from NRAO 12m telescope (private communication from Y. Gao; Gao & Solomon 1999). The line ratio is a very important observational constraint to estimate the physical conditions of the molecular gas in Arp 302N as we will show in the next section.
3.3 Kinematics
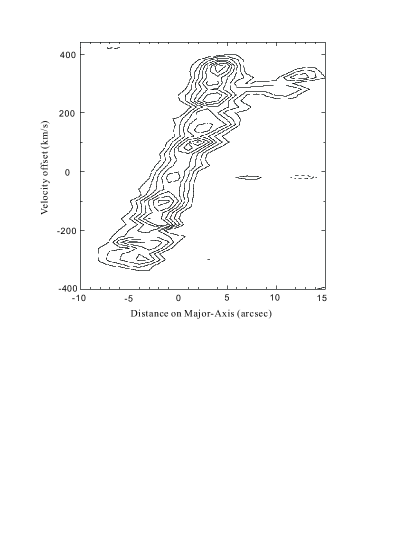
We present in Figure 3(c) the intensity-weighted velocity field as contours. A velocity field typical of normal rotation is clearly seen along the major axis within a radius of 4, i.e. 2.7 kpc. Along the minor axis, we can not detect any disturblance of the gas in the inner region. In Figure 4 we shows the position-velocity (PV) diagram of the CO J=2–1 emission along the major axis (position angle of 1∘). We note that the molecular gas exhibits a nearly constant velocity gradient (about 100 km s-1 kpc-1) within the central 6 or 4.0 kpc in linear scale. In the velocity range between 260 and 340 km s-1 there are clearly two components: one is associated with the gas at ARP302N-cm and the other component located to the northern part about 8 to 15 away from the nucleus. The gas at 3.3 (2.2 kpc) north of the nucleus shows a slightly steeper velocity gradient (about 170 km s-1 kpc-1) and the position of this feature is consistent with ARP302N-cm (the secondary 3.6 cm radio emission feature, see §3.4). The molecular gas located at large galactocentric distance toward the north shows clear deviation from solid body rotation, as can be seen in Figure 4.
Sakamoto et al. (1999) find that there is a steep rise in rotation velocity, i.e. the velocity gradient 1000 km s-1 kpc-1, in the central regions with radii of typically 0.5 kpc towards most nearby spiral galaxies. It is therefore apparent that the presence of a shallow velocity gradient over an extended region of 4.0 kpc in radius sets Arp 302N apart from normal cases. However, solid body rotation over kpc-scales is found in some special cases, such as NGC 4194 (Aalto & Hüttemeister, 2000), NGC 7479 (Laine et al., 1999), UGC 2866 (Hüttemeister et al., 1999) and NGC 891 (García-Burillo & Guélin, 1995). Usually the presence of a molecular ring or the solid body rotation in bars are evoked to explain the observed linear velocity gradient.
3.4 VLA results
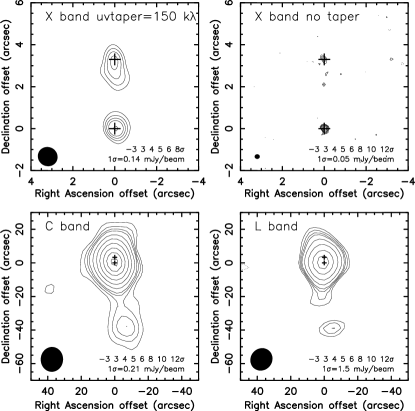
Low resolution of the images at C band (6 cm) and L band (20 cm), as shown in Figure 5, indicate that the radio emission is concentrated in the central region. There is only one central peak and the details can not be well resolved with the current poor resolutions, which are 13–14 for both observations. The integrated intensities are 30.20.4 mJy and 89.03.6 mJy for 6 cm and 20 cm respectively, yielding a spectral index, (where S ), of 0.9.
High resolution of the X band (3.6 cm) images are shown in Figure 5. 3.6 cm continuum emission is mainly contributed from two components with similar total integrated intensity. One component, associated with the galactic nucleus, is compact and marginally resolved (right top panel of Figure 5). A second component is located at 3.3 ( 2.2 kpc) north of the nucleus (ARP302N-cm hereafter) and extends from 2 to 4 away from the nucleus (left top panel of Figure 5). All the results are summarized in Table 1.
3.5 Spitzer results
In Figure 6 we show the mid infrared continuum emision from Arp 302 at 8.0 m and 24 m taken with IRAC and MIPS instruments of Spitzer. Both 8.0 m and 24 m images exhibit similar morphology to that seen in the CO J=2–1 emission. Hot dust traced by the 8.0 m and 24 m share the similar spatial distribution as the molecular gas traced by the CO J=2–1 emission. With a resolution of 7 at 24 m, ARP 302 is very well resolved. From the MIPS image we estimate the flux densities of 0.32 Jy and 0.08 Jy for ARP 302N and ARP 302S respectively. The flux densities are 5.16 Jy at 70 m and 5.08 Jy at 160 m for ARP 302N respectively. Applying the same flux ratio based on 24 m between ARP 302N and ARP 302S to the total IRAS flux densities of ARP 302, we estimate 5.32 Jy at 60 m and 11.6 Jy at 100 m for ARP 302N.
4 Discussion
4.1 Dust properties constrained by one component dust model
The dust continuum allows us to investigate the properties of the dust, such as the dust temperature and the dust mass. To model the dust emission from ARP 302N, we use the IR continuum fluxes measured by Spitzer MIPS at 70 m (5.16 Jy) and 160 m (5.08 Jy), and also by IRAS at 60 m (5.32 Jy) and 100 m (11.6 Jy) (see details in §3.5) together with the flux density of 135 mJy at 850 m reported by Dunne et al. (2000).
Assuming that the dust emission is optically thin, the flux density of the dust emission is related to the dust temperature and the dust mass by the relation: , where is the observed flux density, and are the dust and background temperature respectively, is the Planck function, is the luminosity distance of the source, is the dust mass and is the dust absorption coefficient. For the dust absorption coefficient, we adopt cm2 g-1, where is the emissivity index. We note that the emisivity index depends on the dust properties and needs to be specified beforehand. By fitting the observational measurements, we can derive the dust mass and dust temperature for each specified value of . In Figure 7, we show three fitting results with (, , Mdust) combinations: =1.0, =36 K and Mdust=2.2108 M⊙ (the best fit), =1.5, =29 K and Mdust=2.0108 M⊙ (moderate value), and =2.0, =26 K and Mdust=1.1108 M⊙ (the simple modified blackbody fit). The dust temperature ranges from 26 to 36 K for the different models. Previous two models gives a dust mass of 2.0-2.2108 M⊙, which are twice of the value from the simple modified blackbody model.
The simple modified blackbody model underestimates the 850 m flux density by 60%, which indicates that either additional cold component or modifications to the emissivity index are needed or that the optically thin assumption is inappropriate. Actually, the gas is very extended in this galaxy and should result in the similar distribution for the dust emission. The dust emission is still optically thin at 70 m even if the dust is distribuated over a region with a small radius of 1 kpc, with a dust mass of 2.0108 M⊙, thus the optically thin assumption should be correct in this galaxy. In a large survey for local galaxies by Dunne et al. (2000), the dust emissivity indexes to the best fitting models are found to be 1.30.2 and they argued that the galaxies may contain a significant amount of cold dust. For ARP 302N, an additional cold gas component with a dust mass of 1.6–2.5108 M⊙ and a dust temperature of 20-15 K can conpensate for the lower predicted flux at 850 m. This results in a total dust mass of 2.7–3.6108 M⊙ dependent on the temperature of the cold dust component.
The observed flux in CO =10 (Lo, Gao & Gruendl, 1997) is 304 Jy km s-1for ARP 302N, and the corresponding CO line luminosities are 1.61010 K km s-1 pc2. This places ARP 302 to be the most CO luminous system known in the local universe and possibly the most gas rich system. Usually, we can estimate the gas mass using a standard conversion factor, 4.8 M⊙ (K km s-1 pc2)-1 in our Galaxy, and it leads to a gas mass of 7.71010M⊙. We derived a dust mass of 2.0-3.6108 M⊙ from our dust models as above. Adopting the gas-to-dust mass ratio of 150 in our Galaxy, this yields the value of 3.0-5.41010M⊙ for the gas mass. Therefore, the gas mass estimates from the dust and the CO luminosity are comparable within their uncertainties and lead to a gas mass of 5.41010M⊙ (the mean value from two methods).
The theoretical prediction of the flux density of the continuum emission at 1.3mm is less than 42 mJy from the above dust models. The sensitivity of the continuum observation is 5 mJy beam-1, thus it is reasonable that there is no positive detection from the SMA observation if the emission is distributed over a region of over 3 beams.
4.2 Excitation condition of the gas
The excitation condition of molecular gas in ARP 302N can be studied using the CO =21/=10 line ratio. As seen in Figure 3 the line ratio peaks at either side of the center. The ratio varies significantly across the galaxy, from about 0.2 in the outer region to about 0.5 at the peaks. Assuming that the missing flux of the SMA observation is uniformly distributed, the line ratio will be 0.2 higher and the ratio will vary from 0.4 in the outer region to about 0.7 at the peaks. The overall line ratio from the single dish measurements is about 0.5. From a survey of the CO =10 and =21 lines in the inner kpc regions of a large sample of nearby spiral galaxies, Braine & Combes (1992) measured an average line ratio of 0.89, but 7 out of 35 galaxies have CO =21/=10 line ratios less than 0.6. Furthermore, the gas in the central regions tend to have high excitation temperature, which will result in the higher line ratio if the CO line emission is optically thick. The disks of NGC1808 (Aalto et al., 1994) and our Galaxy show values of 0.7 and 0.6, which are comparable to the value in the central region of ARP 302N.
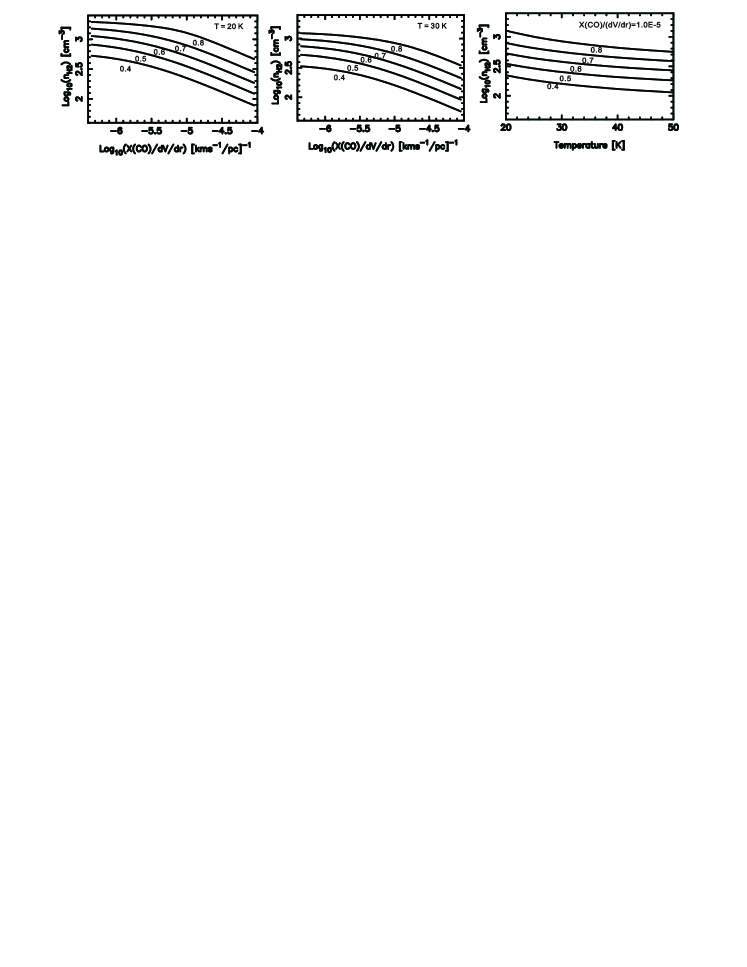
To be more quantitative, we use our molecular excitation model to constrain the physical conditions of the molecular gas. The transfer of radiation is calculated within the framework of the large velocity gradient approximation. We take into account all rotational levels of the CO molecule up J=10. We use the collisional cross sections between CO and H2 molecules from Flower & Launay (1985). The statistical equillibrium equations are solved using the Newton-Raphson method. In our molecular excitation model three parameters are required: the gas density, the kinetic temperature and the fractional abundance of the CO molecule per unit velocity gradient. At the expected low density of the molecular gas, the kinetic temperature is expected to decoupled from the dust temperature. In this case, the kinetic temperature might be as low as half of the dust temperature (Downes & Solomon, 1998). In the previous section, we estimate the dust temperature in the range of 26 to 36 K. For the excitation calculation, we adopt two representative values of 20 and 30 K. In Figure 8 (left panel) we present the dependence of CO =21/=10 line ratio on the gas density and the abundance per velocity gradient [CO]/ for kinetic temperature of 20 and 30 K. The figure shows that for the line ratio measured in ARP 302N the gas density is low, less than 103 cm-3. At this low density, the transition =21 is sub-thermally excited. Lower line ratios correspond to lower densities for a reasonable range of abundance per velocity gradient. To provide further support for this conclusion we also show the dependence of line ratio on the gas density and kinetic temperature Tkin for a fixed abundance per velocity gradient of [CO]/ = 1 10-5 pc ()-1 (right panel of Figure 8). The result suggests only a weak dependence on kinetic temperature. Our finding is very similar to the conclusion of Sakamoto et al. (1994) in that the variation in line ratio mainly reflects the variation in gas density. To set more stringent limits on the gas density and temperature would require observations of higher transitions of CO and/or its 13CO isotope.
The relatively low gas density in ARP 302N is reflected in its spatial distribution. For ULIRGs, which are in a more advanced merger phase, Downes & Solomon (1998) show that the molecular gas is more strongly concentrated in the nuclear region of the galaxy in the form of a rotating disk with size of 1 kpc or less. The estimated average gas density is higher, ranging from a few 103 to 104 cm-3. In ARP 302N, there is a large amount of molecular gas (5.41010 M⊙, see in §4.1), but this gas is distributed over a very extended galactic disk with a size of 15 kpc, resulting in lower average density. We note that the diffuse and very extended spatial distribution of molecular gas in ARP 302N is unusual among local luminous and ultralumious galaxies. However, in some cases such as in the interacting galaxy M51, the molecular gas traced by CO emission also covers all the optical disk, out to at least 12 kpc radius (Schuster et al., 2007). The origin of this distribution is currently unknown.
4.3 Star forming activity
The star formation activity can be estimated by SFE, the ratio of luminosity to molecular gas mass, of the galaxies. For ARP 302N, we estimate an infrared luminosity of 3.41011 L⊙, separating the contamination of ARP 302S in the manner described in §3.5. We can also estimate the infrared luminosity from the 24 m data with the empirical formula LIR=10 (Bell et al., 2005), yielding a luminosity of 2.7 1011 L⊙, which is comparable with our estimated IRAS luminosity. The molecular gas estimate is 5.41010 M⊙ for ARP 302N. Its SFE of 6.3 L⊙/M⊙ is slightly higher than that in our Galaxy but much lower than starburst galaxies or (U)LIRGs. The high infrared luminosity, the large amount of the gas mass and the low SFE make this galaxy peculiar.
The SFR for ARP 302N is about 40 assuming SFR = 1.1710-10 () yr-1 (Kennicutt, 1998), and thus ARP 302N can retain such a luminosity over a period of at most 2.0 yrs. The system will likely evolve into advanced merger in a timescale of several tens million yrs (Mihos & Hernquist, 1996), and may at that time become a ULIRG with a luminosity of 1.61012 even if it will lose half of its gas mass by then (given a SFE of 42 L⊙/M⊙ for the merging systems with the separation less than 5 kpc from Gao & Solomon 1999).
4.3.1 Constraint from the line ratio
As discussed in previous section, our excitation analysis suggests that the low line ratio in ARP 302N is due to the low volume density of the molecular gas. The low gas density is entirely consistent with the low SFE observed in ARP 302N, as star formation is associated with dense gas rather than just total gas mass (Gao & Solomon, 2004).
4.3.2 Radio continuum
The thermal radio emission from HII regions is identifiable by its flat spectral index with a typical value of 0.1. A spectral index of 0.9 as measured for ARP 302N implied that non-thermal emission dominates. Synchrotron emission with a spectral index of 0.9 is likely to be dominated by supernova remnants with small diameters, referred to the star forming activity in ARP 302N. From the high resolution images at 3.6 cm, the continuum emission mainly comes from the nucleus and ARP302N-cm. Therefore, the nucleus and ARP302N-cm are the regions with strong star forming activity.
4.3.3 Strong star forming activities at the nucleus and ARP302N-cm
The extended infrared emission from Spitzer 8 and 24 m data excludes the existence of a strong AGN in ARP 302N and favors the star formation origin for the large infrared luminosity in ARP 302N. Therefore it fully supports that the star formation dominates the IR emission in the galgaxy. The 3.6 cm observation shows that there is strong and extended radio continuum emission at ARP302N-cm. The Spitzer 8 and 24 m images peak at the same region, indicating that there is strong emission from the PAH and hot dust. The high resolution CO =21 image from the SMA reveals much molecular gas exists at ARP302N-cm. All of these results support that there is the asymmetrical star forming activities in the system and ARP302N-cm is the strongest active star forming region in the galaxy.
From 3.6 cm images with the different resolutions at the nuclear region, it is clear that at least 36% of the emission is not associated with the unresolved structure in the nuclear region and 64% of the emission is originated from a compact region (from the VLA 3.6 cm data, the deconvolved size is 0.230.09, i.e. 143 pc 56 pc). As a whole, the star formation is not active in ARP 302N, but there is strong star forming regions at the nucleus and ARP302N-cm.
From the previous optical spectroscopy observation (Veilleux et al., 1995), the system was classified as LINER type galaxy. Alonso-Herrero et al. (2000) claim that LINER-like optical spectra would be the consequence of the shock-heating by supernovae of the surrounding gas after a burst of star formation, as observed in NGC 5218 (Olsson et al., 2007). This scenario to explain the LINER type spectrum is consistent with our radio observation which suggests that there are many supernova explosions. Of course, we can not exclude the possible existence of a weak AGN in the center.
4.4 Comparison with other mergers
In Arp 302N the distribution and kinematics of molecular gas show no discernable disturbance. That suggests the Arp 302 system is in the early merging stage. Recently, many authors studied the molecular gas in high angular resolution to investigate the effects of the merging procedure and the star formation therein. The molecular gas is often concentrated on the overlap region or at least have another peak except for the centers of the systems with the well seperated nuclei, such as ARP 299 (Casoli et al., 1999), NGC 6090 (Wang et al., 2004) and VV 114 (Iono et al., 2004). In these cases, the starburst acitivites is prominent and the SFE is much higher than that in our Galaxies. NGC 6670 is another widely seperated merger and is well studied by Wang et al. (2001). They also found that the stars and the molecular gas do not show any clear sign of the merging process. However, the atomic gas is found to concentrate in the region in between the two galaxies, a very clear signature of the merging process. The atomic gas will be helpful to determine the merging process in ARP 302. Indeed, simulations show that the high SFRs and the SFEs arise only in the late stages of the merger and the star formation does not deplete much gas before it reaches the central regions in the mergering systems Mihos & Hernquist (1994, 1996). It is consistent with the observed enhanced SFE in the late mergers by Gao & Solomon (1999), which suggests that the fact before its final merging stage is the reason why the SFE in this LIRG is just comparable to the value in our Galaxy. The huge infrared luminosity in ARP 302N is just due to its large amount of the gas mass instead of the starburst activity.
5 Conclusion
In this paper we present the SMA observations of the CO =21 transition towards the northern galaxy, ARP 302N, of the early merging system, ARP 302, to study the physical properties of the gas. To well understand the star formation activities, the VLA data at 3.6 cm, 6.0 cm, 20 cm and the Spitzer (both IRAC and MIPS data) archive data are also shown here. Our main results are summarized as the following:
-
1.
Our high angular resolution CO =21 observation reveals the extended spatial distribution of the molecular gas in ARP 302N. We find that the molecular gas has a very asymmetric distribution with two strong concentrations on either side of the center together with a weaker one offset by about 8 kpc to the north. This spatial distribution is very similar to the morphology seen previously in the CO J=2–1 line.
-
2.
The distribution of the molecular gas is also found to be consistent with that for the PAH and the hot dust as traced by the 8 m and 24 m continuum emission observed by Spitzer.
-
3.
The line ratio CO J=2–1/1-0 shows that the line ratio varies strongly from about 0.7 near the galaxy center to 0.4 in the outer part of the galaxy. Excitation analysis suggests that the gas density is low, less than 103 cm-3, over the entire galaxy.
-
4.
By fitting the far infrared part of the SED of ARP 302N, we obtain a dust temperature in the range 26–36 K and a dust mass of Mdust=2.0–3.6108 M⊙.
-
5.
We determine the spectral index of the radio continuum to be approximately 0.9. The spatial distribution and spectral index of the radio continuum emission suggests that most of the radio continuum emission is synchrotron emission from the star forming regions at the nucleus and ARP302N-cm. The good spatial correspondance between the 3.6 cm radio continuum emission, the Spitzer 8 and 24 m data and the high resolution CO =21 observation from the SMA shows that there is the asymmetrical star forming activities in ARP 302N and ARP302N-cm is the strongest active star forming region in the galaxy.
References
- Aalto et al. (1994) Aalto, S., Booth, R. S., Black, J. H., Koribalski, B. & Wielebinski, R., 1994, A&A, 286, 365
- Aalto & Hüttemeister (2000) Aalto, S. & Hüttemeister, S., 2000, A&A, 362, 42
- Alonso-Herrero et al. (2000) Alonso-Herrero, A., Rieke, M. J., Rieke, G. H. & Shields, J. C., 2000, ApJ, 530, 688
- Barnes & Hernquist (1991) Barnes, J. E. & Hernquist, L. E., 1991, ApJ, 370, L65
- Bell et al. (2005) Bell, E. F., et al. 2005, ApJ, 625, 23
- Bergvall et al. (2003) Bergvall, N., Laurikainen, E. & Aalto, S., 2003, A&A, 405, 31
- Braine & Combes (1992) Braine, J., & Combes, F., 1992, A&A 264, 433
- Casoli et al. (1999) Casoli, F., Willaime, M.-C., Viallefond, F. & Gerin, M., 1999, A&A, 346, 663
- Downes & Solomon (1998) Downes, D. & Solomon, P. M., 1998, ApJ, 507, 615
- Dunne et al. (2000) Dunne, L., Eales, S., Edmunds, M., Ivison, R., Alexander, P. & Clements, D. L., 2000, MNRAS, 315, 115
- Fazio et al. (2004) Fazio, G. G., et al., 2004, ApJS, 154, 10
- Flower & Launay (1985) Flower, D.R., Launay, J.M., 1985, MNRAS, 214, 271
- Gao & Solomon (1999) Gao, Y. & Solomon, M., 1999, ApJ, 512, L99
- Gao & Solomon (2004) Gao, Y. & Solomon, P. M., 2004, ApJ, 606, 271
- García-Burillo & Guélin (1995) García-Burillo, S. & Guélin, M., 1995, A&A, 299, 657
- Ho, Moran & Lo (2004) Ho, P. T. P., Moran, J. M. & Lo, K. Y., 2004, ApJ, 616, L1
- Hüttemeister et al. (1999) Hüttemeister, S., Aalto, S. & Wall, W. F., 1999, A&A, 346, 45
- Iono et al. (2004) Iono, D., Ho, P. T. P., Yun, M. S., Matsushita, S., Peck, A. B. & Sakamoto, K., 2004, ApJ, 616, L63
- Kaufman et al. (2002) Kaufman, M., Sheth, K., Struck, C. et al. 2002, AJ, 123, 702
- Kennicutt (1998) Kennicutt, R. C., 1998, ARA&A, 36, 189
- Laine et al. (1999) Laine, S., Kenney, J. D. P., Yun, M. S. & Gottesman, S. T., 1999, ApJ, 511, L709
- Lo, Gao & Gruendl (1997) Lo, K. Y., Gao, Y. & Gruendl, R. A., 1997, ApJ, 475, L103
- Matsushita et al. (2004) Matsushita, S., Sakamoto, K., Kuo, Cheng-Yu et al. 2004, ApJ, 616, L55
- Mihos & Hernquist (1994) Mihos, J. C. & Hernquist, L. E., 1994, ApJ, 425, L13
- Mihos & Hernquist (1996) Mihos, J. C. & Hernquist, L. E., 1996, ApJ464, 641
- Olsson et al. (2007) Olsson, E., Aalto, S., Thomasson, M., Beswick, R. & Hüttemeister, S., 2007, A&A, 473, 389
- Sakamoto et al. (1994) Sakamoto, S., Hayashi, M., Hasegawa, T., Handa, T., & Oka, T., 1994, ApJ 425, 641
- Sakamoto et al. (1999) Sakamoto, K., Okumura, S. K., Ishizuki, S. & Scoville, N. Z., 1999, ApJ, 525, 691
- Sanders et al. (1988a) Sanders, D. B., Soifer, B. T., Elias, J. H., Madore, B. F., Matthews, K., Neugebauer, G. & Scoville, N. Z., 1988, ApJ, 325, 74
- Sanders et al. (1988b) Sanders, D. B., Soifer, B. T., Elias, J. H., Neugebauer, G. & Matthews K., 1988b, ApJ, 328, L35
- Schuster et al. (2007) Schuster, K. F., Kramer, C., Hitschfeld, M., Garcia-Burillo, S. & Mookerjea, B., 2007, A&A, 461, 143
- Solomon et al. (1997) Solomon, P. M., Downes, D., Radford, S. J. E. & Barrett, J. W., 1997, ApJ, 478, 144
- Spergel et al. (2003) Spergel, D. N., Verde, L., Peiris, H., etal. 2003, ApJS, 148, 175
- Steer et al. (1984) Steer, D. G., Dewdney, P. E. & Ito, M. R., 1984, A&A, 137, 159
- van Driel, Gao & Monnier-Ragaigne (2001) van Driel, W., Gao, Y. & Monnier-Ragaigne, D., 2001, A&A, 368, 64
- Veilleux et al. (1995) Veilleux, S., Kim, D.-C., Sanders, D. B., Mazzarella, J. M. & Soifer, B. T., 1995, ApJS, 98, 171
- Wang et al. (2004) Wang, J., Zhang, Q., Wang, Z., Ho, P. T. P., Fazio, G. G. & Wu, Y., 2004, ApJ, 616, L67
- Wang et al. (2001) Wang, W., Lo, K. Y., Gao, Y. & Gruendl, R. A., 2001, AJ, 122, 140
- Wiedner et al. (2002) Wiedner, M.C., Wilson, C.D., Harrison, A., Hills, R. E., Lay, O. P. & Carlstrom, J. E., 2002, ApJ, 581, 229
- Xilouris et al. (2004) Xilouris, E. M., Georgakakis, A. E., Misiriotis, A. & Charmandaris, V., 2004, MNRAS, 355, 57
- Zhu et al. (2003) Zhu, M., Seaquist, E. R. & Kuno, N., 2003, ApJ, 588, 243
| Data | Freq. | Line/cont. | beam size, P.A. | Image rms | IntensityaaFor VLA 3.6 cm data, the first column for the nucleus and the second column for ARP 304N-cm. |
|---|---|---|---|---|---|
| GHz | arcsec,degree | mJy beam-1 | mJybbFor the SMA result, the integrated intensity is in unit of Jy km s-1. | ||
| SMA | 222.967 | CO =21 | 3.42.5, 154o | 60ccVelocity resolution of 20 km s-1. | 38210 |
| VLA L | 1.49 | continuum | 1413, 140o | 1.6 | 89.03.6 |
| VLA C | 4.86 | continuum | 1513, 178o | 0.21 | 30.20.4 |
| VLA X (taper 150 k) | 8.44 | continuum | 0.950.90, 59o | 0.14 | 1.700.31;2.530.48 |
| VLA X (no taper) | 8.44 | continuum | 0.240.23, 87o | 0.05 | 1.080.12;0.930.22 |