Transmission in the vicinity of the Dirac point in hexagonal Photonic Crystals
Abstract
We use a scattering matrix approach to simulate the transmission through a hexagonal Photonic Crystal in the vicinity of the Dirac point. If the crystal is oriented so that the propagation direction perpendicular to the surface corresponds to the K direction, no oblique transmission is possible for a very long (infinite) structure. For a finite structure with width, W, and length, L, the length dependence of the transmission is given by . For all waves with a wavevector parallel to the surface, , described by a channel number, , must be considered. We show the transmission at the Dirac point follows the given scaling law and this scaling law is related to the behavior of the individual channels. This leads to the establishment of a criterion for the maximum length for this scaling behavior when the total transmission reaches a constant value. We also compare this scaling behavior to the results in other frequency regions.
pacs:
42.70.Qs,41.20.Jb,42.25.BsI Introduction
The simulation of two-dimensional Photonic Crystals (PC) with a hexagonal lattice has so far primarily focused on studying the band gap, either to obtain the largest possible gapMartinez et al. (2004); Cassagne et al. (1995, 1996); Plihal and Maradudin (1991); Cassagne et al. (1997); Gadot et al. (1997) or to study the impact of disorder on the width of the gapSoukoulis (2001); Ryu et al. (1999); Kaliteevski et al. (2002); Lidorikis et al. (2000) or wave-guiding properties in such crystals.Gerace and Andreani (2004) The transmission in the band regions was used to characterize experimental samplesvon Freymann et al. (2003) or for studies of negative refraction.Notomi (2000); Foteinopoulou and Soukoulis (2003); Berrier et al. (2004); Guven et al. (2004); Parimi et al. (2004); Moussa et al. (2005); Gajić et al. (2006) For a general overview see review by Busch et al. and references therein.Busch et al. (2007)
Recently, Raghu and Haldane pointed out that the K-point in the band-structure can also be seen as the optical analogue to the Dirac point in graphene.Raghu and Haldane (2006); Haldane and Raghu (2005) At these points the band-structure exhibits a conical singularity with a linear dispersion relation, as it occurs in the Dirac equation. This offers the possibility to discuss many interesting effects of this dispersion predicted in the electronic case for graphene,Geim and Novoselov (2007); Katsnelson (2007) such as changes in the conductance fluctuationsRycerz et al. (2007) and enhanced transmittance in the disordered caseOstrovsky et al. (2007); Tworzydlo et al. (2006) in a non-interacting photonic system.
Around the Dirac point, a pseudo-diffusive transmission behavior characterized by a scaling of the transmission proportional to W/L with the width, W, and length, L, of the PC was predicted.Sepkhanov et al. (2007) This result was obtained in an analytic approach by discretizing the incoming modes into channels with a spacing of the wavevector parallel to the surface, , by = and by using current conservation and symmetry relation in a transfer matrix approach analog to a calculation for graphene.Katsnelson (2006); Tworzydlo et al. (2006) Numerical studies, using the multiple-scattering Korringa-Kohn-Rostocker methodZhang (2007) or finite difference time-domainSepkhanov and Beenakker (2007) confirmed the results. However, in both numerical approaches, only short crystals and only a small number of lengths have been studied and the behavior of individual channels has been ignored as well.
In this paper, we investigate the contribution of these channels and show there is also a width-dependent upper length limit for the W/L scaling for long crystals associated with the complete suppression of all channels except the one with =. This behavior is very important in understanding the predicted enhancement of transmittance at the Dirac point in disordered Photonic Crystals.Sepkhanov et al. (2007)
We use our own implementation of a Fourier-Modal method with a scattering matrix approach, also known as Rigorous-Coupled Wave Analysis (RCWA),Moharam and Gaylord (1981); Whittaker and Culshaw (1999) which allows us to simulate crystals of arbitrary length, L, and to determine the limit on not discussed in previous publications. Special care is taken of the correct Fourier-factorization rules to ensure a fast convergence.Li (1996, 1997); Sheng and He (2002) This approach assumes incoming plane waves, defined by a dimensionless frequency == and the angle to the surface normal (Fig. 1) onto a periodic structure with lattice constant .

The transmittance, T, for one frequency-angle pair through the structure is calculated by summing over all propagating diffraction orders and adding up the magnitude of their Poynting vectors. The same holds for the reflectance, R, and the sum of both is tested to be equal to unity. In the studied case the finite width is incorporated by the superposition of 2+1 planes waves with different corresponding to the channels discussed above. Each channel with number is associated with a = and an angle to the surface normal given by = with =. The maximum/minimum parallel component of the wavevector is then given by . For crystals with a length , the summed transmission of all channels, , is supposed to be independent of . For this approach to be valid, a wide and short crystal must be assumed, so that the details of the edges become less important.Sepkhanov et al. (2007)
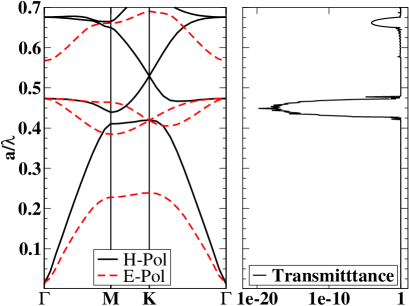
As a model system, we use cylinders (=, =) in air (=) on a hexagonal lattice. The crystal orientation is chosen, so a plane wave at perpendicular incidence propagates along the K direction, for which the Dirac point occurs in H-polarization (magnetic field parallel to the cylinders). The corresponding band-structure, together with the transmittance for H-polarization in the K direction corresponding to =, is shown in Fig. 2. The Dirac point occurs at = in the band-structure.
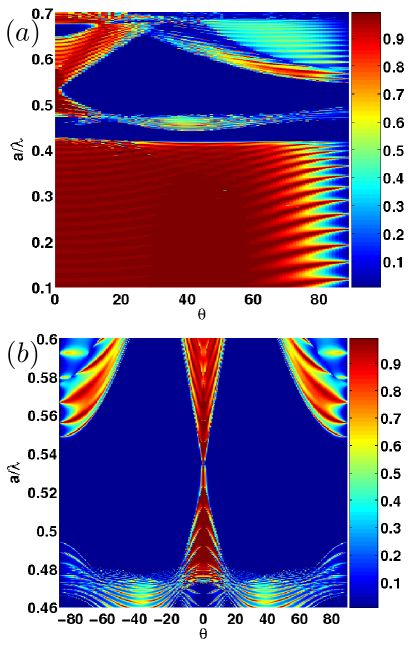
The dependence of the transmittance (sum over all propagating diffraction orders) on the angle and frequency of the incident wave is shown in Fig. 3 for a spacing of =. The features of the band-structure, such as the stop band (), and the pseudo-stop band around () can be identified. Figure 3b enlarges the region around the Dirac point for positive and negative angles. From the smallest width of the conical shaped transmittance, the Dirac point can be estimated around . However, resonances, due to the finite size, make a very precise determination more difficult and a better way will be discussed later. In this case higher order diffraction orders do not contribute significantly to the total transmittance. This is in contrast to the reflectance (not shown) where for angles larger than 10– most energy is transferred in the diffraction order, depending upon whether the angle on the incoming wave is positive () or negative (). It should be noted, in these plots individual angles cannot be assigned a channel number, since the spacing is not equidistant in .
Due to linear dispersion relation around the Dirac point, the phase of a plane wave with perpendicular incidence (in K-direction) changes linearly with frequency, if phase changes at the surfaces of the crystal are constant for all considered frequencies. The phase change in the transmittance calculation, , in a given frequency interval , is then equal to the product of the length times the change of the wavevector in the band-structure in the same frequency interval (). Although not shown, our numerical results exhibit this behavior extremely well. The absolute phase can only be determined up to an arbitrary but constant shift. As will be shown later, a precise determination of the Dirac frequency is essential. However, since the band-structure and transmittance are calculated by different methods, a small difference in the Dirac frequency is found and the exact frequency for the transmittance calculations must be determined within the RCWA method.
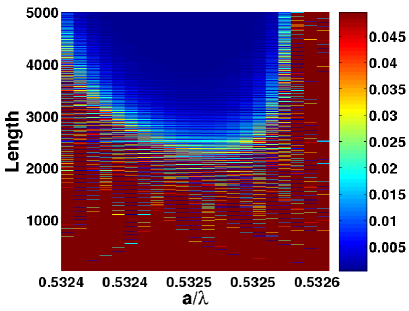
This is possible by looking at the transmittance for a fixed , preferably close to zero, and choosing the frequency for which this transmittance becomes the smallest for long structures. At the Dirac point only the component propagates in long structures. In Fig. 4 the length-dependent transmittance is plotted for different frequencies for = corresponding to the channel with a width of W = 5000. We determine the frequency for the Dirac point to be = for modes in the RCWA transmittance calculations. Although the transmittance typically converges better than with these numbers of modes, small shifts in the frequencies still occur. Using only modes instead of changes the optimal value for the Dirac frequency to 0.5318, corresponding to a shift of . As a comparison, the difference in the value from the band-structure (0.5294) corresponds to a difference of . It is visible from Fig. 4 that the frequency must be determined precisely for large widths. A change in of 0.0002 can turn the channel from non-propagating to propagating, changing the scaling behavior significantly. In the band-structure, this would correspond to going away from the Dirac point into the conical region, where a larger range of is available.
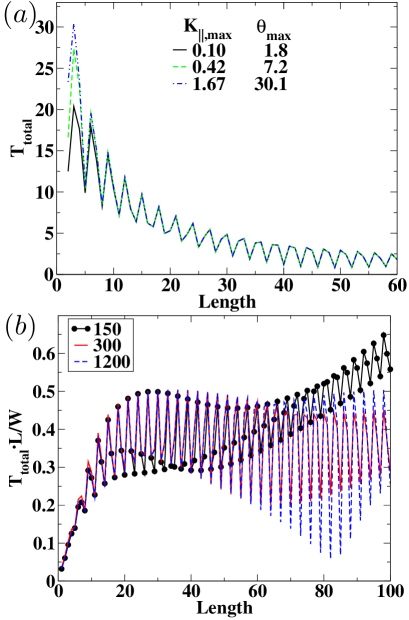
Using the determined Dirac frequency, we calculate the length- and width-dependence of the transmittance (Fig. 5a). For a fixed width of =, we use a different number of channels corresponding to different . Using more channels increases the transmittance for short crystals, but, since channels with a large decay rapidly, the total transmittance becomes independent of this quantity after a length of approximately .Sepkhanov et al. (2007)
According to the proposed scaling law, multiplying the total transmittance by a factor leads to a constant value.Sepkhanov et al. (2007) Our results in Fig. 5b are not constant but oscillate around a value of approximately 0.36, slightly higher than the predicted value of .Sepkhanov et al. (2007) The oscillations in the transmittance, which depend on the length and surface termination of the crystal, are Fabry-Perot resonances caused by the finite length. They do not exhibit a smooth curve since the sampling can only be completed in length steps of 1 unit cell and individual Fabry-Perot oscillations are not resolved. They can be resolved by fixing the length and varying the frequency in very small steps. Another deviation from the constant value can be seen in the curve for a width of 150 unit cells (curve with solid circles). For this width, a linear increase in the normalized transmittance is visible, starting at a length of 40 unit cells. For structures longer than this width, only the channel contributes to transmittance with a constant value. The linear dependence of TL/W is then caused by the multiplication of T with the length of the sample.
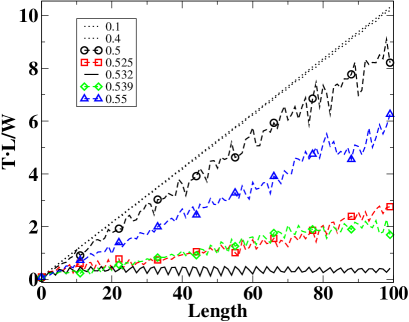
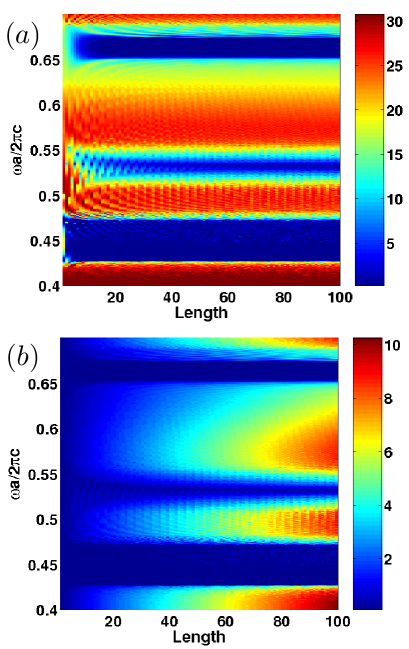
For different frequencies, we can identify several different characteristic behaviors for normalized transmittance (Fig. 6). At low frequencies in the first band (=), normalized transmittance is given by a straight line with the same slope for all frequencies, since all channels are contributing with a transmittance of about 100%. The total transmittance then corresponds to the number of channels. In the second band, the transmittance still grows linearly with different slopes, but oscillates around an average value. In this case, some of the channels are contributing and the total number of contributing channels determines the slope. At the Dirac point, a value around 0.36 is obtained as discussed before. The final regime is the stop band (not shown in the plot), where the normalized transmittance is always close to zero and decaying, since the effect due to the exponential decay is stronger than the increase caused by multiplication with the length. In all examples the maximum angle and the number of channels are fixed. The four different regimes are also visible in Fig. 8, which shows the total transmittance (a) and the normalized transmittance (b) for a wide range of frequencies over length.
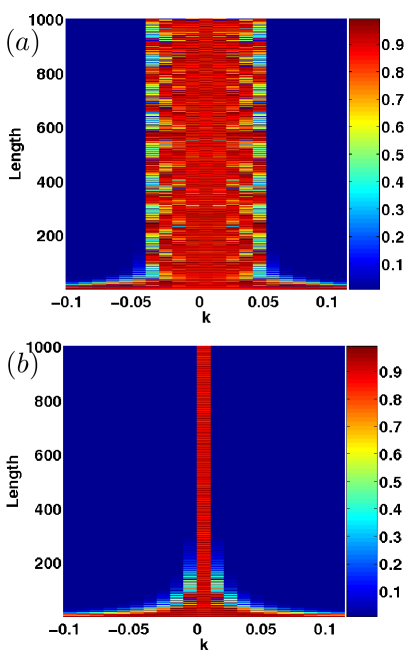
A better understanding for the occurrence of these 4 regimes can be obtained by looking at the length-dependent transmittance of the individual channels for two example frequencies in Fig. 8. Firstly, we consider a frequency close to the Dirac point (Fig. 8a). For short crystals up to about 100 unit cells, the number of propagating channels decreases and for longer structures, nine channels contribute with a large transmittance. The rescaled transmittance is TL/W. Hence, it increases linearly for a length exceeding 100 unit cells. At the Dirac point (Fig. 8b), all but the channel are suppressed for long structures. In the region up to a length of about 250 unit cells, the suggested scaling behavior is observed. Again, for longer structures TL/W will increase linearly, due to the constant transmittance of the channel comparable to the black curve with solid dots in Fig. 5b.
Previously, it has been stated that the scaling of the transmittance is valid for lengths larger than in the limit of . As discussed before, there also exists an upper limit for the length for this scaling behavior, which has not been addressed in previous publications. We determined this long length limit by comparing the channel to the one. All channels with decay exponentially at the Dirac point, since there are no propagating states available in the band-structure similar to the case in the gap. The propagating channels always contribute with a transmittance of approximate unity, so ignoring the details of the transmittance caused by the Fabry-Perot oscillations, we can express the total transmittance of all channels by
| (1) |
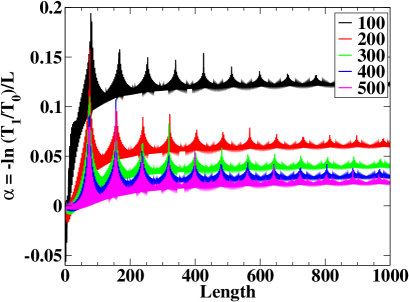
with T on the order of 1. Since the and higher channels do not contribute significantly, we can define the relative damping of the channel with respect to the as , plotted for different widths in Fig. 9. As long as the transmittance in the channel decays, the damping constant increases until it saturates and becomes constant.
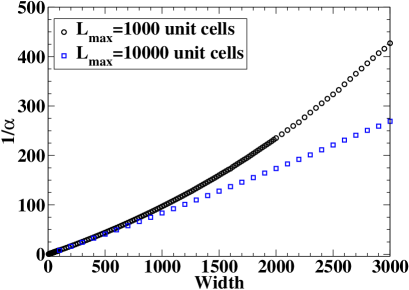
To determine the maximum length for the 1/L scaling of the transmittance, the inverse of the damping constant, given by the length for a suppression is , can be used as a quantitative measure. This damping length is obtained by averaging the (length-dependent) damping constant, once it has reached a constant value and then inverting the average. The averaging procedure is required to reduce the impact of the Fabry-Perot resonances.
The results of this averaging are shown in Fig. 10 and exhibit a linear behavior. For crystals with a very wide width, the saturated value is only reached for very long lengths. Not using sufficiently long structures leads to a damping constant, which is still increasing; hence, to an overestimation of the damping length and a deviation from the linear behavior. From a linear fit, the slope can be obtained as 0.095, which gives a width to length ratio of about 10:1, meaning the length limit of the W/L scaling of the transmittance is reached at about 1/10 of the width. Identification of the upper limit is important, if one wants to study disordered systems. In this case, the Dirac point may be shifted locally; hence, propagating modes are available in regions where no modes were available before. Consequently, this can lead to an enhanced transmittance in the vicinity of the Dirac point. If the channels with are suppressed less compared to channel in the disordered case than in the unperturbed structure, this will lead to a significant change in the damping length, even if all channels experience changed due to disorder. Studying these quantities allows a better understanding of the transmittance around the Dirac point in the case of disorder and offers the possibility to discuss the open question whether disorder will increase or decrease the transmittance in this region.Sepkhanov et al. (2007)
In conclusion, we have presented detailed numerical calculations of the transmittance in hexagonal two-dimensional Photonic Crystals close to the Dirac point. We found the transmittance at the Dirac point is inversely proportional to the thickness of the sample. A detailed dependence of this behavior on the individual channels is given. We give an explanation and a criterion for an upper length limit of this behavior and relate it to the width of the crystal. The dependence of the transmittance away from the Dirac point is also examined. It was determined that the transmittance decays exponentially as expected when the frequency lies in the gap. When the frequency lies in the band, not only the = component is contributing to the transmittance for all lengths. The number of contributing channels depends on the width and the distance from the Dirac point frequency.
Acknowledgements.
M.D. gratefully acknowledges financial support from the Alexander-von-Humboldt Foundation (Feodor-Lynen Program). Work at Ames Laboratory was supported by the Department of Energy (Basic Energy Sciences) under contract No. DE-AC02-07CH11358. This work was partially supported by the office of Naval Research (Award No. N00014-07-1-0359)References
- Martinez et al. (2004) L. Martinez, A. Garcia-Martin, and P. Postigo, Opt. Express 12, 5684 (2004).
- Cassagne et al. (1995) D. Cassagne, C. Jouanin, and D. Bertho, Phys. Rev. B 52, R2217 (1995).
- Cassagne et al. (1996) D. Cassagne, C. Jouanin, and D. Bertho, Phys. Rev. B 53, 7134 (1996).
- Plihal and Maradudin (1991) M. Plihal and A. A. Maradudin, Phys. Rev. B 44, 8565 (1991).
- Cassagne et al. (1997) D. Cassagne, C. Jouanin, and D. Bertho, Appl. Phys. Lett. 70, 289 (1997).
- Gadot et al. (1997) F. Gadot, A. Chelnokov, A. D. Lustrac, P. Crozat, J.-M. Lourtioz, D. Cassagne, and C. Jouanin, Appl. Phys. Lett. 71, 1780 (1997).
- Soukoulis (2001) C. M. Soukoulis, ed., Photonic Crystals and Light Localization in the 21st Century, vol. 563 of NATO Science Series C (Kluwer Academic, Dordrecht, The Netherlands, 2001).
- Ryu et al. (1999) H.-Y. Ryu, J.-K. Hwang, and Y.-H. Lee, Phys. Rev. B 59, 5463 (1999).
- Kaliteevski et al. (2002) M. A. Kaliteevski, J. M. Martinez, D. Cassagne, and J. P. Albert, Phys. Rev. B 66, 113101 (2002).
- Lidorikis et al. (2000) E. Lidorikis, M. M. Sigalas, E. N. Economou, and C. M. Soukoulis, Phys. Rev. B 61, 13458 (2000).
- Gerace and Andreani (2004) D. Gerace and L. C. Andreani, Opt. Lett. 29, 1897 (2004).
- von Freymann et al. (2003) G. von Freymann, W. Koch, D. C. Meisel, M. Wegener, M. Diem, A. Garcia-Martin, S. Pereira, K. Busch, J. Schilling, R. B. Wehrspohn, et al., Appl. Phys. Lett. 83, 614 (2003).
- Notomi (2000) M. Notomi, Phys. Rev. B 62, 10696 (2000).
- Foteinopoulou and Soukoulis (2003) S. Foteinopoulou and C. M. Soukoulis, Phys. Rev. B 67, 235107 (2003).
- Berrier et al. (2004) A. Berrier, M. Mulot, M. Swillo, M. Qiu, L. Thylén, A. Talneau, and S. Anand, Phys. Rev. Lett. 93, 073902 (2004).
- Guven et al. (2004) K. Guven, K. Aydin, K. B. Alici, C. M. Soukoulis, and E. Ozbay, Phys. Rev. B 70, 205125 (2004).
- Parimi et al. (2004) P. V. Parimi, W. T. Lu, P. Vodo, J. Sokoloff, J. S. Derov, and S. Sridhar, Phys. Rev. Lett. 92, 127401 (2004).
- Moussa et al. (2005) R. Moussa, S. Foteinopoulou, L. Zhang, G. Tuttle, K. Guven, E. Ozbay, and C. M. Soukoulis, Phys. Rev. B 71, 085106 (2005).
- Gajić et al. (2006) R. Gajić, R. Meisels, F. Kuchar, and K. Hingerl, Phys. Rev. B 73, 165310 (2006).
- Busch et al. (2007) K. Busch, G. von Freymann, S. Linden, S. Mingaleev, L. Tkeshelashvili, and M. Wegener, Physics Reports 444, 101 (2007).
- Raghu and Haldane (2006) S. Raghu and F. D. M. Haldane (2006), eprint arXiv:cond-mat/0602501.
- Haldane and Raghu (2005) F. D. M. Haldane and S. Raghu (2005), eprint arXiv:cond-mat/0503588.
- Geim and Novoselov (2007) A. K. Geim and K. S. Novoselov, Nature Materials 6, 183 (2007).
- Katsnelson (2007) M. I. Katsnelson, Materials Today 10, 20 (2007).
- Rycerz et al. (2007) A. Rycerz, J. Tworzydlo, and C. W. J. Beenakker, Europhys. Lett. 79, 57003 (2007).
- Ostrovsky et al. (2007) P. M. Ostrovsky, I. V. Gornyi, and A. D. Mirlin, Phys. Rev. Lett. 98, 256801 (2007).
- Tworzydlo et al. (2006) J. Tworzydlo, B. Trauzettel, M. Titov, A. Rycerz, and C. W. J. Beenakker, Phys. Rev. Lett. 96, 246802 (2006).
- Sepkhanov et al. (2007) R. A. Sepkhanov, Y. B. Bazaliy, and C. W. J. Beenakker, Phys. Rev. A 75, 063813 (2007).
- Katsnelson (2006) M. I. Katsnelson, Eur. Phys. J. B 51, 157 (2006).
- Zhang (2007) X. Zhang (2007), eprint arXiv.org/0710.0682.
- Sepkhanov and Beenakker (2007) R. A. Sepkhanov and C. W. J. Beenakker (2007), eprint arXiv.org/0712.1158v2.
- Moharam and Gaylord (1981) G. G. Moharam and T. K. Gaylord, J. Opt. Soc. Am. 71, 811 (1981).
- Whittaker and Culshaw (1999) D. M. Whittaker and I. S. Culshaw, Phys. Rev. B 60, 2610 (1999).
- Li (1996) L. Li, J. Opt. Soc. Am. A (1996).
- Li (1997) L. Li, J. Opt. Soc. Am. A 14, 2758 (1997).
- Sheng and He (2002) L. Sheng and S. He, J. Opt. Soc. Am. A 19, 1021 (2002).