Where can we really find the First Stars’ Remnants today?
Abstract
A number of recent numerical investigations concluded that the remnants of rare structures formed at very high redshift, such as the very first stars and bright redshift QSOs, are preferentially located at the center of the most massive galaxy clusters at redshift . In this paper we readdress this question using a combination of cosmological simulations of structure formation and extended Press-Schechter formalism and we show that the typical remnants of Population III stars are instead more likely to be found in a group environment, that is in dark matter halos of mass . Similarly, the descendants of the brightest QSOs are expected to be in medium-sized clusters (mass of a few ), rather than in the most massive superclusters () found within the typical 1 Gpc3 cosmic volume where a bright QSO lives. The origin of past claims that the most massive clusters preferentially host these remnants is rooted in the numerical method used to initialize their numerical simulations: Only a small region of the cosmological volume of interest was simulated with sufficient resolution to identify low-mass halos at early times, and this region was chosen to host the most massive halo in the cosmological volume at late times. The conclusion that the earliest structures formed in the entire cosmological volume evolve into the most massive halo at late times was thus arrived at by construction. We demonstrate that, to the contrary, the first structures to form in a cosmological region evolve into relatively typical objects at later times. We propose alternative numerical methods for simulating the earliest structures in cosmological volumes.
1 Introduction
Rare dark matter halos at high redshifts host interesting astrophysical objects, especially before or at the end of the reionization epoch. One example is given by the very first Population III (PopIII) stars formed in the universe at , which started the metal enrichment of the interstellar medium and the reionization process (Abel et al., 2002; Santos et al., 2002; Bromm & Larson, 2004; Naoz et al., 2006), and possibly also produced intermediate mass black hole seeds that grow to become super-massive black holes () within the first billion year after the Big Bang (Volonteri et al., 2003). Another example are bright QSOs (Fan et al., 2004), considered to be hosted in the most massive dark matter halos at that time (Springel et al., 2005). The luminosity of such an object is powered through accretion onto a supermassive black hole (e.g. see Hopkins et al., 2005), which may be the descendant of one of the first generation of PopIII stars formed in the universe, at (Madau & Rees 2001; see also Trenti & Stiavelli 2007).
Many numerical and theoretical investigations have aimed at characterizing the properties of both PopIII stars (e.g. see Abel et al., 2002; Bromm & Larson, 2004; Ciardi & Ferrara, 2005; Reed et al., 2005; Gao et al., 2005; O’Shea & Norman, 2007) and of high redshift QSOs (e.g. see Hopkins et al., 2005; Springel et al., 2005; Di Matteo et al., 2005; Li et al., 2007). However, the rarity of these structures makes a fully self-consistent treatment even of the formation of the underlying dark matter halos typically outside the current capabilities of a standard cosmological simulation, as the dynamic range that needs to be resolved is too large. The main limitation at high mass resolution is the box size, : The enforcement of periodic boundary conditions limits the power spectrum of density fluctuations to modes with wavelengths shorter than . This results in a severe bias on the measured number density of rare, massive halos, especially before the epoch of the reionization of the universe when the abundance of galaxies derived from numerical simulations can be underestimated by up to an order of magnitude (Barkana & Loeb, 2004). While the number density of rare objects can be estimated in the context of Press-Schechter-type modeling (Lacey & Cole, 1993; Mo & White, 1996; Sheth & Tormen, 1999; Barkana & Loeb, 2004), studying the details of the formation histories of the first galaxies and QSOs, possibly including hydrodynamics and radiative feedback processes, requires high-resolution numerical simulation.
Thus, given a simulation box that is large enough to contain one or more of the high-redshift halos of interest, the problem is to identify a sub-region that contains one of them for high-resolution simulation. In passing we note that this challenge is different from that of developing a simulation code that is able to adaptively increase the resolution when following the gas collapse that leads to the formation of the first stars. This has been successfully implemented with adaptive mesh refinement codes (for example ENZO - Bryan & Norman 1998). Gao et al. (2005) proposed a method to identify rare structures formed at very high redshift by recursively resimulating successively smaller, nested, sub-regions of a simulation box at progressively higher resolutions. Specifically, their method resimulates the region of the box centered on the most massive dark matter halo, reidentified at higher redshift and lower mass within the sub-region at each resimulation step, until the desired resolution is achieved in a small fraction of the entire simulation box. This procedure is well-motivated by the fact that number density of massive halos is increased in regions of large-scale over-density (Barkana & Loeb, 2004), and thus structure formation in the sub-region on small scales at early times is accelerated by sitting at the top of an over-density, an over-density that is known to exist because it collapsed into the massive halo identified in the previous resimulation step. The Gao et al. (2005) method extends high-resolution resimulation techniques used previously (e.g. see Navarro & White, 1994; White & Springel, 2000), and has been used recently by several authors to study the first stars and QSOs (Gao et al., 2005; Reed et al., 2005; Gao et al., 2007; Li et al., 2007).
The recursive resimulation method for volume selection is very effective at identifying a region with a very high-redshift halo when compared to random selection of a region of equal volume within the parent simulation box, but still it does not lead to the rarest high-redshift halos in the volume. This is due to the stochastic nature of the formation and growth of dark matter halos (e.g. see Press & Schechter, 1974; Bond et al., 1991; Sheth & Tormen, 1999). The most massive dark matter halo in a given volume at some early time does not in general evolve into the most massive halo at a later time. The probability of the most massive halo to evolve into the most massive halo, quantified following Lacey & Cole (1993), decreases as time passes and the characteristic mass scale increases. As we demonstrate, the probability falls far below unity for the evolution of the first stars and QSOs to the present time. The stochastic nature of growth histories of dark matter halos is addressed and discussed in Gao et al. (2005), but unfortunately some of the subsequent studies using their method do not take into account this stochasticity and assume a very strong correlation between the location of the richest clusters at and that of rare halos at very high redshift.
In this paper we clarify this issue by presenting some basic, but often overlooked, results of Gaussian random fields in extended Press-Schechter theory to quantify the locations at later times of the first dark matter halos to form in a simulation box. We compare these analytical and numerical results to those published using recursive resimulation and highlight the benefits and limitations of that method. In addition, we propose an alternative method, based on analysis of the density field in the initial conditions, to select the sub-region of a simulation box that contains some of the earliest structure in the box without being biased toward the regions hosting the largest halos at . The paper is organized as follows. In Sec. 2 we investigate where the descendants of QSOs are today, while in Sec. 3 we extend the result to the first Population III stars in the Universe. In Sec. 4 we discuss the implications of our results for the recursive mesh refinement method and propose a viable alternative. Sec. 5 summarizes and concludes.
2 Bright QSOs: where are they today?
As a first step toward characterizing the assembly history of rare, massive, dark matter halos, we consider the link between QSOs (considered to be hosted in the largest protoclusters at that time, e.g. see Springel et al. 2005) and the largest clusters at . For this we use the publicly available merger trees constructed upon the Millennium Run (Springel et al., 2005; Lemson, 2006). This cosmological simulation has more than dark matter particles within a volume of and has been run using a concordance cosmology based on WMAP year 1 results (Spergel et al., 2003)111Note that a change in the cosmological parameters, and in particular on the value of , the root mean squared mass fluctuation in a sphere of radius extrapolated to using linear theory, does influence the details of our results, such as the expected mass of a QSO host halo, but not the essence of the relation between dark matter halos at different redshifts..
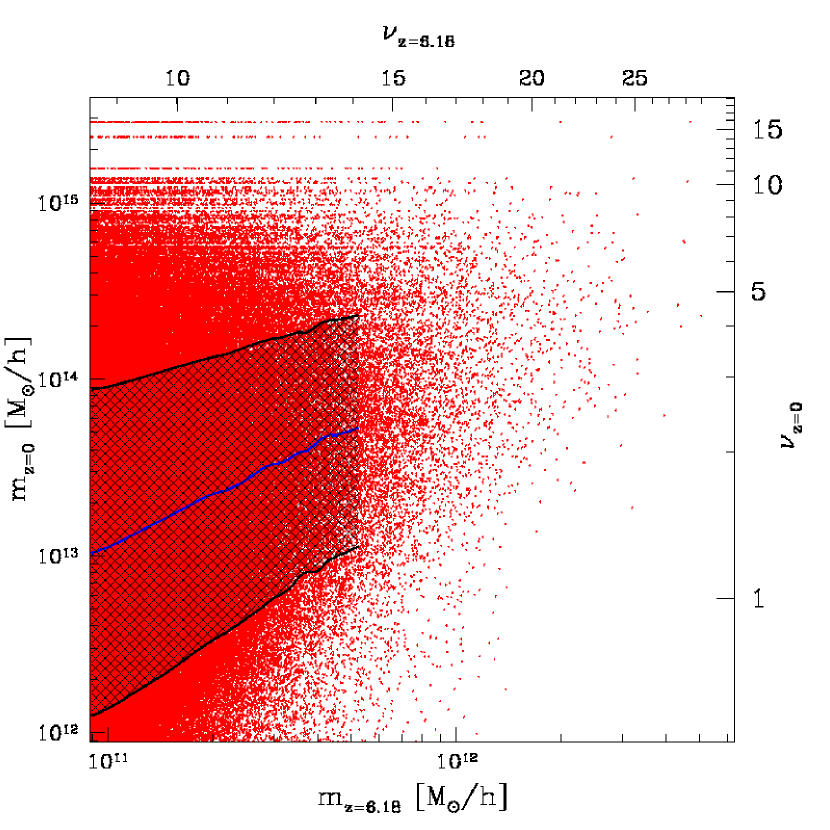
From the Millennium Catalog222http://www.mpa-garching.mpg.de/millennium we select all dark matter halos with more than particles (corresponding to a minimum halo mass of ) in the snapshot and all halos with more than particles in the snapshot. Within these catalogs we also identify the descendants at of the halos and plot them in Fig. 1. The figure immediately shows that the descendants of the most massive halos at live in a variety of environments at . Some of the most massive halos at have accreted relatively little mass by (a factor of a few of their initial mass), while others have increased their masses by more than hundred times, reaching . The scatter is substantial. In particular the descendant of the most massive halo in this simulation has a mass of only at , to be compared with the largest cluster in the box, which has . Fig. 1 also quantifies the relation between progenitor and descendant halos in terms of the dimensionless variable used in extended Press-Schechter modeling. Here is the variance of density fluctuations over a scale that contains a mass and is the critical value of an overdensity in linear theory at redshift .
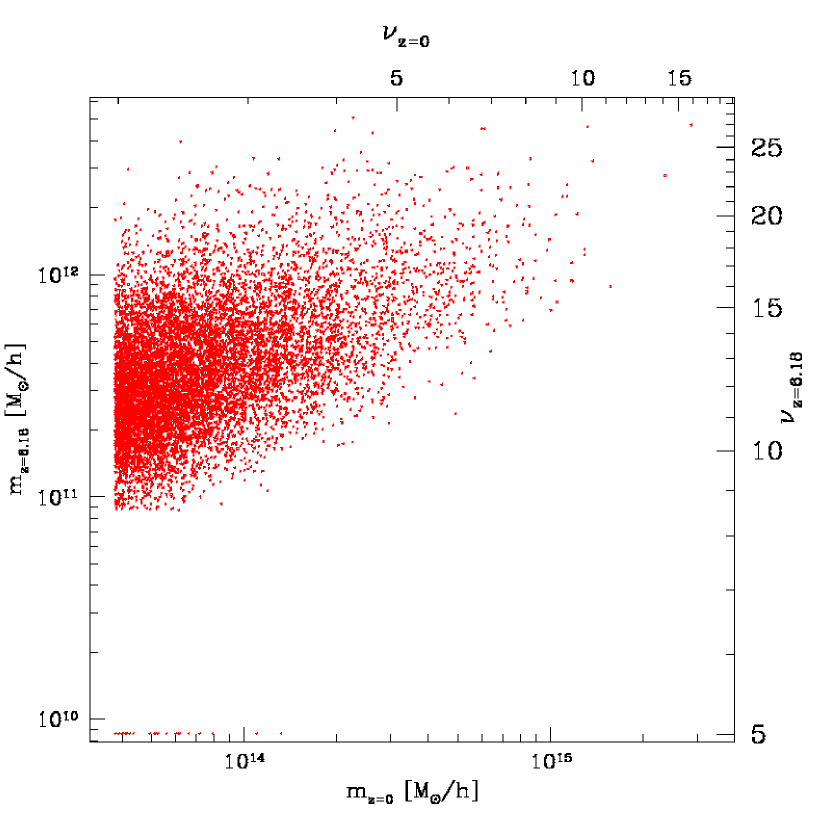
A complementary picture is given by considering the mass distribution of the most massive progenitor for the largest halos, that is with a mass (Fig. 2). Again a considerable scatter is present in the plot, with only a modest correlation between descendant and progenitor mass. These results reflect the fact that there are additional contributions to the density fluctuation power spectrum over a scale compared to a scale . This can be also illustrated by random walks generated using a power spectrum (see Fig. 3). The typical fluctuations at small scales greatly exceed those at large scale, so that a walk with excess power at small scales often has a rather typical amplitude at large scales, and vice versa.
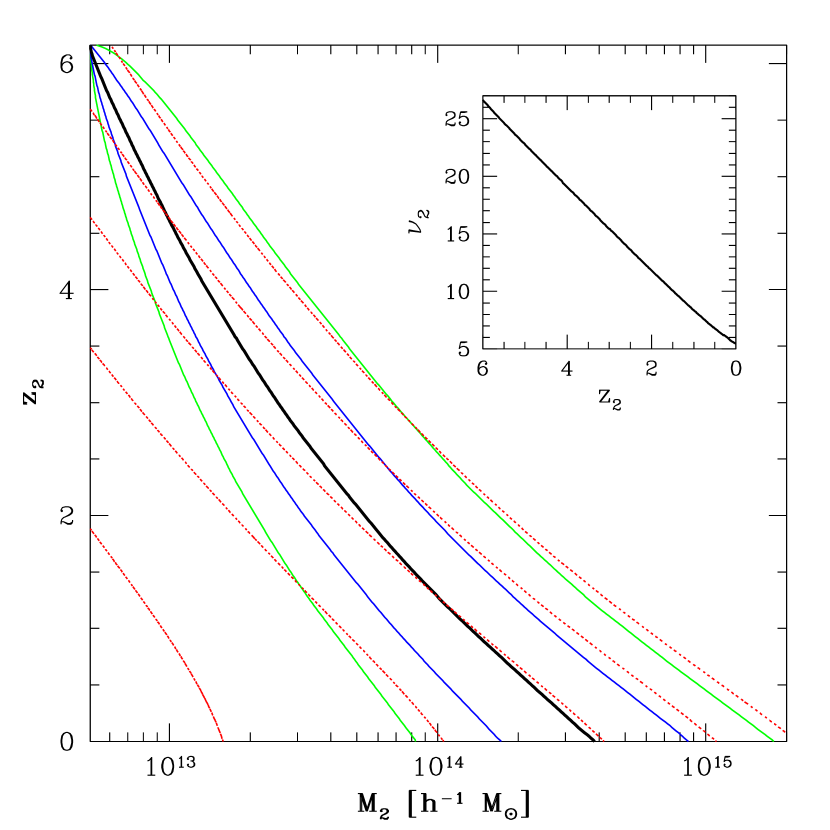
A quantitative model for this behavior is available in the context of extended Press-Schechter theory, for example by Eqs. 2.15 and 2.16 in Lacey & Cole (1993). Using this formalism one can compute the probability that a dark matter halo of mass at redshift evolves into a halo of mass at []. This is shown in Fig. 4, where we plot the contour lines of for a halo at . The median of the distribution at is and at the 68% confidence level interval is . In this respect the Millennium Run is typical as it lies within the interval. From Fig. 4 one can also immediately see that it is relatively improbable for the descendant of the most massive halo at to be the most massive halo at . In fact there is only a probability that the mass of the descendant halo is above . The Millennium Run has a volume large enough to contain halos more massive than (in fact there are two of them), thus it is expected that in less than of Millennium-like realizations the most massive halo is the progenitor of the most massive halo. As a reference we provide the number density contours from the Sheth & Tormen (1999) mass function, integrated to obtain the number of objects above that mass at that redshift in the volume of the Millennium Run (red dotted lines in Fig. 4): when , the upper 2 confidence level contour lies at a lower mass than the contour for the number density () associated with the most massive dark matter halo in the volume. This mean that the typical mass of the descendants progressively shifts toward that of more common halos as the redshift decreases, as it is also immediately visible when looking at the redshift evolution of the value of for the median descendant, which decreases progressively (small panel of fig. 4).
3 The very first PopIII stars: where are they today?
A similar scenario holds for the relation between the location of the very first PopIII stars, formed in dark matter halos with at , and that of dark matter halos at . Here there is even less correlation than in the case of QSO halos (see Sec. 2) because the halo mass dynamic range involved is larger and thus there is an additional contribution to the scatter from modes at small scales in the density fluctuation power spectrum. Using a simulation volume of , Trenti & Stiavelli (2007) showed that the remnants of the very first PopIII stars formed in dark matter halos of mass at end up at in dark matter halos with a median mass of , about two order of magnitude smaller than the largest halo in the simulation box. Here we confirm and extend their result using extended Press-Schechter modeling.
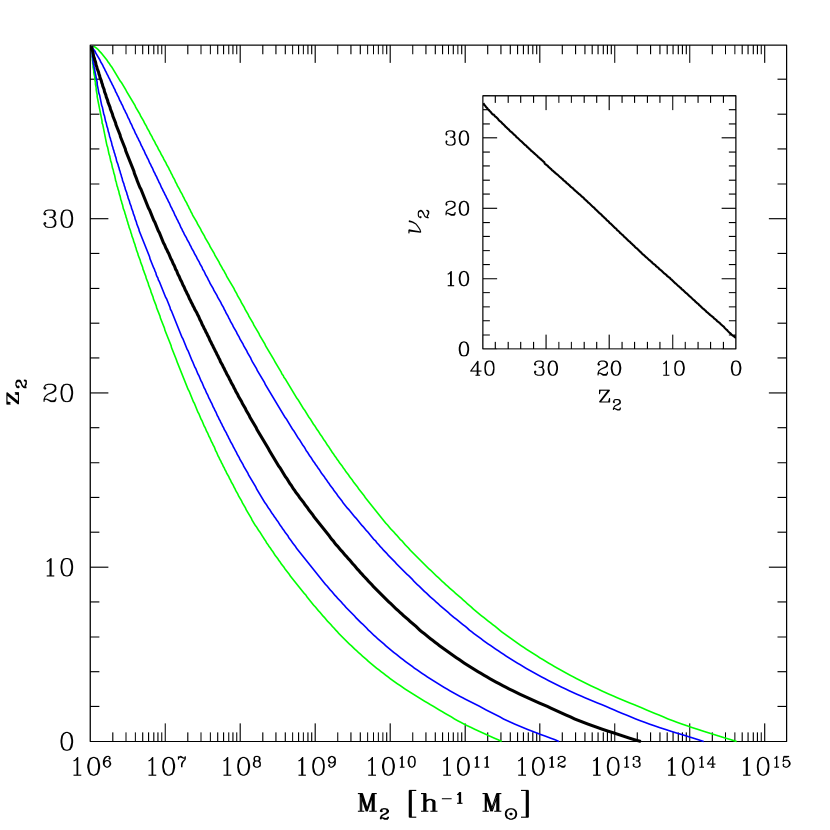
Using Eq. 2.15 and 2.16 of Lacey & Cole (1993), we compute at different redshifts the probability distribution for the mass of the descendant of a dark matter halo formed at . The results are shown in Fig. 5, where we plot the median descendant mass versus the redshift (black line), the confidence level contours (blue lines) and confidence level contours (green lines). These analytic results agree well with the numerical simulations in Trenti & Stiavelli (2007) and confirm that at the typical remnant of one of the very first PopIII halos does not live in a supercluster, but is rather hiding in a more common group environment. This is, e.g., contrary to the conclusions ( “The very oldest stars should be found today in the central regions of rich galaxy clusters”) that White & Springel (2000) drew from the resimulation of a massive galaxy cluster. Similarly, at the remnant of a typical PopIII star does not live in the largest dark matter halos of that time, but rather has seeded a dark matter halo of mass , typical for the faint galaxies observed in deep surveys such as the Hubble Space Telescope Ultra Deep Field (Trenti & Stiavelli, 2008).
These results have been obtained for very rare PopIII stars formed at . Extended Press-Schechter modeling predicts that the remnants of more common PopIII stars formed at lower redshift live in yet lower mass dark matter halos. For example a dark matter halo formed at has a descendant with median mass . More massive, rarer, PopIII halos, with virial temperature above K, can cool by neutral hydrogen rather than molecular hydrogen so that their formation is less sensitive to radiative feedback from other stars (e.g. see Bromm & Larson, 2004). These halos have a typical mass of and if they form at , then their typical descendants are similar to those of a dark halo (see Fig. 5).
4 Generation of Initial Conditions around Rare High-Redshift Halos
Given the large scatter in the assembly histories of dark matter halos is there an optimal way to select a region of a simulation box centered around a rare high-redshift halo under the constraint of limited computational resources?
4.1 Analysis of the recursive resimulation method
The method introduced by Gao et al. (2005) certainly presents a very competitive advantage over a random selection of an equal subvolume though it identifies a halo with an atypical accretion history, biased toward having an above average merging rate and living in an environment that tends to have an overdensity of nearby halos (Barkana & Loeb, 2004). To better quantify the properties of halos identified by recursive resimulation, we use the Monte Carlo method presented in Trenti & Stiavelli (2007), which is based on the identification of virialized dark matter halos as density peaks in the linear density field. This approach predicts well and without introducing systematic biases the location and virialization redshift of the very first dark matter halos when compared to the full non-linear dynamics of the simulation, even though there are some statistical fluctuations on a halo-to-halo basis (Bond & Myers, 1996; Mesinger & Furlanetto, 2007). For the comparison with Gao et al. (2005) we adopt the following parameters from their paper: (i) , , , , , spectral index ; (ii) parent box size edge Mpc ; (iii) largest dark matter halo in the box at of mass ; (iv) final high-resolution simulation sphere of Mpc (with volume Mpc3); (v) the most massive halo in the final resimulation region R5 is at . Based on these assumptions, our analysis yields the following results:
-
•
The number density of dark matter halos of mass is Mpc-3 (Sheth-Tormen mass function) or Mpc-3 (Press-Schechter mass function) at , so these halos are not particularly rare. Specifically, in a random region of volume at , the expectation value for the number of halos more massive than is greater than unity () when using the Sheth & Tormen (1999) formula. However, due to the high bias of the halos, , the actual fraction of empty volumes as given by our Monte Carlo code is . Thus the Gao et al. (2005) method is a substantial improvement over random selection of a volume within the parent box.
-
•
The first halo of mass in the whole box virializes at at 99% of confidence level. The possibility that the most massive halo identified by Gao et al. (2005) in their final resimulated volume is the most massive of the whole box at that redshift is ruled out at a confidence level greater than (confidence level limited by the precision of the numerical integration).
-
•
The first halo of mass that ends up at in a dark matter halo of mass is formed at at 99.9% of confidence level. Thus it is unlikely that the Gao et al. (2005) halo of mass at is the most massive progenitor of the cluster that will contain it at .
From this analysis it is indeed confirmed that recursive refinement works well to select a sub-region for resimulation that host a rare high-z dark matter halo, but still this halo is not one of the very first of its kind in the box. If the interest is primarily in the local physics around one of these rare structures, a viable alternative is the constrained realization method (Hoffman & Ribak, 1991; Bertschinger, 2001). A constrained realization does not require a hierarchy of resimulations, but rather introduces the overdensity in the initial conditions by construction, so that the realized initial conditions do not carry information about its rarity or its typical surrounding environment.
4.2 Unbiased selection of rare halos: the density field method
If one is instead interested in selecting one of the very first dark matter halos in a given simulation volume, with a particular interest in representative halos, that is halos with unbiased accretion histories, we propose instead to select the final region of interest from a density field at uniform resolution. When the dynamic range of the resimulation is not too large, it is of course possible to identify the region to be refined directly from the low-resolution dark matter halo catalogs. If this is not possible, then the resimulation volume can be identified from a high resolution, but uniform, refinement of the density field. The idea is the following:
-
1.
A high-resolution density field is generated over the whole box. The mass of a field cell is that of the high- dark matter halo of interest (e.g. for a PopIII halo). A technical, but important, detail is that a top-hat filter in frequency space must be used when generating this field, as this guarantees that the mass function obtained from peak analysis matches that of Press & Schechter (1974).
-
2.
The highest peak in the high-resolution field is identified. This is the location where one of the first halos at the mass scale of the density field is formed within the whole simulation box.
-
3.
A region around that peak can now be selected for resimulation, with additional fluctuations added over the high resolution density field, for example by using the GRAFIC2 refinement method of Bertschinger (2001). Outside the selected region the high resolution field can be degraded if necessary to generate more massive particles.
This method does not necessarily require overwhelming computational resources. For example, to select the largest dark matter halo in a volume relevant for the study of bright high- QSOs, a mass resolution of is more than sufficient, which translates into a density field grid for a cosmic volume of . Such a grid only requires 512MB of RAM for storing. Even identifying the positions of the first PopIII stars in a large volume is not unrealistic. A density grid requires only 32GB of RAM and provides a mass resolution of (the first halo in Gao et al. 2005) over a volume of . Given the number density of such halos——about 1471 will have formed on average in the box by . In fact, using the Monte Carlo code of Trenti & Stiavelli (2007) we predict that there is a probability of not forming one of these halos before . The median redshift of formation for the first halo of mass is . With larger resources one can generate a density grid over a volume of , obtaining a mass resolution of . This requires about 256GB of RAM, easily available on a parallel computing cluster of moderate size. With a top-end supercomputer one can use more than cells, with a dynamic range that permits identification of smaller mass halos in the same volume or an increase the volume of the parent box for the same assumed PopIII halo mass.
Our proposed density field method has also another advantage: As we generate a uniform, very high-resolution density grid over the whole box, aliasing errors in the zoom refinement procedure are less severe than if one follows the Gao et al. (2005) recursive refinement method (see Bertschinger 2001 for a detailed analysis of the errors introduced when large zooming factors are used).
4.3 Preliminary testing of the density field method
Detailed analysis and applications of our method to select high-redshift halos is deferred to a follow-up paper. Here we present a preliminary testing to assess its performance. For this we consider a cosmological simulation in a box of edge (details on the simulation are discussed in Trenti & Stiavelli 2007). We construct the halo catalog for a snapshot at using the HOP halo finder (Eisenstein & Hut, 1998), finding that the most massive halo has a mass of ( particles). The density field used to generate the initial conditions for this run is then (i) downgraded to a grid (where one low resolution cell corresponds to 64 of the original grid cells) using the Hoffman & Ribak (1991) constrained realization method and (ii) evolved in linear theory to . The highest density peaks in the low-resolution field are then identified and their location compared with that of the dark matter halos identified from the N-body simulation at full resolution. Within the ten highest peaks (with linear overdensities from to ), six of them are associated with dark matter halos with more than particles, including all the top three overdensities. The top overdensity is matched to the fourth most massive halo of the snapshot, with particles (versus the of the most massive). Of the remaining unmatched peaks, two are associated with halos with less than 64 particles and two appear to be still in the process of virialization, so the central density of their groups in the N-body run does not qualify them as halos. The most massive halo in the box is missed by the density field analysis because its particles are spread over several adjacent cells in the downgraded density field. This is an intrinsic limitation of our method rooted in the use of a fixed grid in the position space, which is bound to miss some of the the dark matter halos that are off-center with respect to the spatial location of the grid cells. However this only leads to miss a random fraction of the rare halos, without an environmental bias as in the Gao et al. (2005) method.
5 Conclusion and Discussion
By means of both analysis of numerical simulations and of extended Press-Schechter modeling we investigated the relation between the most massive dark matter halos at different redshifts. The main conclusion of this work is that—contrary to expectations from many recent works (e.g. see Springel et al. 2005; Reed et al. 2005; Gao et al. 2005, 2007; Li et al. 2007)—the most massive halo at a redshift does not necessarily evolve into the most massive at . This is a robust conclusion that can be naturally understood in the context of growth of dark matter density perturbations, for example by constructing merger trees through the Lacey & Cole (1993) model. Rare high-redshift objects, such as the remnants of the first PopIII stars and QSOs, are not hosted at in the most massive halos, but rather live in a variety of environments. For example, the typical PopIII star remnant lives in a dark matter halo that at has a mass of , typical for a galaxy group, and not within rich clusters as claimed by White & Springel (2000). Similarly the descendant of a typical QSO is not located within the most massive clusters at as assumed by Li et al. (2007).
These conclusions have important consequences on the application of the recursive simulation method introduced by Gao et al. (2005) to identify high-redshift rare halos based on progressive refinement of regions centered around the most massive cluster. In fact, while the recursive method is indeed effective at identifying a sub-region of the simulation with earlier-than-average structure formation, it finds neither the earliest structures in the box, which are dominated by small-scale density fluctuations, nor typical early structure, as it preferentially identifies objects located in the regions with the highest bias.
These limitations may have only a minor effect when the goal is to investigate the formation of one rare Population III halo in the simulation box, as it is done for example in Gao et al. (2005) and in Reed et al. (2005). However in different physical scenarios it is important to correctly estimate the rarity of the halo simulated and to assess how typical their growth histories are. This is critical if additional physics beyond gravitational interactions is included, such as star formation and radiative feedback. One such example is the formation of rare high-redshift QSOs: Li et al. (2007) use the Gao et al. (2005) method to identify at “the most massive halo in a 3 Gpc3 volume” and then conclude that the QSO formed in this halo reproduces the properties of observed QSOs with the same number density. From our analysis in Sec. 2 it is clear that the halo identified by Li et al. (2007) as progenitor of the largest cluster is not likely to be the most massive at . Thus other similar or more massive halos are expected to be present at in their 3 Gpc3 simulation volume: in principle any of these halos could host a bright QSOs, with important consequences for the comparison between observed and simulated QSO number densities. In addition, when the goal is to study the environment in which QSOs live, selecting host halos with the resimulation method introduces systematic effects in the results difficult to quantify and correct for, because these halos would have above-average growth (and merging) histories.
To avoid selecting only the halos with atypical accretion histories and in an attempt to improve over the identification of some of the rarest high-redshift halos in a box, we propose instead to select the initial conditions for high-resolution resimulation based on the analysis of the linear density field at uniform resolution. The method, described in Sec. 4, identifies subregions of the simulation box with high-redshift halos as those with the highest peaks in the density field, requiring a mass resolution in the field comparable to that of the mass of the halos one wishes to select. The applicability of the method is thus limited only by the size of the largest density grid that can be accommodated in the available memory, otherwise requiring only a modest amount of computing time compared to the Gao et al. (2005) method. This is because our method bypasses the need of a series of N-body simulations to be carried out in addition to the final run.
Unfortunately, our method does not guarantee identification of the first halo on the desired mass scale, as highlighted by some preliminary testing we presented in Sec. 4.3. This seems still an elusive goal. When the density field is defined over a fixed grid, there is not a perfect match between the halo catalog constructed from the density field and that obtained by increasing the resolution of the field and then following the full non-linear dynamics with an N-body simulation. An extensive validation of our linear density field initial conditions generation and its application to the formation of the first bright QSOs will be discussed in a subsequent paper.
References
- Abel et al. (2002) Abel, T., Bryan, G. L. and Norman, M. L. 2002, Science, 295, 93
- Bertschinger (2001) Bertschinger E. 2001, ApJ, 137, 1
- Barkana & Loeb (2004) Barkana, R. and Loeb A. 2004, ApJ, 609, 474
- Bond et al. (1991) Bond, J. R., Cole, S., Efstathiou, G. and Kaiser, N. 1991, ApJ, 379, 440
- Bond & Myers (1996) Bond, J. R. and Myers, S. T. 1996, ApJS, 103, 1
- Bryan & Norman (1998) Bryan G.L. and Norman, M.L. 1998, ApJ, 495, 80
- Bromm & Larson (2004) Bromm, V. and Larson, R. B. 2004, ARA&A, 42, 79
- Casas-Miranda et al. (2002) Casas-Miranda, R., Mo, H. J., Sheth, R. K. and Boerner, G. 2002, MNRAS, 333, 730
- Ciardi & Ferrara (2005) Ciardi, B. and Ferrara, A. 2005, Space Sci. Rev., 116, 625
- Di Matteo et al. (2005) Di Matteo, T., Springel, V. and Hernquist, L. 2005, Nature, 433, 604
- Eisenstein & Hut (1998) Eisenstein, D. J. and Hut, P. 1998, ApJ, 498, 137
- Eisenstein & Hu (1999) Eisenstein, D. J. and Hu, W. 1999, ApJ, 511, 5
- Fan et al. (2004) Fan, X. et al. 2004, AJ, 128, 515
- Gao et al. (2005) Gao, L., White, S. D. M., Jenkins, A., Frenk, C. S. and Springel, V. 2005, MNRAS, 363, 379
- Gao et al. (2007) Gao, L., Yoshida, N., Abel, T., Frenk, C.S., Jenkins A. and Springel, V. 2007, MNRAS, 378, 449
- Hoffman & Ribak (1991) Hoffman, Y. and Ribak, E. 1991, ApJ, 380, L5
- Hopkins et al. (2005) Hopkins, P. F., Hernquist, L., Martini, P., Cox, T. J., Robertson, B., Di Matteo, T. and Springel, V. 2005, ApJ, 625, 71
- Lacey & Cole (1993) Lacey, C. and Cole, S. 1993, MNRAS, 262, 627
- Lemson (2006) Lemson G. and the Virgo Consortium, 2006, astro-ph/0608019
- Li et al. (2007) Li, Y., Hernquist L., Robertson B., Cox T. J., Hopkins, P. F., Springel, V., Gao, L., Di Matteo, T., Zentner A. R., Jenkins, A. and Yoshida N. 2007, ApJ, 665, 187
- Madau & Rees (2001) Madau, P. and Rees, M. 2001, ApJ, 551, 27
- Mesinger & Furlanetto (2007) Mesinger, A. and Furlanetto, S. 2007, ApJ, 669, 663
- Mo & White (1996) Mo, H. J.and White, S. D. M. 1996, MNRAS, 282, 347
- Muñoz & Loeb (2008) Muñoz, J. A. and Loeb, A. 2008, MNRAS, in press, arXiv:0711.0467
- Naoz et al. (2006) Naoz, S., Noter, S. and Barkana R. 2006, MNRAS, 373, 98
- Navarro & White (1994) Navarro, J. F. and White, S. D. M. 1994, MNRAS, 267, 401
- O’Shea & Norman (2007) O’Shea, B. W. and Norman, M. L. 2007, ApJ, 654, 66
- Press & Schechter (1974) Press, W. H. and Schechter, P. 1974, ApJ, 187, 425
- Reed et al. (2005) Reed, D. S., Bower, R., Frenk, C. S. and Gao, L., Jenkins, A., Theuns, T. and White, S. D. M. 2005, MNRAS, 363, 393
- Santos et al. (2002) Santos, M. R., Bromm V. and Kamionkowski M. 2002, MNRAS, 336, 1082
- Sheth & Tormen (1999) Sheth, R. K. and Tormen G. 1999, MNRAS, 308, 119
- Spergel et al. (2003) Spergel, D. N. et al. 2003, ApJS, 148, 175
- Springel et al. (2005) Springel, V. et al. 2005, Nature, 435, 629
- Volonteri et al. (2003) Volonteri, M., Haardt, F. and Madau, P. 2003, ApJ, 582, 559
- Trenti & Stiavelli (2007) Trenti M. and Stiavelli, M. 2007, ApJ, 667, 38
- Trenti & Stiavelli (2008) Trenti M. and Stiavelli, M. 2008, ApJ, 676, 767
- White & Springel (2000) White, S. D. M. and Springel, V. 2000, in “The First Stars”,Weiss, A. and Abel, T. G. and Hill, V. eds., Springer-Verlag.