Radio observations of the Horologium-Reticulum Supercluster -I. A3158: Excess star-forming galaxies in a merging cluster?
Abstract
We present 1.4 and 2.5 GHz Australia Telescope Compact Array (ATCA) observations of the galaxy cluster A3158 (z=0.0597) which is located within the central part of the Horologium-Reticulum Supercluster (HRS). Spectroscopic data for the central part of the HRS suggest that A3158 is in a dynamically important position within the supercluster and that it is moving toward the double cluster system A3125/A3128 which marks the centre of the HRS. A total of 110 radio galaxies are detected in a 35 arcminute radius about the cluster at 1.4 GHz, of which 30 are also detected at 2.5GHz. We examine the source counts and compute the Radio Luminosity Function (RLF) at 1.4 GHz from the subset of 88 sources found within the full-width half-power area of the ATCA beam. Comparison of the source counts in the area over the background, as computed by Prandoni et al. (2001), shows some evidence of an excess of galaxies with L. This result seems to indicate a star forming population and is a result similar to that found recently by Owen et al. (2005) for the merging cluster A2125. In addition we find that the radio luminosity function for early-type galaxies (E and S0) below log P 22.5 is lower than that found for a composite cluster environment (Ledlow & Owen, 1996) but is similar to the early-type RLF for clusters in the centre of the Shapley Super cluster (Venturi et al. 2000) which are believed to be in the latter stages of merging. This result implies that the cores of superclusters are environments where radio emission, particularly resultant from AGN, is suppressed in the later stages of merging. Thus, radio observations of clusters might be sensitive indicators of the precise merger stage of the cluster but more observational evidence is still required to establish this trend.
keywords:
galaxies:clusters: general - galaxies:clusters: individual: A3158 - radio continuum:galaxies.1 Introduction
Observational and numerical studies suggest that dynamical interactions are frequent occurrences in clusters of galaxies and that these events are the most energetic in the recent history of the Universe. Matter is believed to stream along preferred axes (so-called filaments and sheets) often accelerating in-falling galaxies to velocities of the order of 103 km s-1. Rich clusters form at the intersection of the filament and sheets, and larger mass congregations, such as superclusters, are often detected as a collection of several clusters and filaments. These dynamical processes cause shocks, turbulence and bulk flows along the filamentary axes resulting in disturbance of the intracluster medium (ICM). Such perturbations are frequently detected with X-ray observations which show a variety of features including sharp temperature jumps, distorted X-ray isophotes and regions of enhanced pressure and entropy. At radio wavelengths, cluster mergers are thought to generate large areas of diffuse synchrotron emission either as a central, unpolarised halo or one or occasionally two peripheral “radio relics”. Cluster “weather” and bulk flows have also been cited as causes of the bending of the jets in head-tail galaxies (Burns et al. 1998, Johnston-Hollitt et al. 2004), although recent results suggest that more local conditions might play a more important role in their formation (Mao et al. 2008).
In addition to the large-area phenomena discussed above, the dynamical history of galaxy clusters should also be imprinted on the constituent galaxies. In particular, increased secondary star formation either observed in the optical (Burns et al. 1994; Caldwell & Rose 1997) or through increased low-power radio emission (Owen et al. 1999) is one possible signature of the history of a dynamical cluster. However, the balance between mergers driving gas towards the centre of the galaxies and hence feeding the central AGN to induce a starburst (Bekki 1999) and an increase in the ram pressure which would strip gas from galaxies and hence curtail the feeding of the AGN (e.g. Balogh et al. 1998; Fujita et al. 1999) still needs to be addressed observationally. To date, few studies have been conducted with both sufficient sensitivity in the radio to probe the low-powered radio sources, and good optical observations to confirm cluster membership. The most notable progress to date has been made on sections of the Shapley Supercluster with several areas analysed in both the radio and optical, including radio observations of A3556 (Venturi et al. 1997), A3571 (Venturi et al. 2002), the A3528 complex (Venturi et al. 2001) and the A3558 complex (Venturi et al. 2001; Miller 2005) and its outskirts (Giacintucci et al. 2004, Miller 2005). In addition to clusters in superclusters, the host radio population for several individual clusters have also been examined including A2255 (Miller & Owen, 2005), A2256 (Miller et al. 2003), A2125 (Owen et al. 2005) and A2111 (Miller et al. 2006). However, at present, those observational studies that have been undertaken give incomplete results with both instances in which effects are seen on the radio population, and cases where they are not observed. Sometimes neighbouring clusters in the same supercluster show markedly different results in terms of radio population. This may well be due to the radio galaxy population only being affected in certain phases of dynamical activity (Venturi et al. 2002) however, the exact point at which a merger might affect the radio population is, as yet, unclear. Nevertheless, large-area observations of superclusters, such as Shapley, present ideal datasets with which to investigate the way in which environment affects the galaxy population.
In this paper, which will be the first in a series, we present a study of the radio population of A3158 which lies within the kinematic core of the massive Horologium-Reticulum Supercluster (HRS). The HRS spans around 180 square degrees on the sky (Fleenor et al. 2006), contains upwards of 20 galaxy clusters (Zucca et al. 1993), is comprised of at least two major filaments (Einasto et al. 2003), and is the second largest mass concentration in the local 300 Mpc (Hudson et al. 1999). A3158 lies adjacent to the so-called center of the HRS, defined by the double cluster complex A3125/A3128 (Rose et al. 2002). The paper will be laid out as follows: Section 2 will discuss A3158 in detail; Section 3 will give details of the radio observations of the cluster; Section 4 will present the radio source population and in Sections 5 and 6 we will discuss the resultant radio source counts and radio luminosity functions; Sections 7 & 8 will present the discussion and conclusions. Throughout this paper we will assume H0=71 km s-1 Mpc-1 which at the average redshift of A3158 (z=0.0597) means that 1 arcsecond 1.1 kpc.
| Parameter | Value | Reference |
|---|---|---|
| redshift | 0.0597 | 3 |
| ellipticity | 0.3 | 1 |
| X-ray Luminosity | 5.31 erg s-1 | 2 |
| velocity | 17,910 kms-1 | 4 |
| Redshift n=145 | 0.0597 | 3 |
| velocity disp. (n=145) | 97057 kms-1 | 3 |
| Viral Mass | M☉ | 3 |
2 A3158
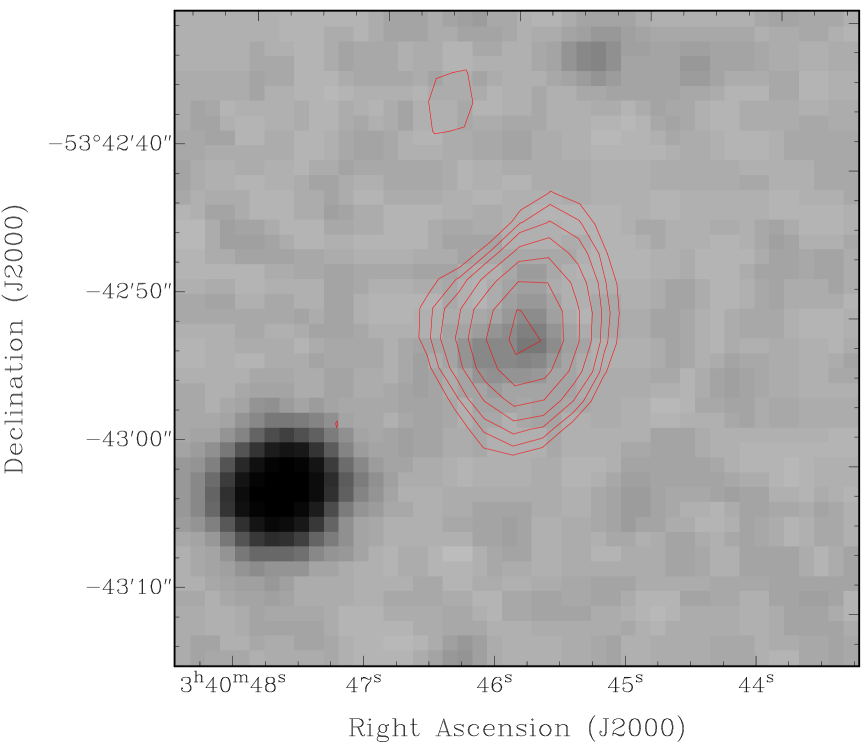
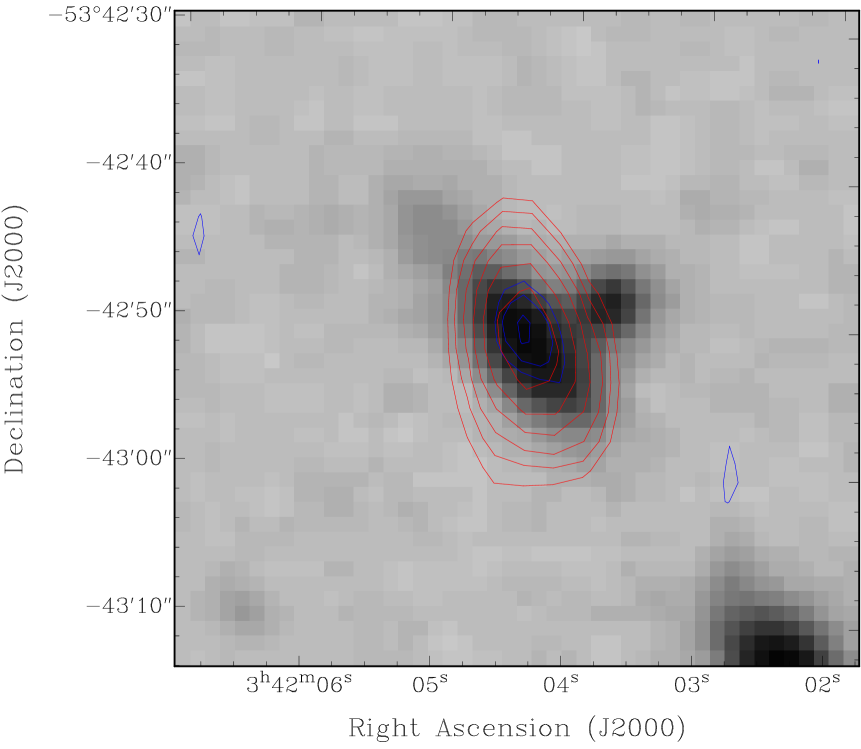
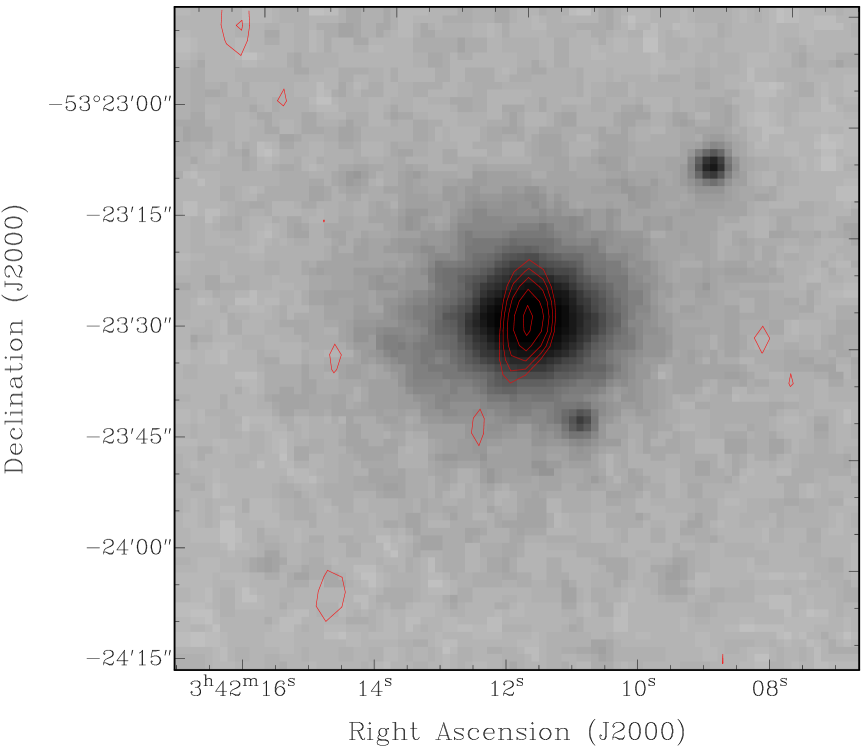
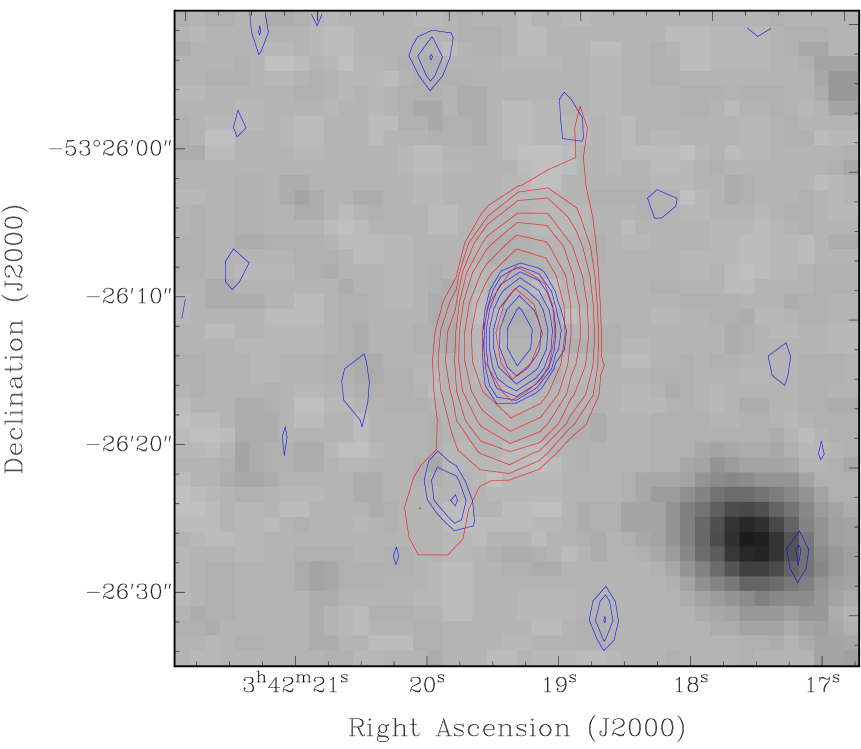
The ACO cluster A3158 (Abell, Corwin & Olowin 1989) is a compact cluster of richness class two (Quintana & Halven 1979) and estimated viral mass of 15.4 solar masses (Lokas et al. 2006). It has been listed in many works under several different names, the most common of which is Calan 0340-538 (Melnick & Quintana 1975). The cluster is an elliptically dominated, centrally condensed cluster (Quintana & Havlen 1979), with three central dominant (cD) galaxies (Sersic 1974). Two cD galaxies are found at the very centre of the cluster and have a 45 arcseconds separation (Lucey et al. 1983), the third lies approximately 6 arcminutes away to the southeast of the cluster core (See Fig 9). The gravitational centre of the cluster, as determined by the X-ray emission, is found to have a right ascension and declination (J2000) of and (Lokas et al. 2006).
The HRS is comprised of two major groupings of galaxy clusters (Einasto et al. 2003), the northern clusters () which are situated around and the southern clusters () at (Fleenor 2006). Abell 3158 is situated in the heart of the kinematic core (16,000 – 23,000 km s-1) of the HRS (Fleenor et al. 2004; Fleenor et al. 2005) and has close physical proximity to the southern of the two major mass concentrations in the supercluster. A3158 is located approximately ( Mpc) east of the A3125/A3128 double-cluster system which is thought to mark the southern centre of the supercluster (Rose et al. 2002; Johnston-Hollitt et al. 2004). These three clusters have long been suggested to be connected via a “bridge” of galaxies (Lucey et al. 1983) which is part of the larger HRS structure. It is interesting to note that the two central cD galaxies in A3158 and the additional one to the south-east appear to line up in a NW-SE direction. This direction is significant, as it is the direction of the proposed bridge that connects A3158 with the southern kinematic core of the HRS.The galaxy density centre is shown to be concentrated on the two more central cD galaxies and is elongated in the direction of the third (Lucey et al. 1983). In addition, on a larger scale, the optical isodensity plots for A3158 show that the cluster appears to be elongated along the axis toward the centre of the HRS (Havlen & Quintana 1978).
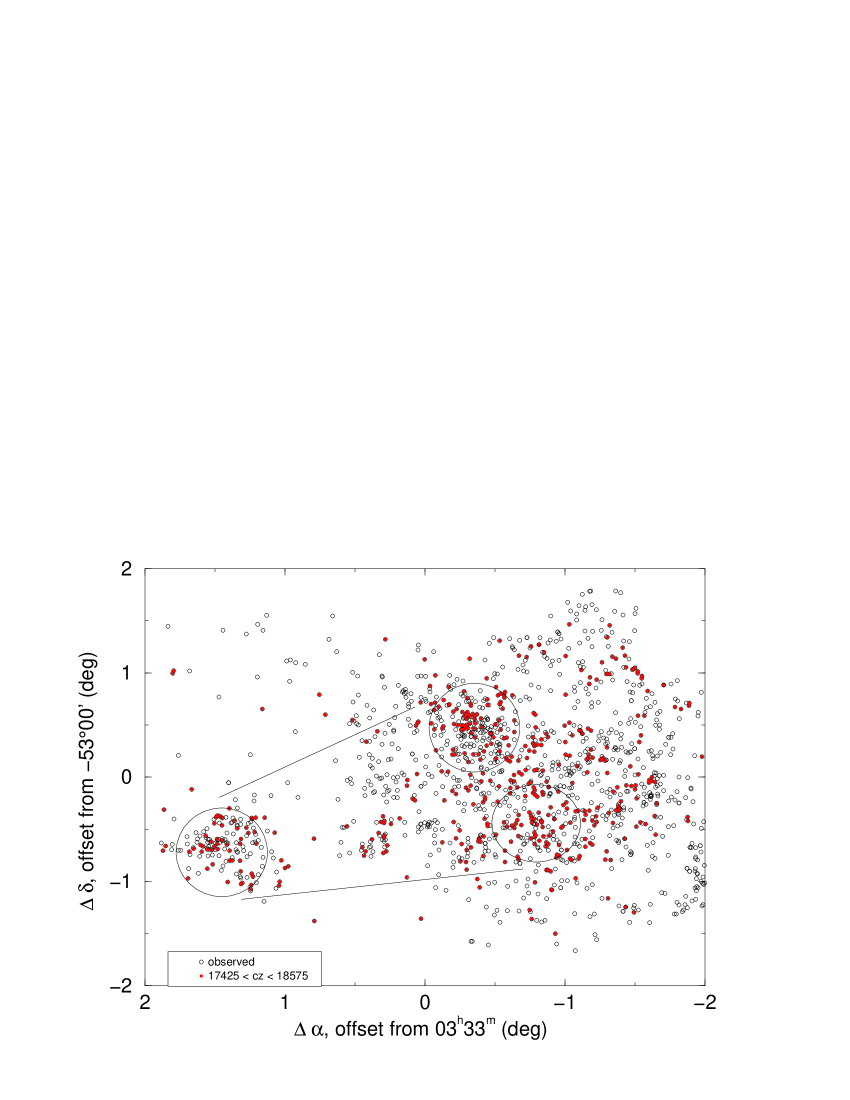
Lucey et al. (1983) measured the velocities of 129 galaxies in a 6 region about the central part of the HRS. Based on these results they established that A3158 was connected via a bridge of galaxies to the double cluster A3125/A3128 and that based on a simple two particle model that A3158 and the A3125/A3128 system are moving toward each other and will collide in 0.5 of a Hubble time. More recently Fleenor (2006) studied the dynamics of the A3125/A3128/A3158 system finding that 52 galaxies (aside from those in Automatic Plate Measuring, APM, clusters (Dalton et al. 1992 & 1994)) were likely to be members of the bridge connecting A3158 and the A3125/A3128 system. Fleenor (2006) gives the bridge velocity range as between 17250 km s-1 and 18575 km s-1. This Mpc intercluster filament has a galaxy overdensity of greater than 7 the average overdensity of the HRS (). Figure 1 shows A3158 and the A3125/A3128 complex along with the bridge of galaxies identified by Fleenor (2006). In the plot open circles represent galaxies with measured spectroscopic redshift and filled, red circles are those corresponding to the bridge velocity, albeit with a slightly higher lower limit (17425 km s-1 and 18575 km s-1) . In addition, multi-wavelength data have suggested that A3125/A3128 are undergoing hierarchical merging along the axis connecting the two (Rose et al. 2002). Despite the fact that recent large-scale surveys have clearly establish that all of the member clusters of the HRS are connected via a filamentary network of galaxies (Fleenor et al. 2005) the bridge between A3158 and A3125/A3128 seems particularly significant. The proximity of A3158 to the southern core of the HRS, thus suggests the cluster is in a dynamically important position within the supercluster.
2.1 Optical Analysis of A3158
Not surprisingly, the two central cD galaxies, appear to dominate the dynamics of the cluster core. Initial analysis of this region by Havlen & Quintana (1978) and Quintana & Havlen (1979) shows that the core of the cluster is centrally condensed with predominantly elliptical galaxies, whereas spiral galaxies in the region appear to show no significant concentrations. Lucey et al. (1983) noted that the two close cD galaxies have similar recessional velocities of the order of cz=17,500 km s-1, which are similar to values found by Fleenor (2006) for the bridge galaxies but notably less than the cluster average (17,910 km s-1), whereas the third cD has a recessional velocity of around cz19,000 km s-1, which is well above the cluster average. This suggests the third cD might be the centre of a subcluster. Subclustering containing the third cD galaxy is further substantiated by the flattened velocity histogram at 19,000 km s-1 found in Smith et al. (2004), Figure 7. This form of mass segregation is suggested repeatedly throughout the literature, however, as yet, it has not been confirmed due to the insufficient number of galaxies with known redshifts to profile in the cluster (see Lokas et al. (2006)). Mass segregation, however, is an indication of dynamical evolution, and as such is a strong indicator that A3158 is in a state of advanced evolution. The velocity dispersion profile is seen to be flat out to about 2.1 hMpc (assuming ho=0.71) (den Hartog & Katgert 1996; Dupke & Bregman 2005). Details of the cluster properties are given in Table 1.
2.2 X-ray Properties of A3158
A3158 has a relatively high X-ray luminosity with Lx= 5.31 ergs-1 in the 0.1 - 2.4 keV band (Ebeling et al. 1996). The X-ray emission emanating from the region has a smooth distribution which is centrally concentrated, and is similar in distribution to the optical component of the cluster giving little indication of substructure. While it is clear that the two large elliptical cD galaxies are the dynamical centre of the cluster, Ku et al. (1983) found that the mass of the intracluster gas exceeds 10% of the virial mass, which indicates that it may play a significant role in the dynamics of the outer regions of the system. Evidence for cluster mergers previously occurring in the A3158 region is given by Ohata et al. (2001), who found that the X-ray temperature distribution of A3158 has large axis-symmetry along the major axis of its optical counterpart. This indicates a possible shock passage and lends support to the suggestion that mergers have occurred previously in the region.
3 Observations
3.1 Radio Observations
Observations of A3158 were carried out at 1.384 and 2.496 GHz on the Australia Telescope Compact Array (ATCA) on five different occasions throughout 1999. The data were taken in four array configurations (6A, 6B, 6C and 210m) and co-added to improve coverage in the uv-plane. The total observing time was 20.5 hours over all four configurations. The first observation (taken by MJH) had the field centre at 03 43 54.29, -53 41 36.6 whereas the remainder of observations which were retrieved from the Australia Telescope Online Archive were centred at 03 42 53.00, -53 37 43.00. Details of the observations are given in Table 2.
| Field Centre | Date | Array | Integration | |
|---|---|---|---|---|
| RAJ2000 | DECJ2000 | 1999 | Config. | (min) |
| 03 43 54.29 | -53 41 36.6 | 26 Feb. | 6C | 136 |
| 03 42 53.00 | -53 37 43.0 | 6 Sep. | 6D | 331 |
| 03 42 53.00 | -53 37 43.0 | 9 Sep. | 6A | 215 |
| 03 42 53.00 | -53 37 43.0 | 10 Sep. | 6D | 57 |
| 03 42 53.00 | -53 37 43.0 | 12 Nov. | 210m | 490 |
In all cases the ability of the ATCA to simultaneously observe two sections of the available frequency band was utilised to observe 2 128 MHz bands each divided into 13 independent 8 MHz channels. As the channels at the edge of the band are removed this gives an effective bandwidth of 2 96 MHz for each frequency. The flux density scale was set using observations of PKS B1934-638 which was assumed to have total fluxes of S1.4= 14.9 and S2.5= 11.6 Jy at 1.4 and 2.5 GHz respectively. The gain and bandpass calibration were performed relative to the unresolved calibrators PKS B0355-669 and PKS B0355-483 which have flux densities of 1.01 and 0.20 Jy at 1.4 GHz and 0.77 and 0.41 Jy at 2.5 GHz respectively. PKS B0355-669 was used in the initial observation and PKS B0355-483 was used in the archival observations by Haida Liang.
Data were reduced in the MIRIAD software suite (Sault et al. 1995) using standard calibration routines. At both frequencies both total intensity (Stokes I) mosaic images were made using the MIRIAD task LINMOS. As part of the mosaicing process the inner part of the image is corrected for the primary beam response of the antennas. In addition, sensitivity and effective gain maps, which give an estimate of the residual errors due to primary beam attenuation remaining on the edge of the field, are produced.
The final 1.4 GHz image has a synthesised beam of 8.8′′ 4.6′′ at position angle 2.4∘ and has an RMS sensitivity of 0.03 mJy beam-1 at the centre of the image. The final 2.5 GHz image has a synthesised beam of 5.0′′ 2.6′′ at position angle 2.5∘ and has an RMS sensitivity of 0.03 mJy beam-1 at the centre of the image. However, because of the slight difference in pointing centres between the first observation and the rest of the observations the sensitivity does not decrease uniformly with radius across the resultant images. The 1.4 GHz image is shown in Figure 2. The area over which the primary beam attenuation, remaining in the centre of the mosaiced image, is negligible () is marked on the image as a circle of radius centred at 03 42 53.00 -53 37 43.0. This represents the area for which the effective gain map is now 1 and is circular due to the unequal integration times in the pointing centres with this region arising from 89% of the integration time. Sources found beyond this region correspond to areas of the effective gain map which are less than one, that is, they will still have fluxes which are both lower than in reality and have greater uncertainty than the middle of the field. These sources had their flux densities corrected for the remaining primary beam attenuation using the standard analytical formula for the ATCA (Wieringa & Kesteven 1992).
The uncertainty in the flux density measurement is estimated after Venturi et al. (2000) as a function of the noise in the map, , and the residual calibration error, , such that
| (1) |
where is the source flux density and the residual calibration error is assumed to be of order
1.
| Radio | Coordinates | S1.4 | S2.5 | Optical ID | z | Ref. | Mag. | Name | ||
|---|---|---|---|---|---|---|---|---|---|---|
| RAJ2000 | DECJ2000 | mJy | mJy | RAJ2000 | DECJ2000 | |||||
| 03 40 45.93 | -53 42 52.4 | 1.85 0.04 | 03 40 45.86 | -53 42 52.7 | 22.63 | |||||
| 03 41 06.40 | -53 22 16.9 | 0.44 0.03 | 03 41 06.33 | -53 22 18.2 | 19.06 | |||||
| 03 41 08.34 | -53 40 28.6 | 0.75 0.03 | 03 41 08.44 | -53 40 28.3 | 20.08 | APMUKS(BJ) B033949.49-535002.2 | ||||
| 03 41 14.84 | -53 29 28.7 | 0.64 0.03 | 03 41 14.89 | -53 29 29.4 | 19.09 | MSACSS J034114.87-532929.5 | ||||
| 03 41 18.40 | -53 54 17.7 | 0.83 0.03 | 03 41 18.45 | -53 54 17.1 | 19.30 | |||||
| 03 41 20.89 | -53 47 56.9 | 0.89 0.03 | 03 41 20.98 | -53 47 57.0 | 21.17 | |||||
| 03 41 23.13 | -53 23 06.4 | 4.72 0.06 | 03 41 23.28 | -53 23 06.3 | 22.24 | |||||
| 03 41 35.52 | -53 34 56.5 | 0.51 0.03 | 0.74 0.03 | 0.69 | 03 41 35.50 | -53 34 55.7 | 21.33 | |||
| 03 41 43.44 | -53 40 53.0 | 0.88 0.03 | 03 41 43.46 | -53 40 53.1 | 17.26 | |||||
| 03 41 44.52 | -53 42 21.0 | 3.42 0.05 | 1.76 0.03 | -1.23 | 03 41 44.46 | -53 42 21.0 | 0.066523 0.000147 | 1 | 16.78 | 2MASX J03414449-5342216 |
| 03 41 49.04 | -53 24 14.2 | 1.94 0.04 | 03 41 49.20 | -53 24 13.2 | 0.055492 0.000133 | 1 | 17.59 | APMUKS(BJ) B034029.62-533343.5 | ||
| 03 42 01.07 | -53 48 15.2 | 1.09 0.03 | 0.67 0.03 | -0.90 | 03 42 01.25 | -53 48 16.0 | 20.22 | APMUKS(BJ) B034042.78-535747.3 | ||
| 03 42 03.81 | -53 35 06.0 | 167.731.68 | 87.90 0.88 | -1.20 | 03 42 03.81 | -53 35 05.8 | 22.47 | |||
| 03 42 04.34 | -53 42 51.9 | 1.81 0.04 | 03 42 04.36 | -53 42 50.5 | 0.066513 0.000133 | 1 | 17.20 | 2MASX J03420435-5342503 | ||
| 03 42 08.39 | -53 55 44.1 | 0.81 0.03 | 03 42 08.38 | -53 55 44.7 | 0.073641 0.000290 | 1 | 18.04 | 2MASX J03420850-5355443 | ||
| 03 42 11.86 | -53 23 27.0 | 0.73 0.03 | 03 42 11.84 | -53 23 27.0 | 0.062536 0.000100 | 2 | 15.77 | 2MASX J03421179-5323273 | ||
| 03 42 13.60 | -53 55 36.3 | 0.36 0.03 | 03 42 13.44 | -53 55 37.1 | 22.69 | |||||
| 03 42 19.26 | -53 55 22.6 | 0.96 0.03 | 03 42 19.45 | -53 55 21.8 | 20.37 | |||||
| 03 42 20.87 | -53 17 58.1 | 3.02 0.04 | 03 42 20.99 | -53 17 58.2 | 0.062003 0.000190 | 1 | 16.52 | 2MASX J03422083-531757 | ||
| 03 42 24.67 | -53 37 42.7 | 0.92 0.03 | 0.83 0.03 | -0.19 | 03 42 24.65 | -53 37 42.3 | 20.16 | APMUKS(BJ) B034105.75-534709.6 | ||
| 03 42 34.34 | -53 37 44.9 | 0.67 0.03 | 0.38 0.03 | -1.05 | 03 42 34.39 | -53 37 46.2 | 0.056809 0.000157 | 3 | 16.86 | 2MASX J03423440-533745 |
| 03 42 37.29 | -53 33 08.8 | 0.61 0.03 | 0.50 0.03 | -0.37 | 03 42 37.24 | -53 33 09.0 | 21.94 | |||
| 03 42 40.78 | -53 53 39.3 | 0.84 0.03 | 03 42 40.75 | -53 53 39.3 | 21.40 | |||||
| 03 42 48.03 | -53 49 56.0 | 0.48 0.03 | 0.65 0.03 | 0.56 | 03 42 48.08 | -53 49 55.7 | 15.68 | |||
| 03 42 49.18 | -53 39 13.0 | 0.24 0.03 | 0.13 0.03 | -1.14 | 03 42 49.29 | -53 39 12.2 | 22.16 | |||
| 03 42 53.00 | -53 37 53.0 | 7.88 0.08 | 5.12 0.06 | -0.80 | 03 42 52.98 | -53 37 52.7 | 0.057653 0.000180 | 1 | 15.31 | ESO 156- G 008 NED01 |
| 03 42 58.63 | -53 41 30.9 | 1.19 0.03 | 1.23 0.03 | 0.06 | 03 42 58.56 | -53 41 30.9 | 0.121077 0.000197 | 3 | 18.07 | 2MASX J03425857-5341306 |
| 03 42 59.93 | -53 23 49.7 | 0.75 0.03 | 03 42 59.95 | -53 23 51.3 | 18.45 | |||||
| 03 43 06.74 | -53 41 38.8 | 1.49 0.03 | 1.02 0.03 | -0.70 | 03 43 06.72 | -53 41 39.2 | 0.120003 0.000210 | 1 | 17.61 | 2MASX J03430668-5341396 |
| 03 43 11.33 | -53 53 29.3 | 0.36 0.03 | 03 43 11.39 | -53 53 28.9 | 17.44 | |||||
| 03 43 16.18 | -53 39 36.8 | 1.27 0.03 | 0.87 0.03 | -0.70 | 03 43 16.12 | -53 39 35.9 | 0.056530 0.000160 | 4 | 16.79 | 2MASX J03431618-5339365 |
| 03 43 22.80 | -53 28 26.1 | 11.84 0.12 | 5.90 0.07 | -1.29 | 03 43 22.72 | -53 28 28.6 | 20.98 | |||
| 03 43 25.45 | -53 43 20.4 | 0.41 0.03 | 0.18 0.03 | -1.53 | 03 43 25.47 | -53 43 19.1 | 17.93 | APMUKS(BJ) B034207.10-535245.7 | ||
| 03 43 29.03 | -53 25 49.6 | 0.18 0.03 | 03 43 29.01 | -53 25 50.1 | 21.13 | |||||
| 03 43 29.70 | -53 41 30.4 | 1.61 0.03 | 0.77 0.03 | -1.37 | 03 43 29.70 | -53 41 31.4 | 0.062430 0.000160 | 4 | 15.15 | 2MASX J03432968-5341316 |
| 03 43 30.49 | -53 48 55.6 | 0.35 0.03 | 03 43 30.48 | -53 48 54.9 | 19.30 | APMUKS(BJ) B034212.50-535820.4 | ||||
| 03 43 45.94 | -53 42 45.7 | 1.03 0.03 | 03 43 45.94 | -53 42 46.2 | 0.059691 0.000310 | 1 | 17.16 | 2MASX J03434600-5342466 | ||
| 03 43 47.53 | -53 32 41.6 | 0.70 0.03 | 0.61 0.03 | -0.26 | 03 43 47.46 | -53 32 40.0 | 20.86 | |||
| 03 43 47.75 | -53 22 22.3 | 0.24 0.03 | 03 43 47.53 | -53 22 23.4 | 19.46 | |||||
| 03 43 49.39 | -53 25 28.8 | 3.45 0.05 | 2.00 0.04 | -1.01 | 03 43 49.53 | -53 25 28.3 | 15.56 | |||
| 03 43 59.57 | -53 55 19.3 | 4.12 0.05 | 03 43 59.58 | -53 55 18.2 | 0.079431 0.000290 | 1 | 15.93 | 2MASX J03435962-5355181 | ||
| 03 44 10.30 | -53 51 05.5 | 0.36 0.03 | 03 44 10.31 | -53 51 06.0 | 20.24 | APMUKS(BJ) B034252.48-540029.1 | ||||
| 03 44 10.78 | -53 51 41.3 | 0.65 0.03 | 03 44 10.77 | -53 51 41.3 | 21.20 | |||||
| 03 44 11.65 | -53 43 36.3 | 1.51 0.03 | 1.25 0.03 | -0.35 | 03 44 11.72 | -53 43 34.9 | 21.89 | |||
| 03 44 18.13 | -53 41 52.0 | 1.43 0.03 | 1.70 0.03 | 0.32 | 03 44 18.06 | -53 41 51.7 | 20.31 | |||
| 03 44 21.15 | -53 44 29.6 | 2.82 0.04 | 1.21 0.03 | -1.57 | 03 44 21.10 | -53 44 30.6 | 0.160084 0.000240 | 3 | 17.96 | 2MASX J03442114-5344299 |
| 03 44 21.23 | -53 40 23.8 | 0.15 0.03 | 03 44 21.40 | -53 40 23.8 | 21.31 | |||||
| 03 44 22.67 | -53 42 49.6 | 0.66 0.03 | 03 44 22.55 | -53 42 47.2 | 0.059551 0.000133 | 1 | 17.83 | APMUKS(BJ) B034304.39-535208.5 | ||
| 03 44 55.60 | -53 29 44.5 | 0.71 0.03 | 03 44 55.45 | -53 29 43.9 | 21.78 | |||||
| 03 45 07.08 | -53 26 22.9 | 0.85 0.03 | 03 45 07.19 | -53 26 22.0 | 21.47 | |||||
| 03 45 14.30 | -53 31 28.7 | 1.27 0.03 | 03 45 14.29 | -53 31 26.7 | 22.29 | |||||
| 03 45 29.61 | -53 39 37.1 | 1.04 0.03 | 03 45 29.45 | -53 39 37.4 | 0.062323 0.000170 | 1 | 16.18 | 2MASX J03452956-5339370 |


4 Radio Sources
Radio sources were found via two independent methods. In addition to searching for sources by eye, we used a modified version of the automatic source detection algorithm “Duchamp” created by Matthew Whiting over the dataset. In both methods sources were considered to be detected if there was a total of 4 or more congruent pixels above 3 times the local RMS noise.
One of the difficulties in source determination is how to deal with sources which have multiple components. We have assumed that unless sources have contiguous pixels above the local RMS noise threshold that they correspond to separate sources.
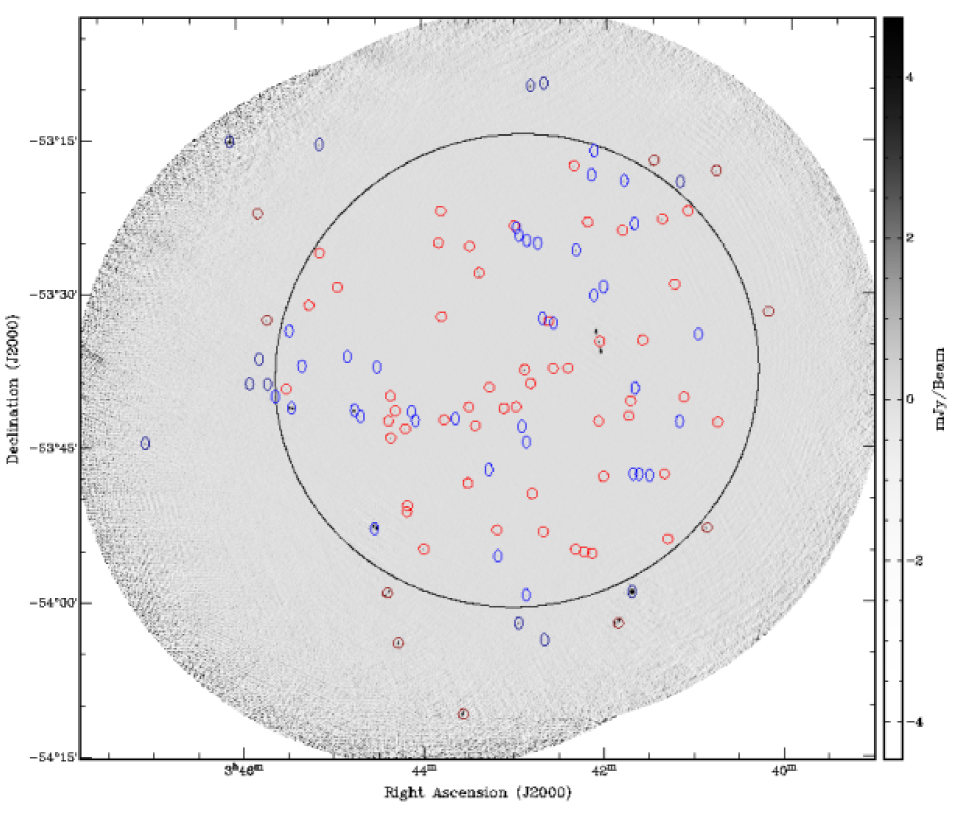
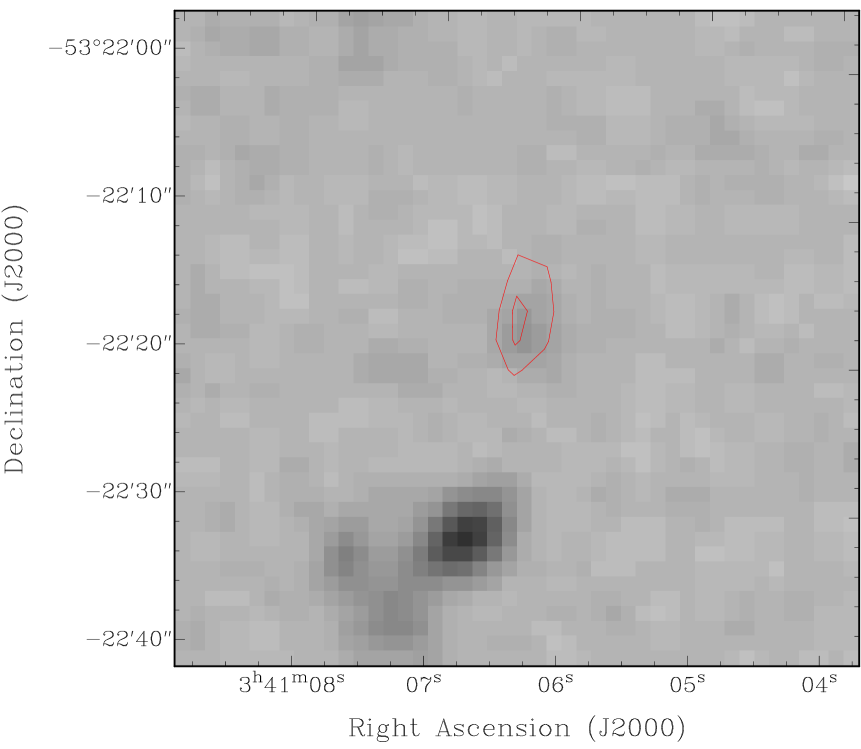
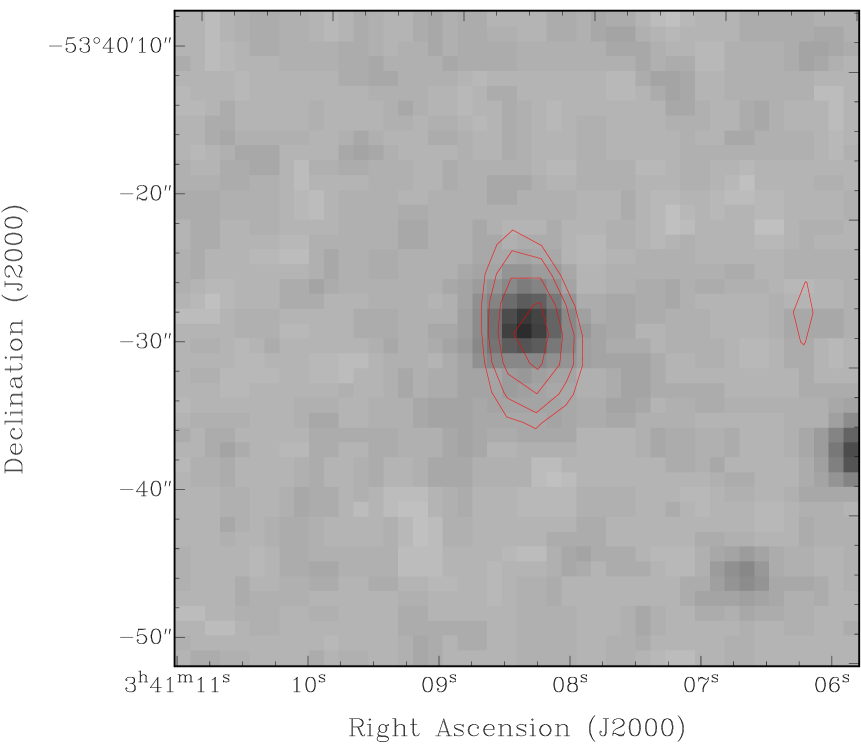
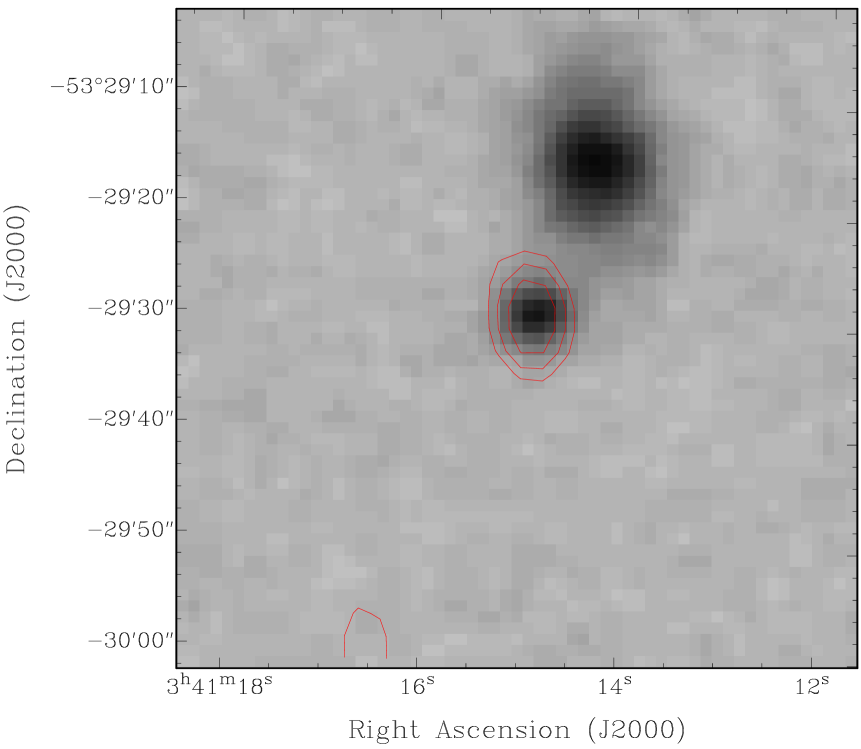
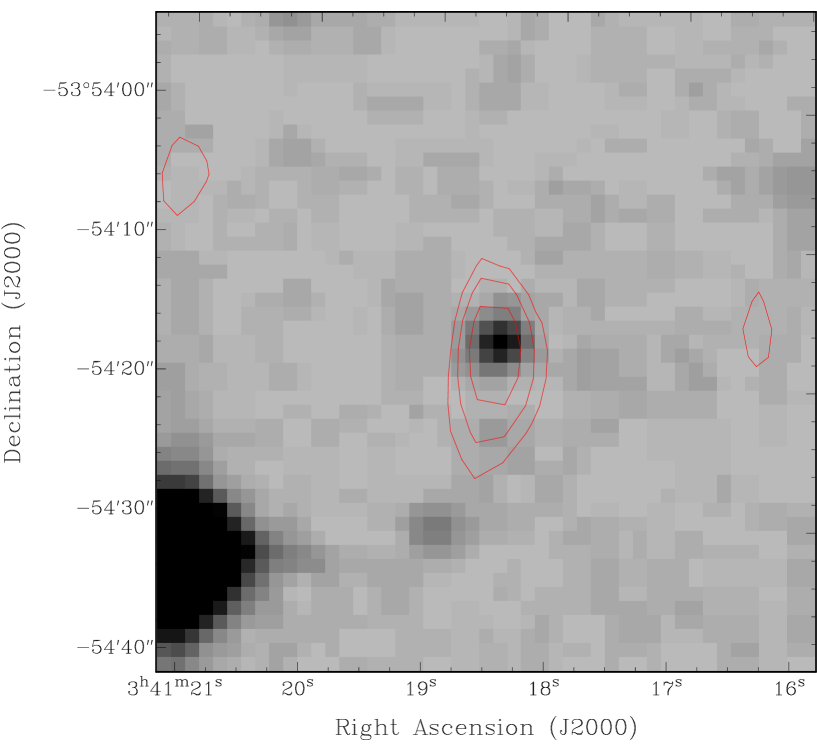
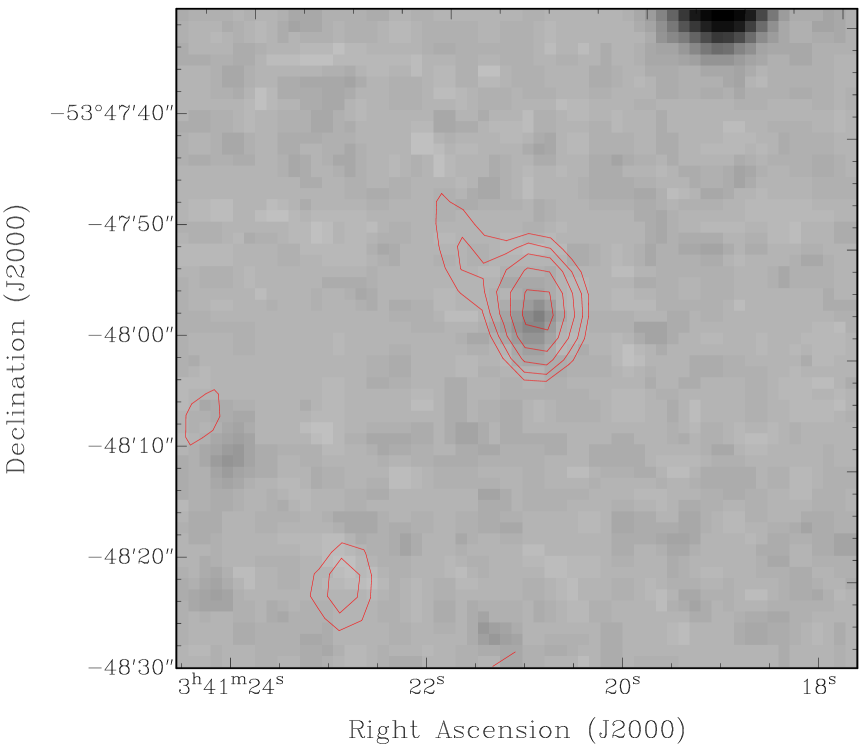
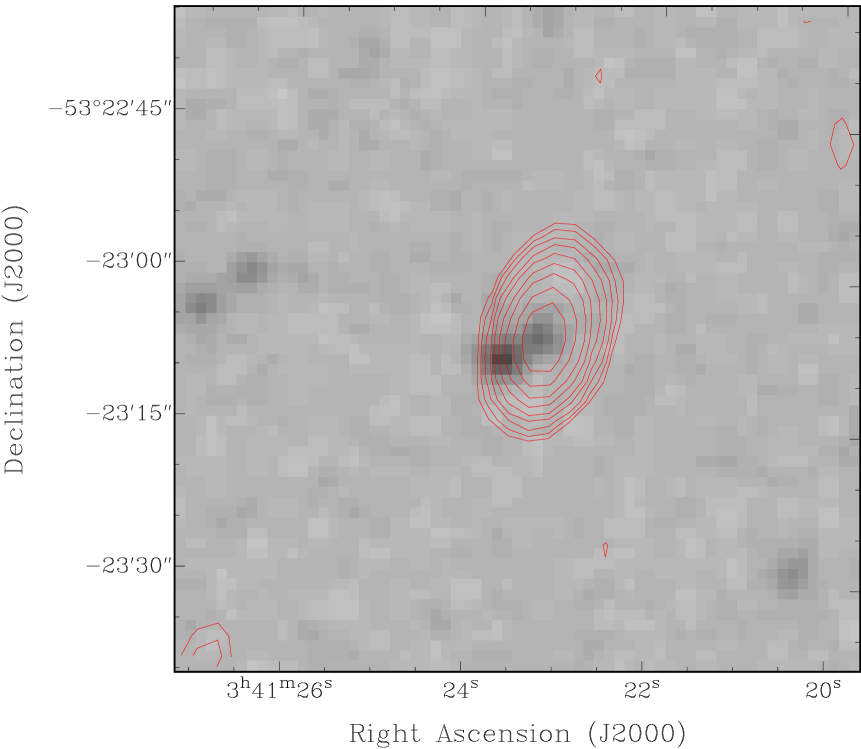
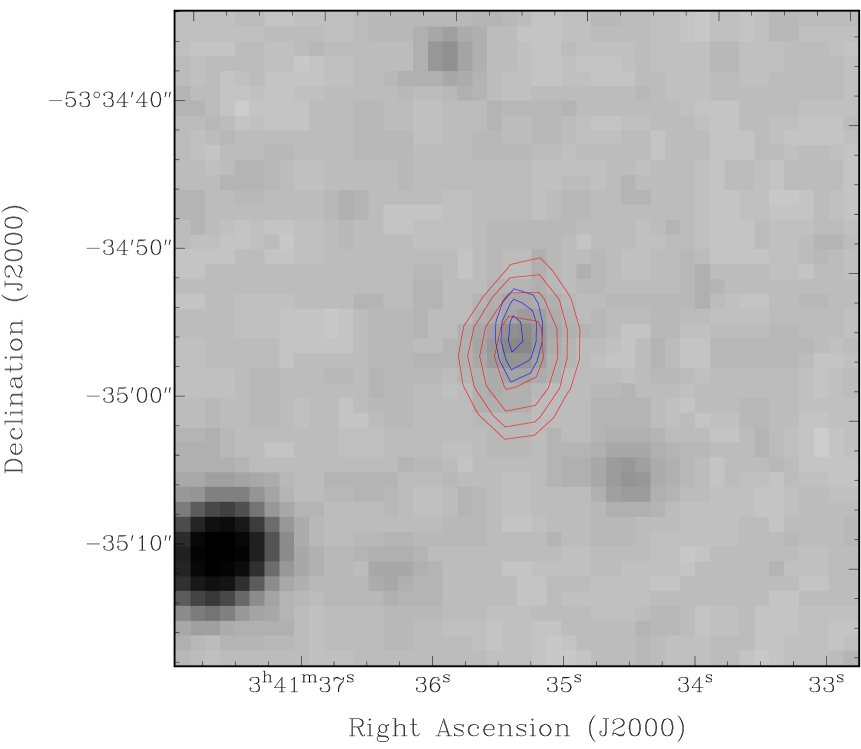
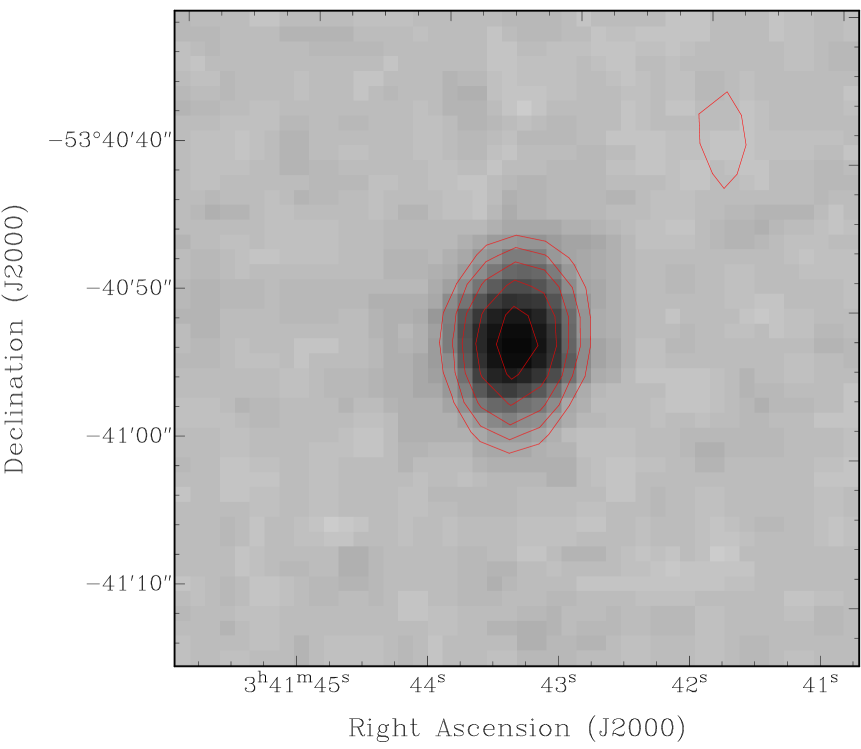
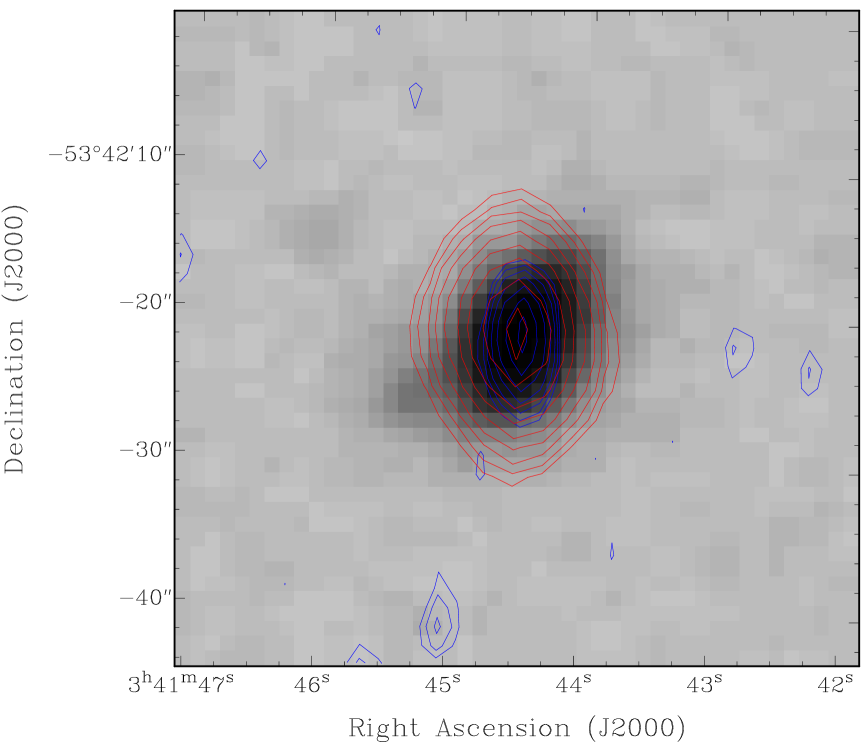
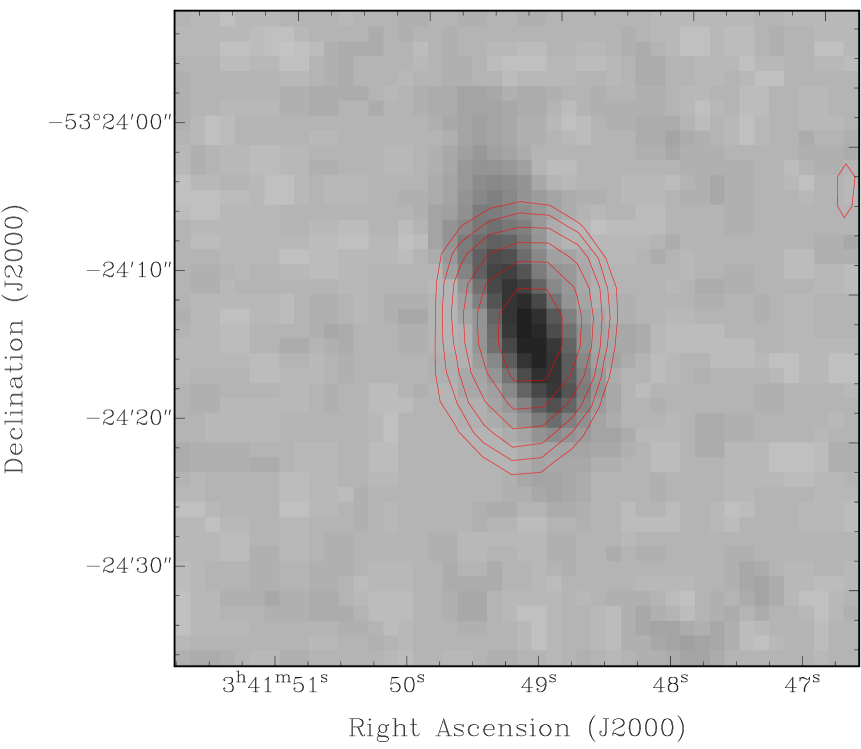
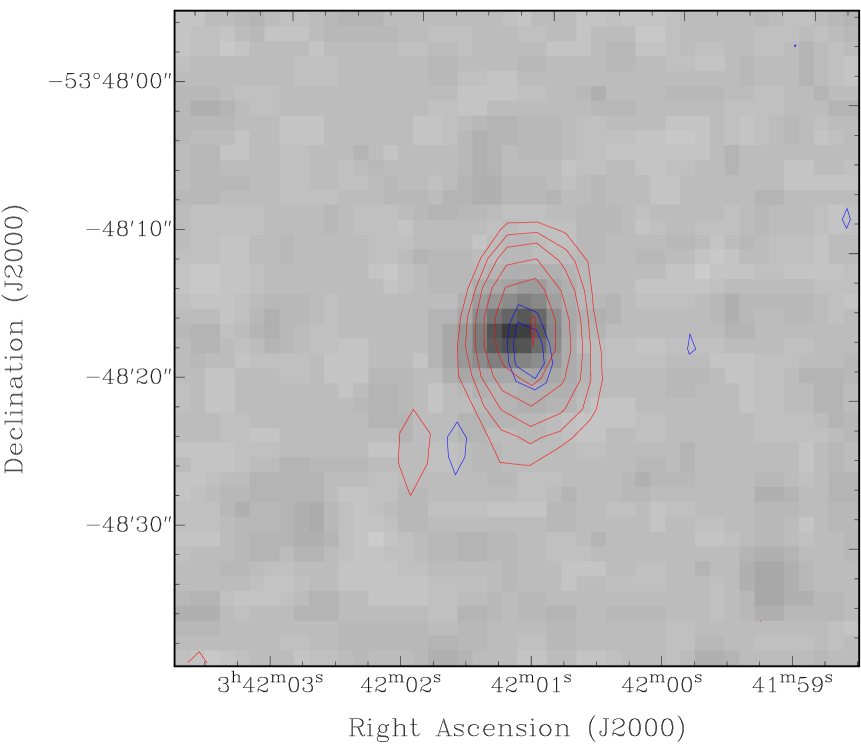
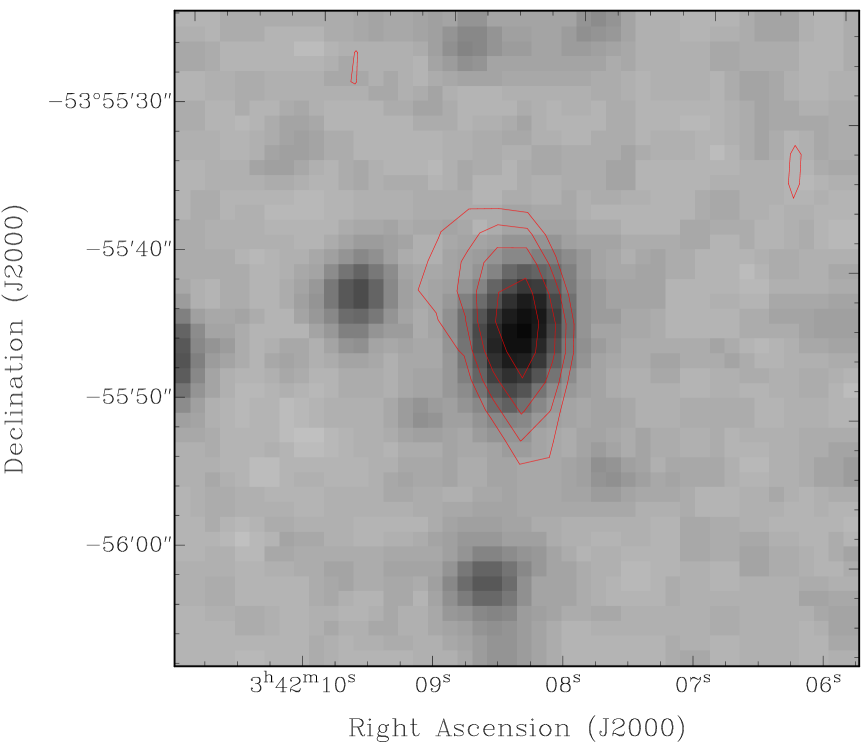
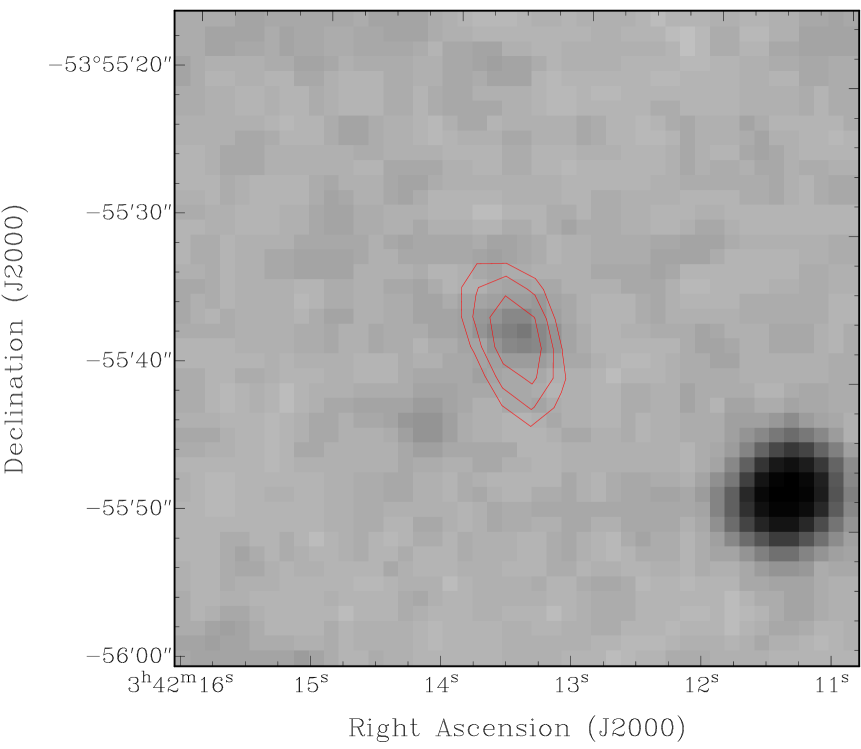
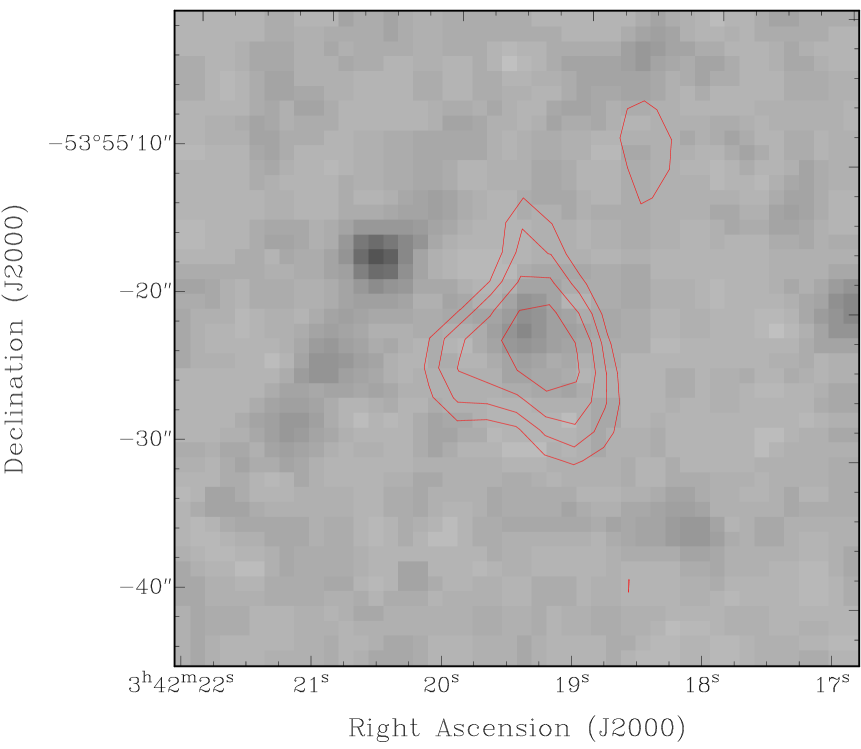
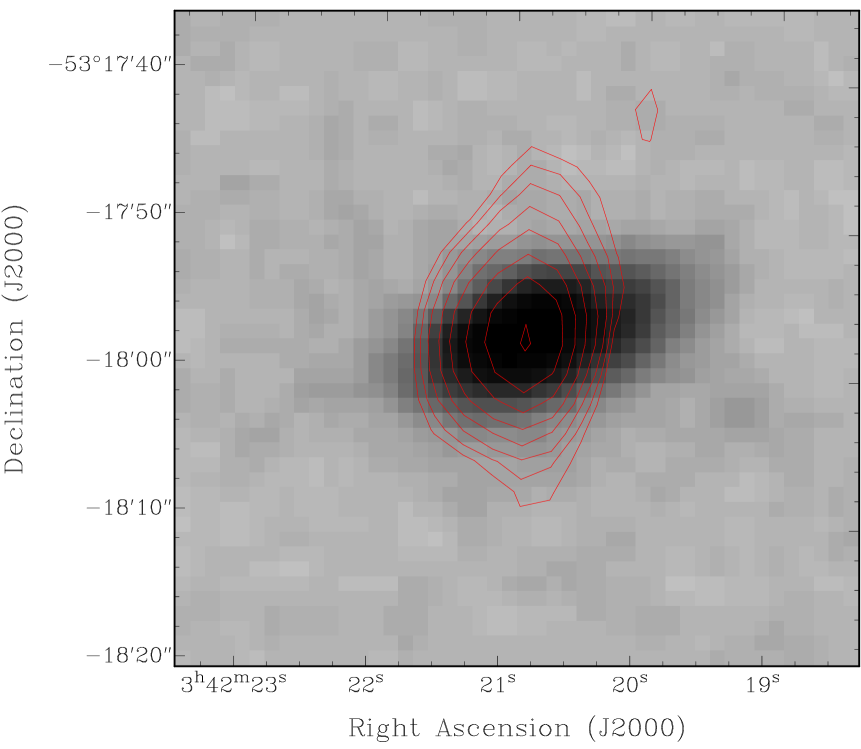
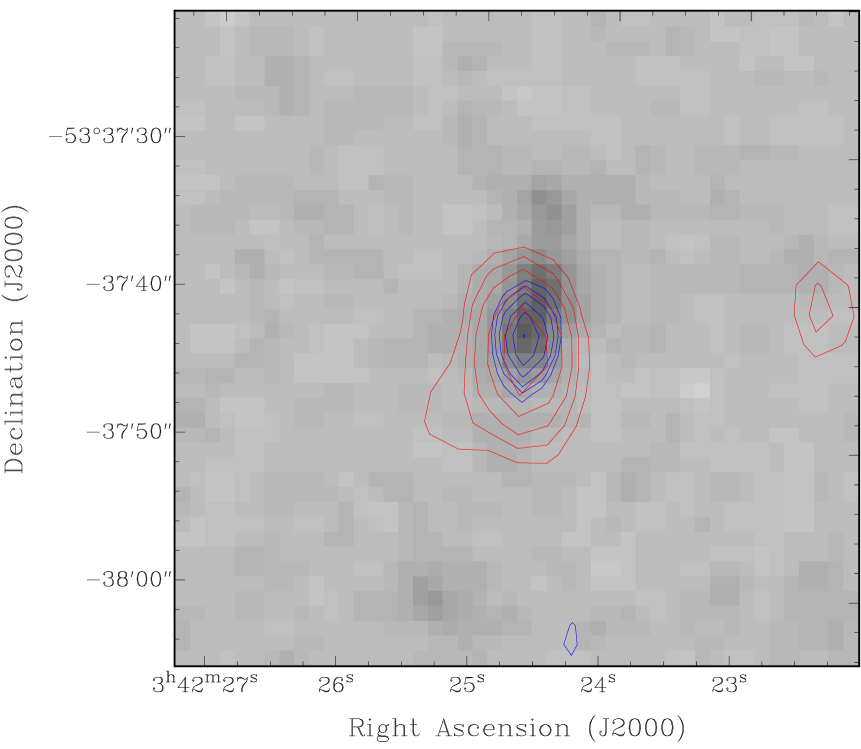
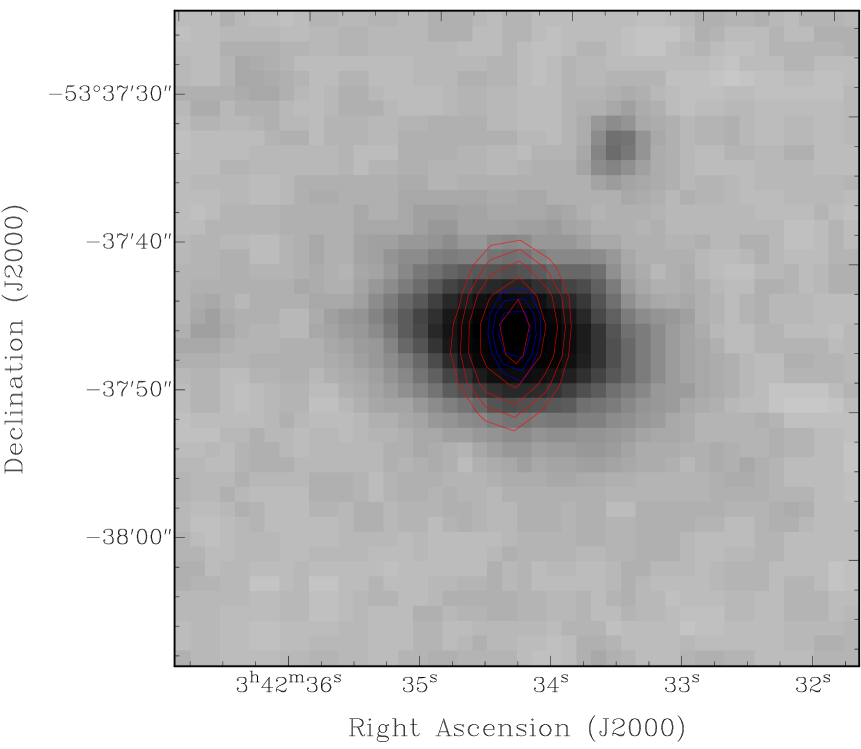
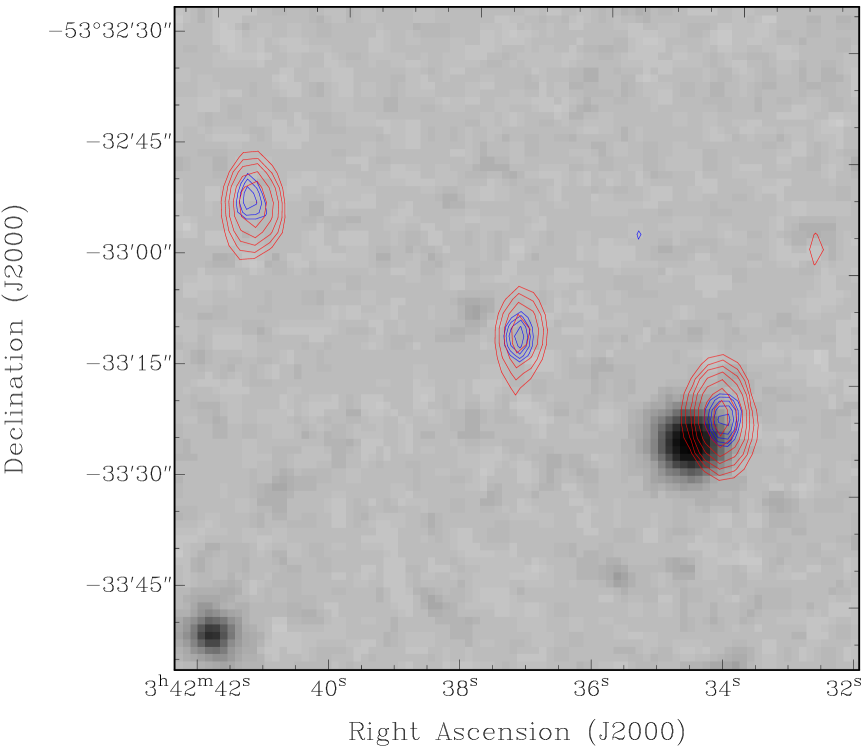
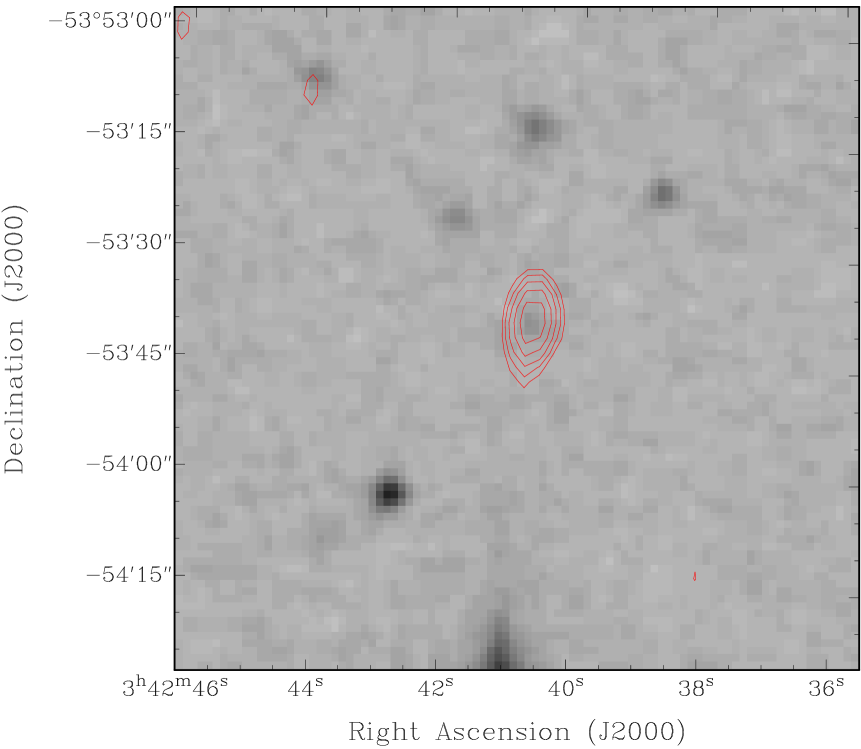
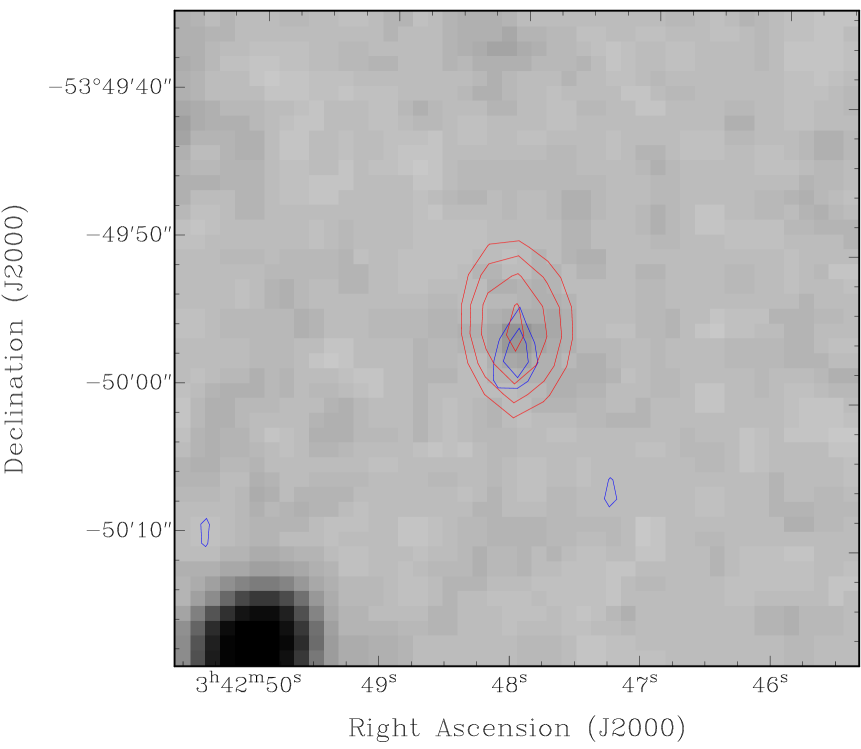
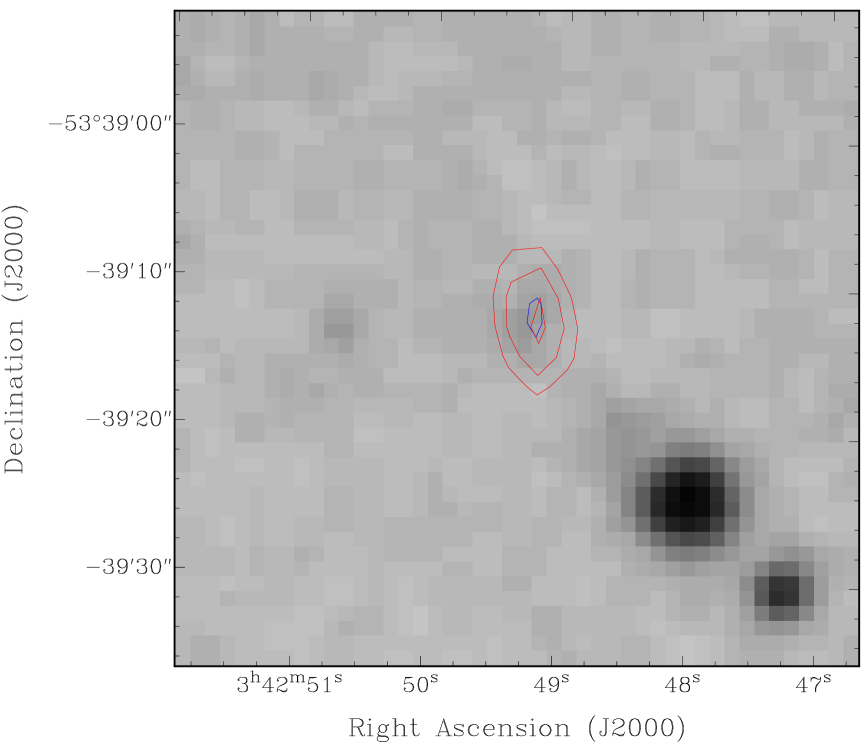
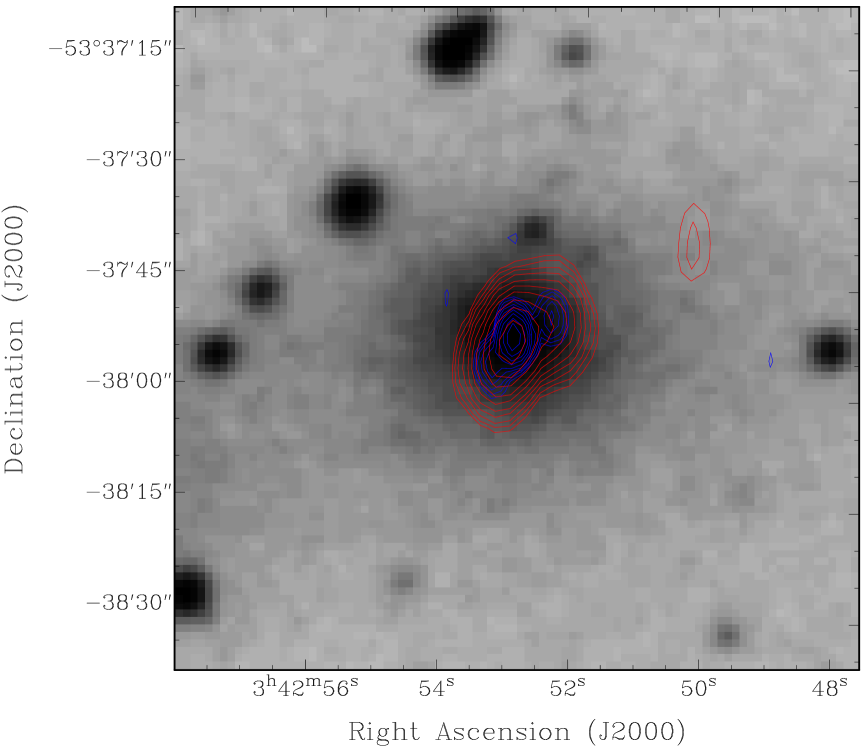
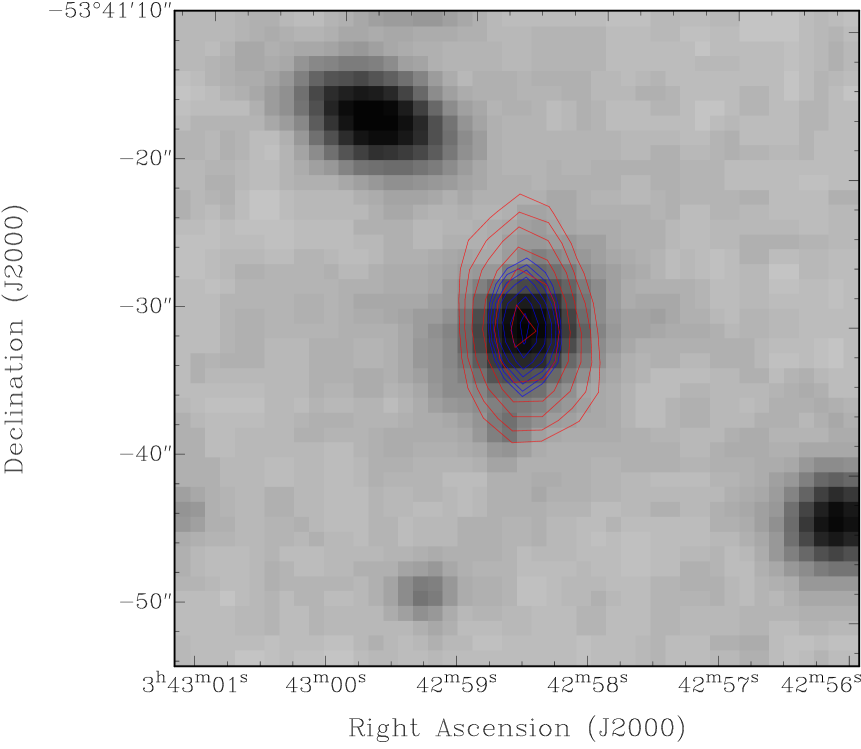
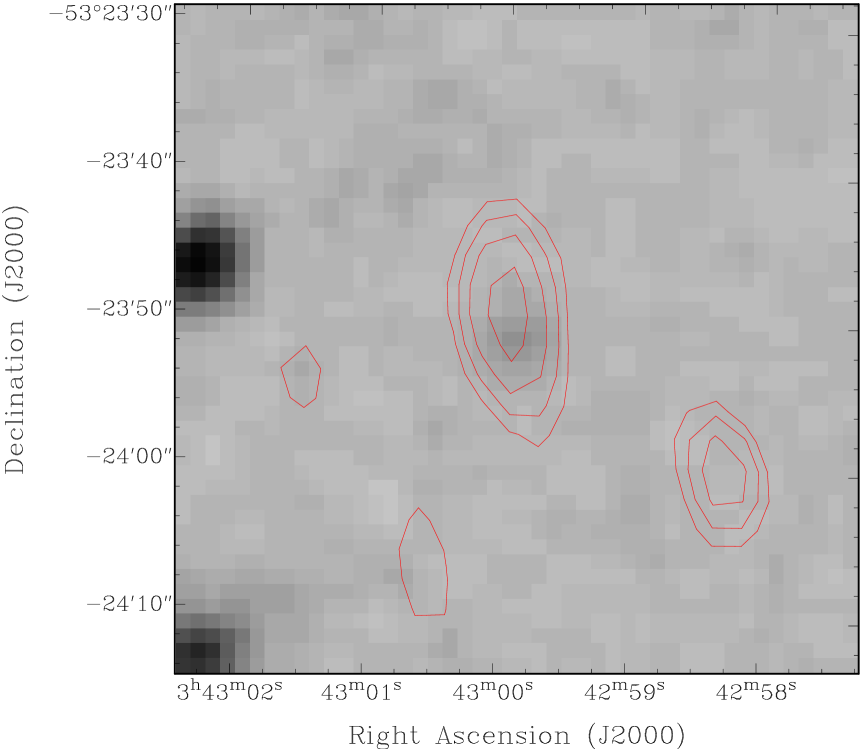
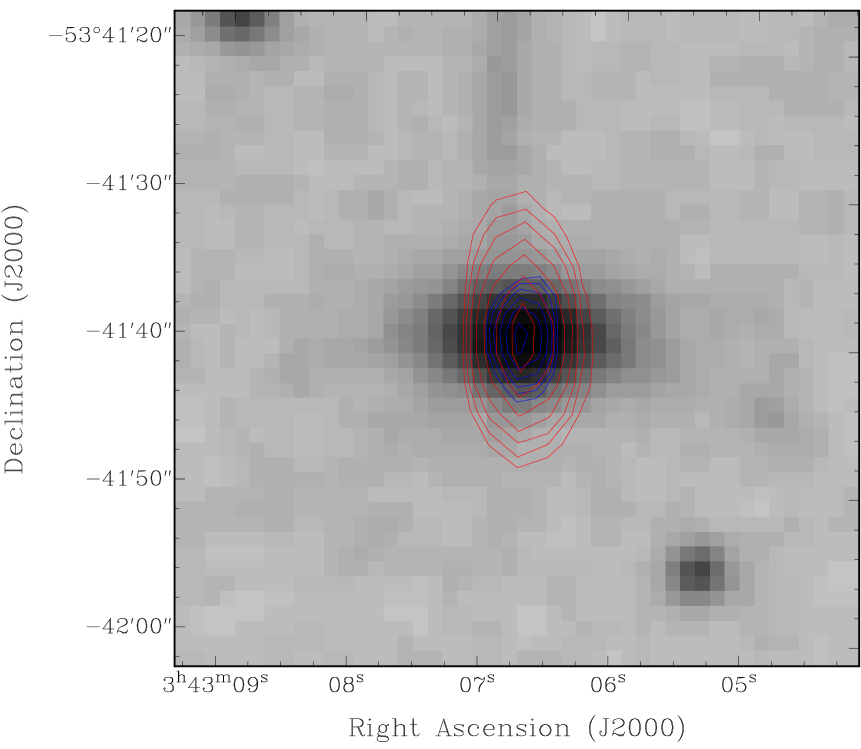
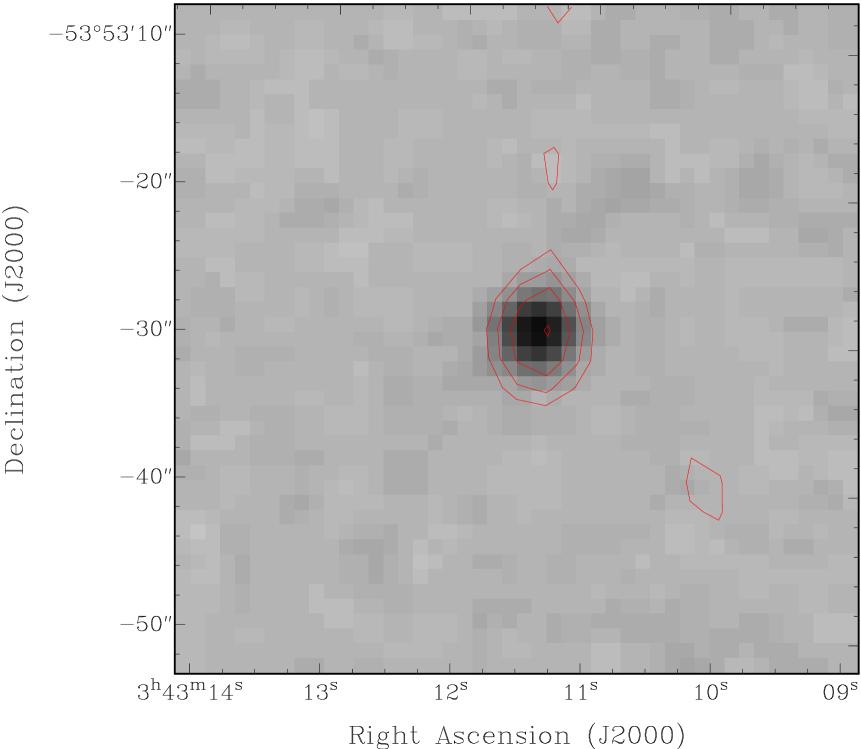
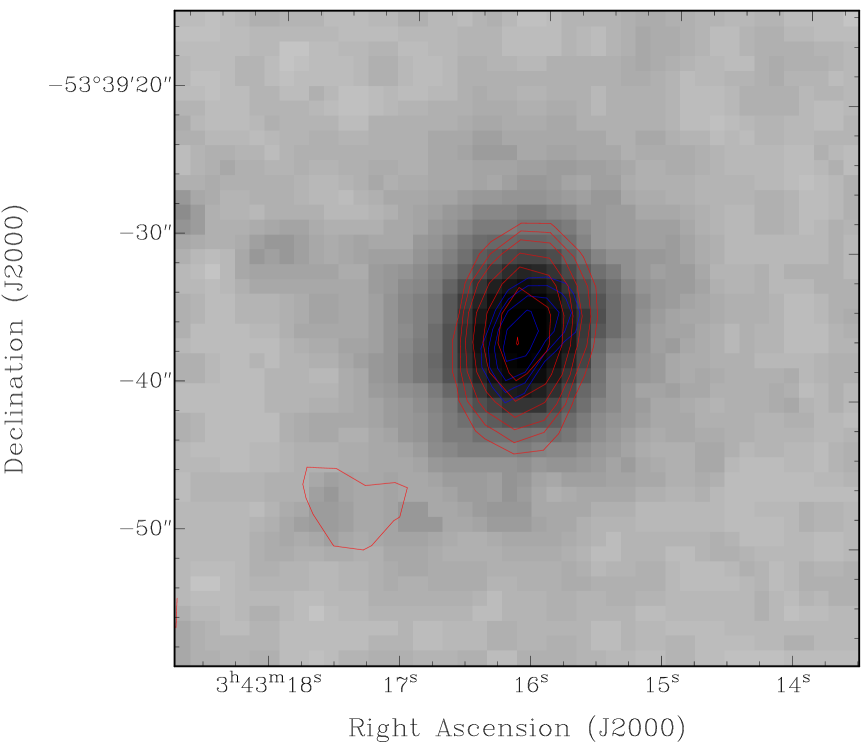
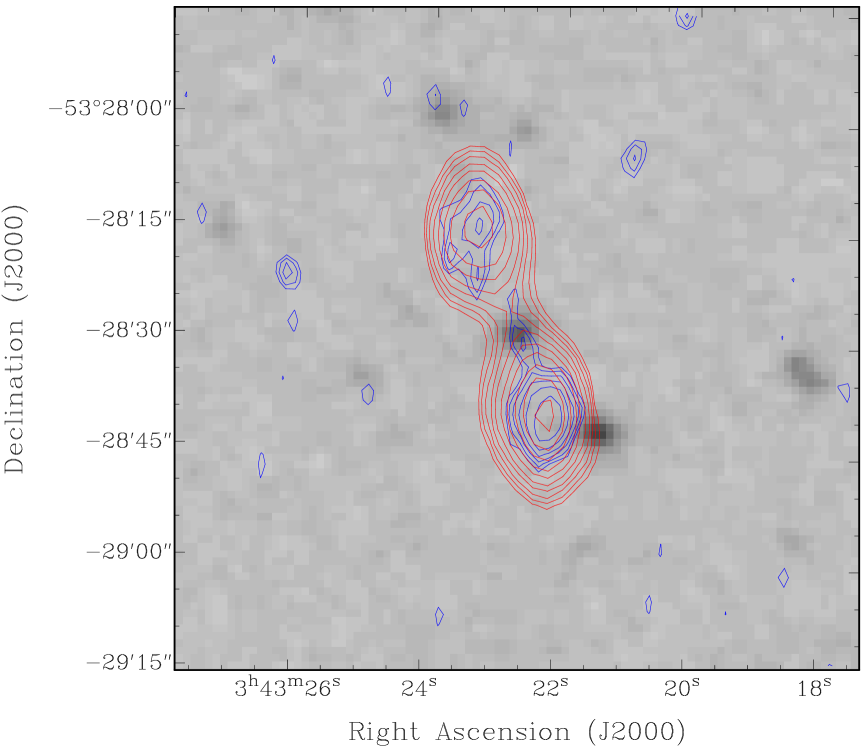
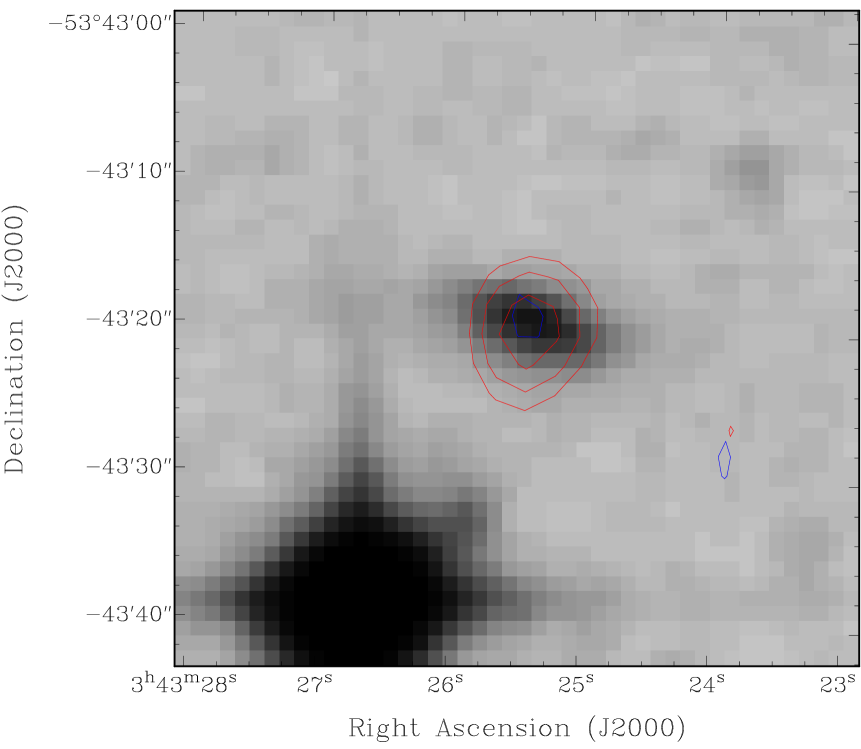
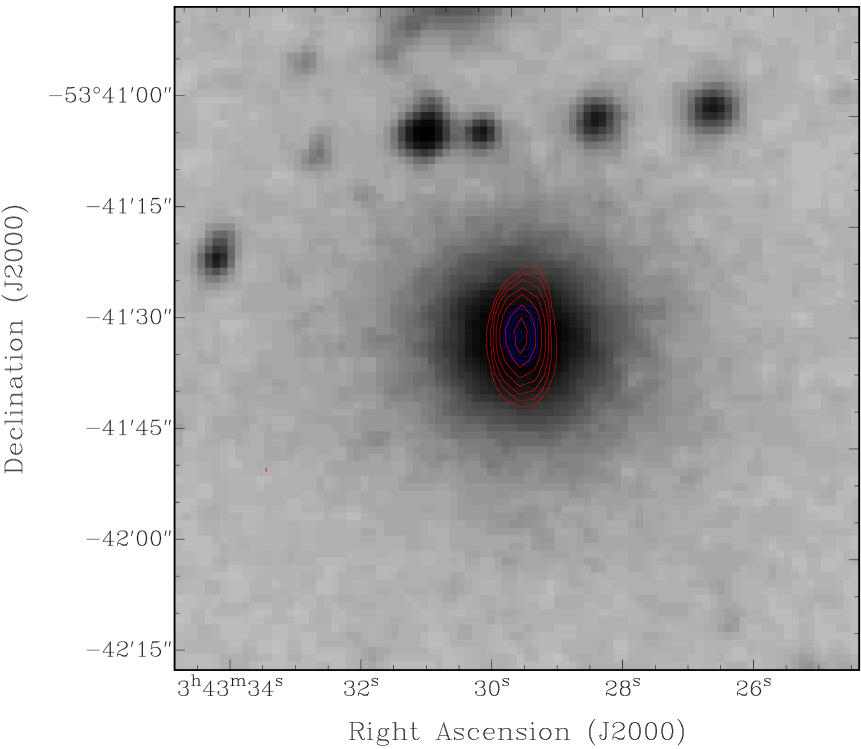
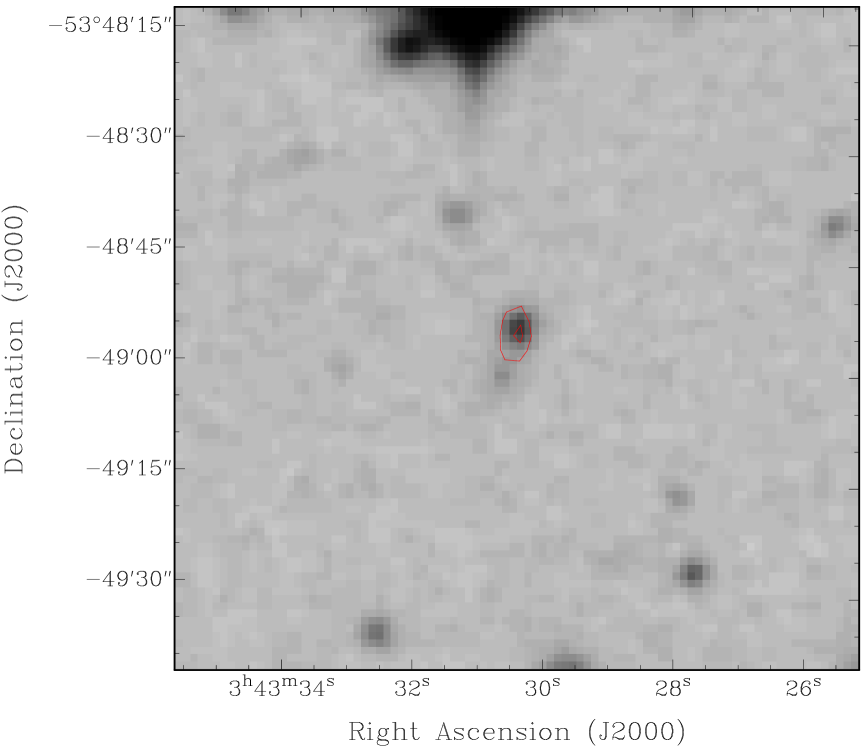
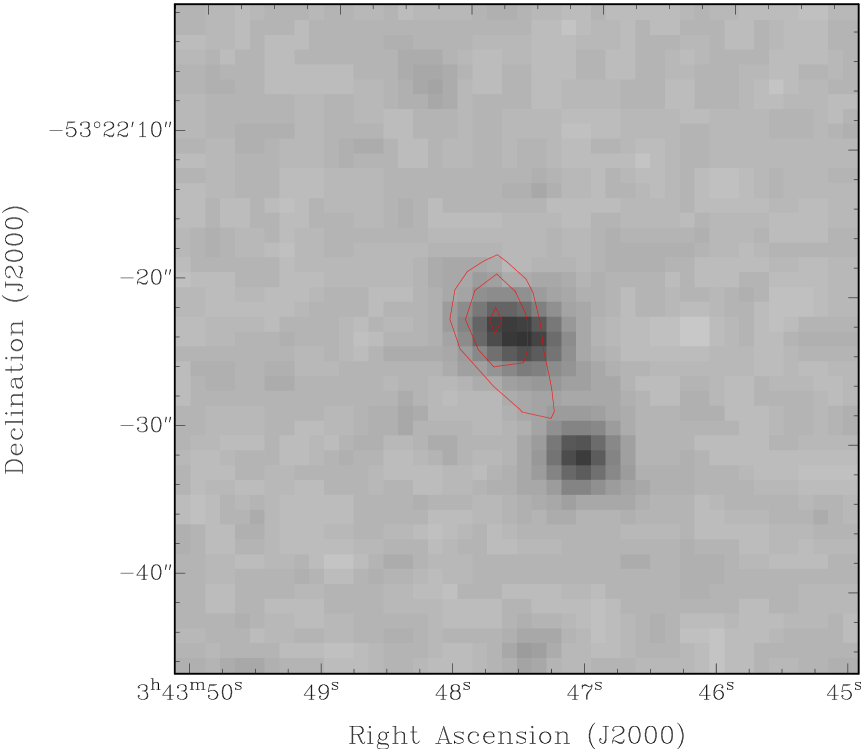
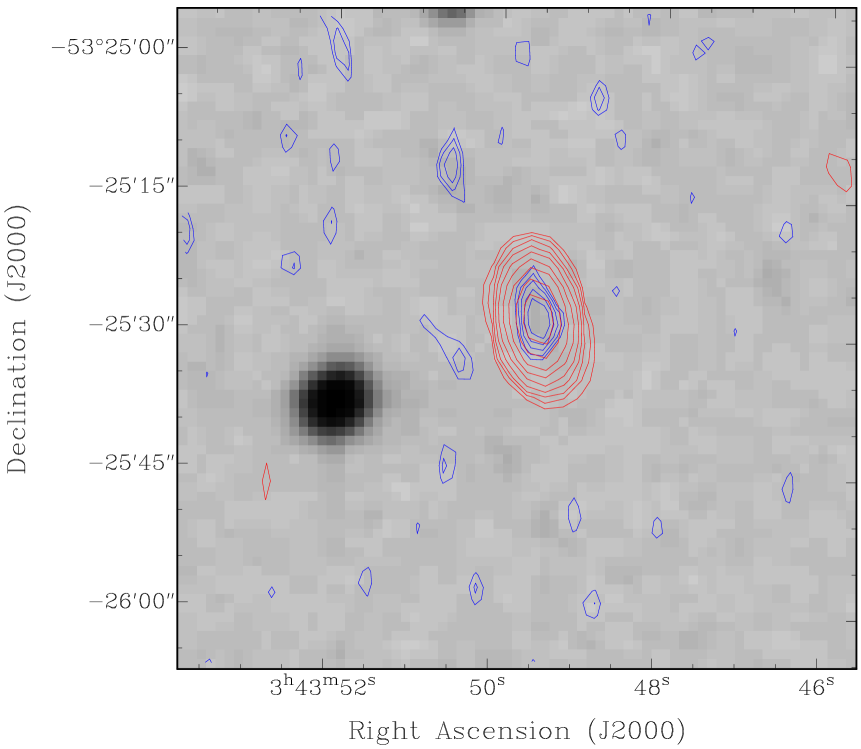
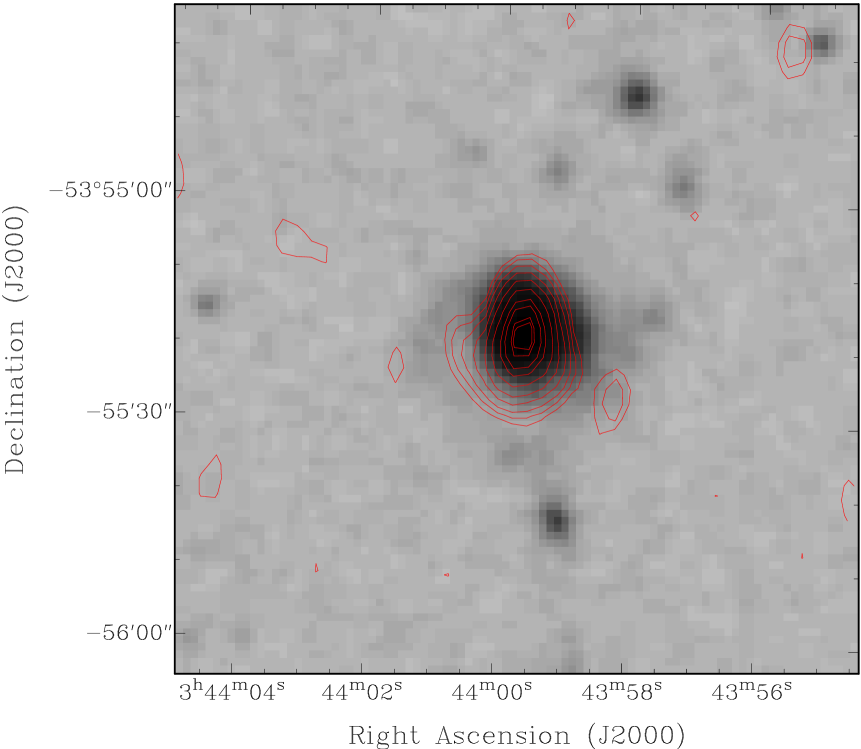
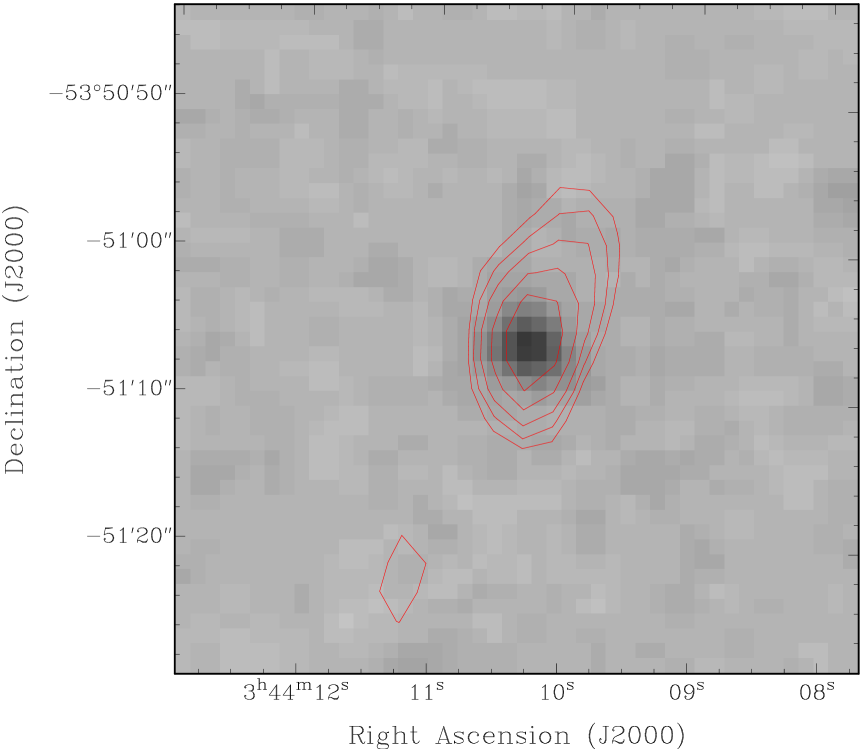
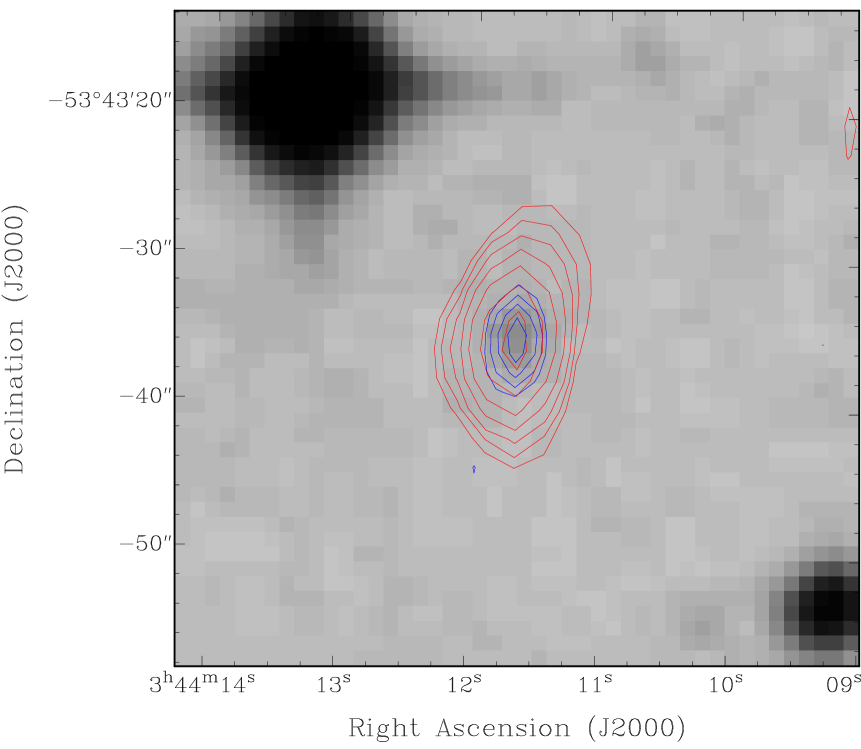
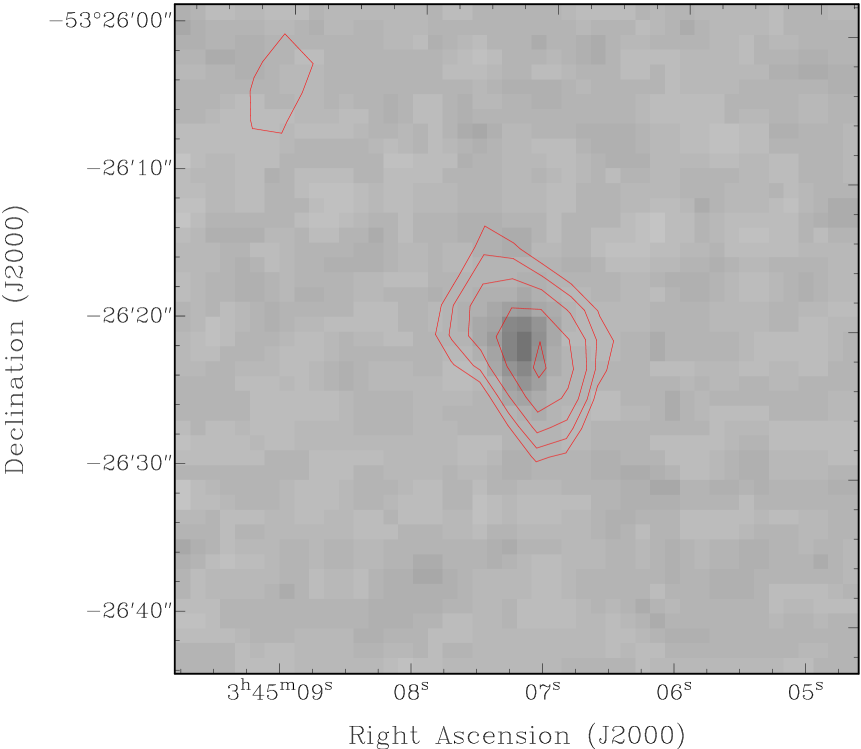
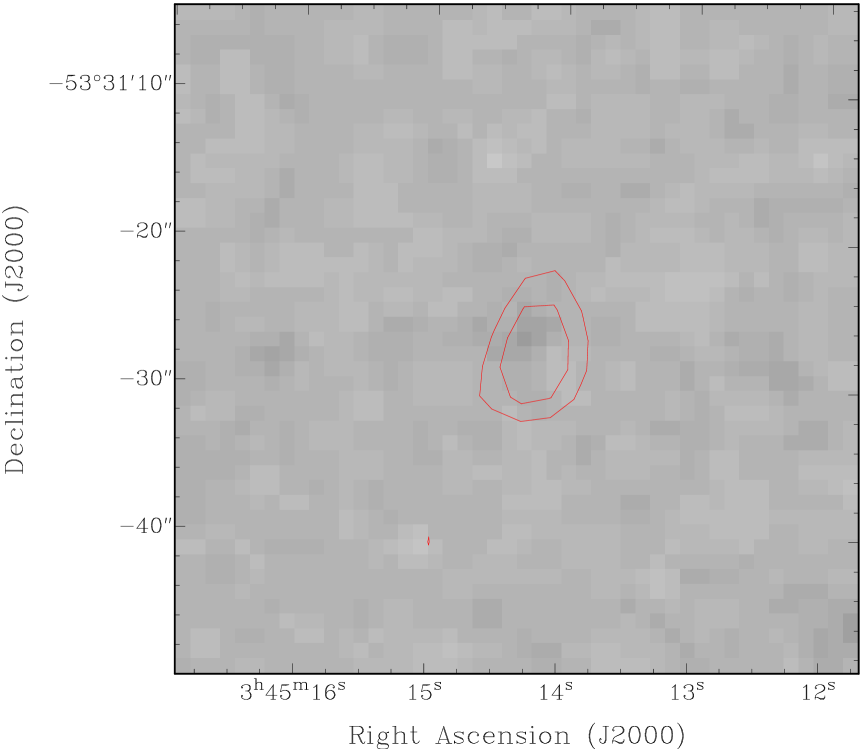
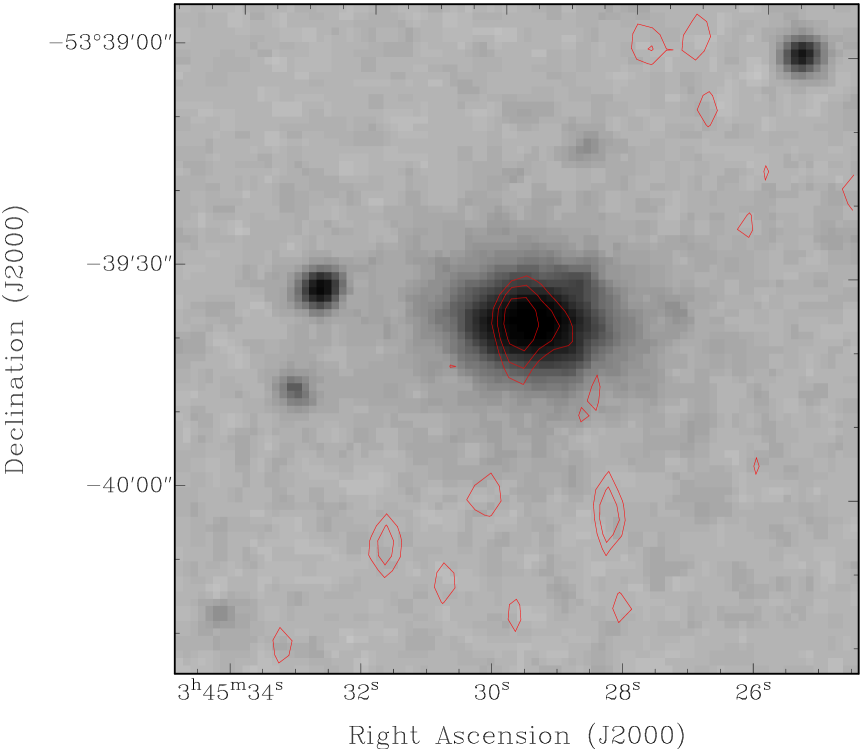
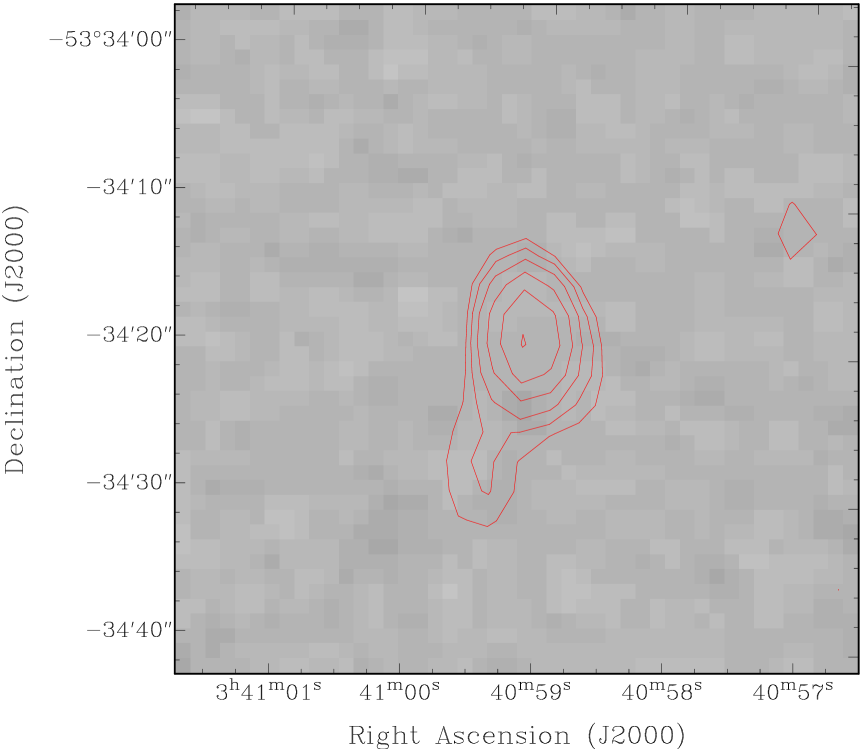
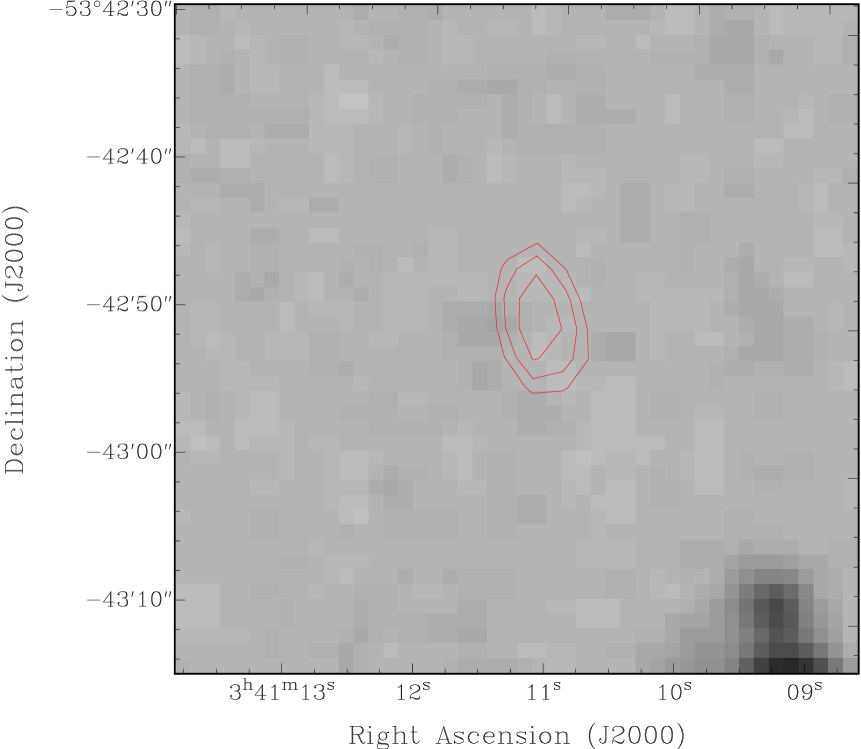
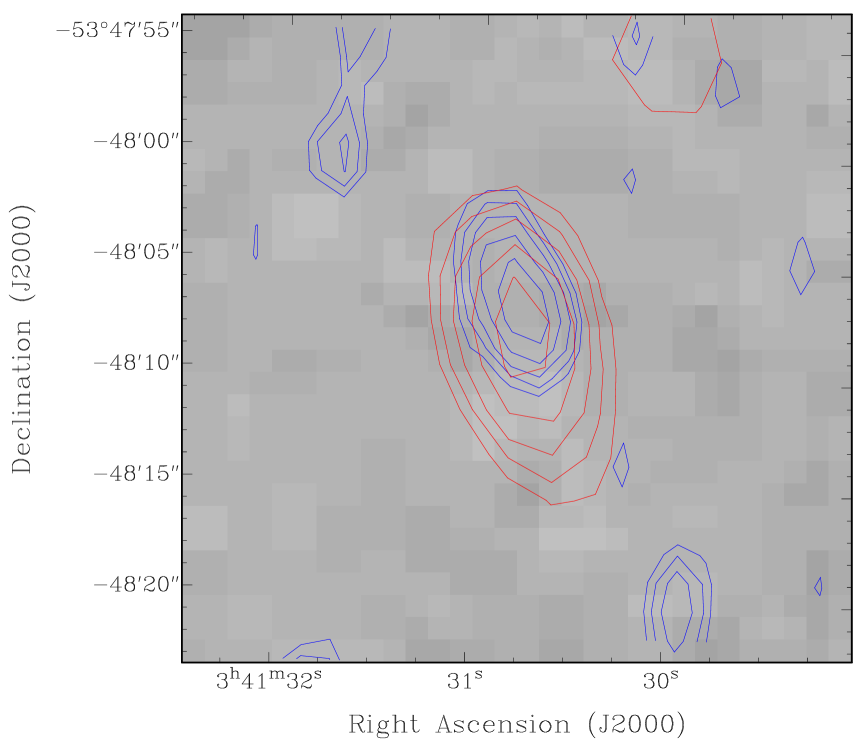
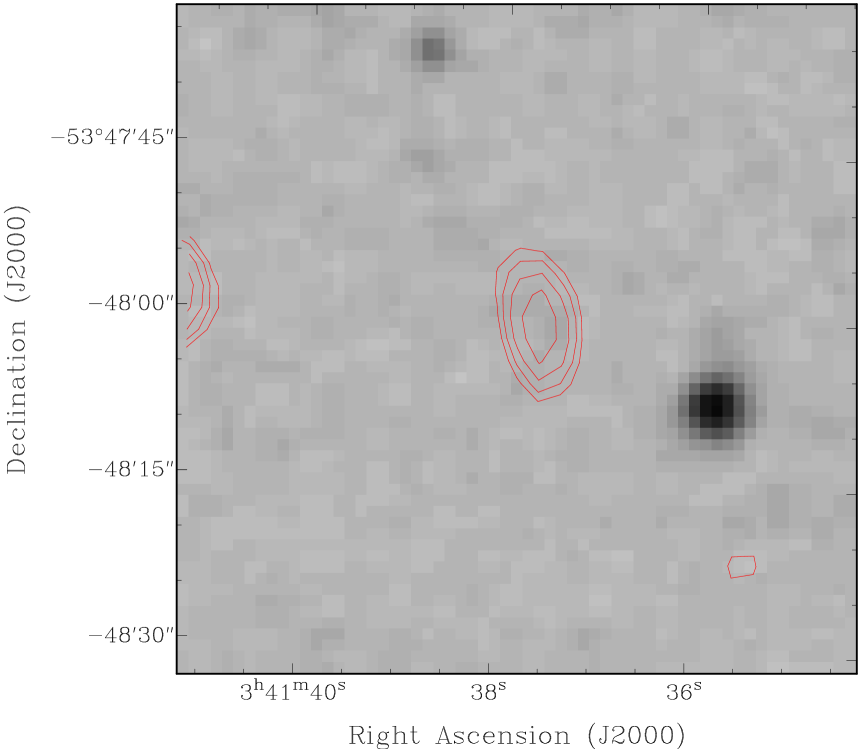
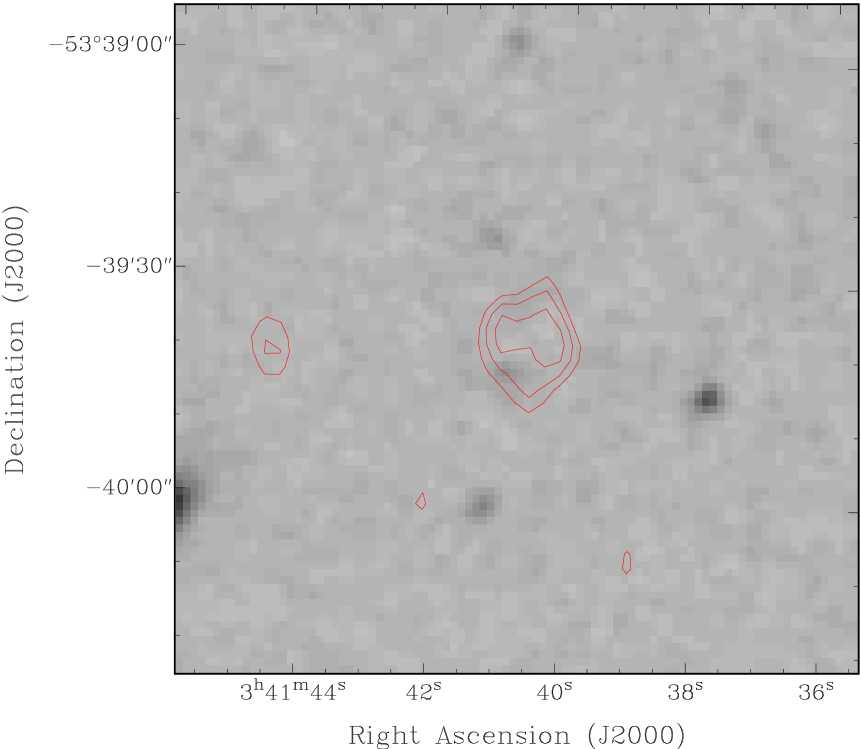
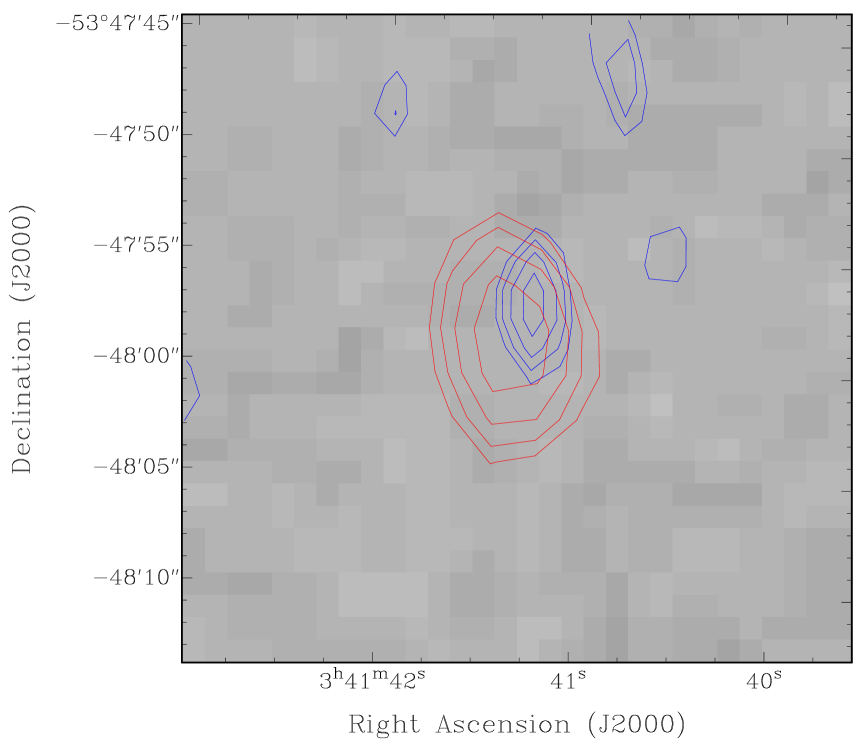
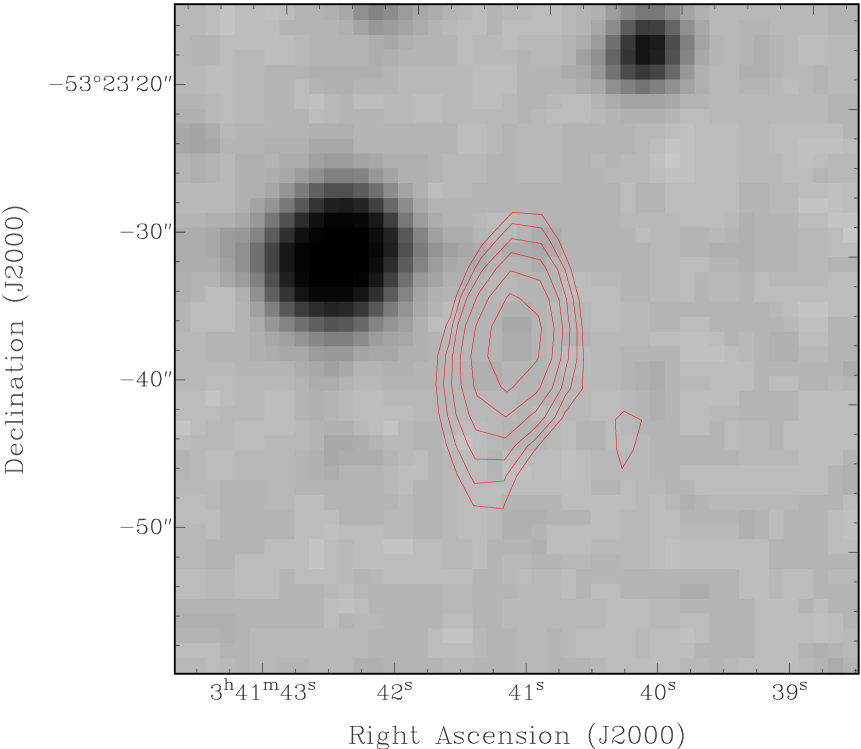
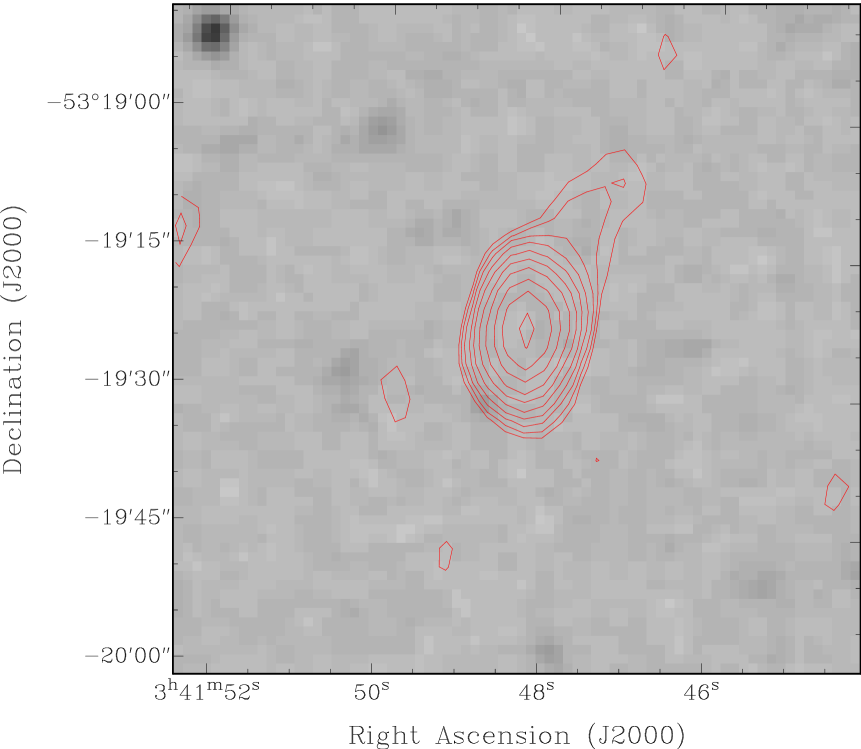
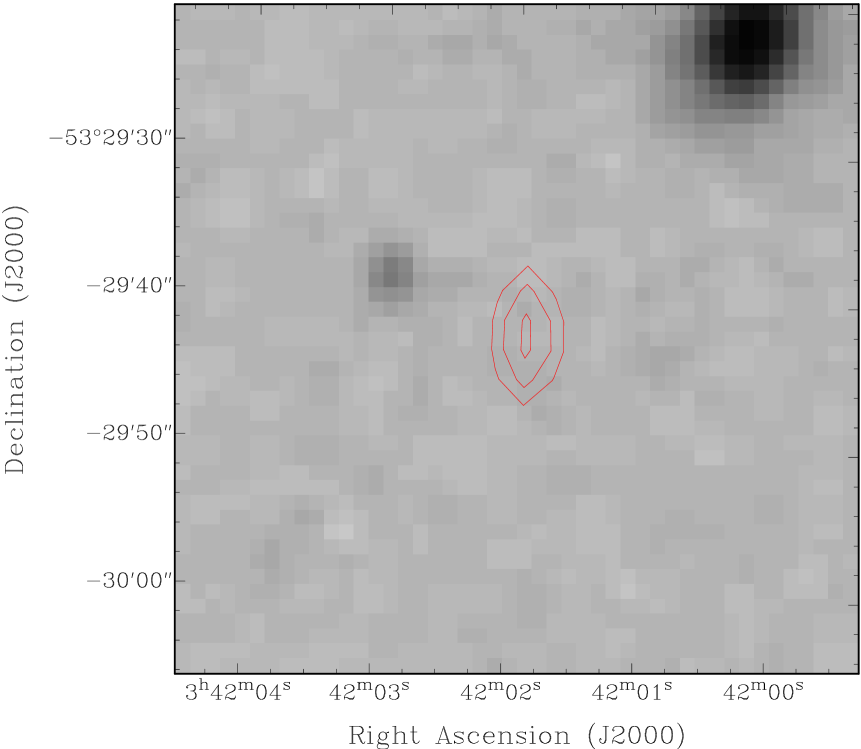
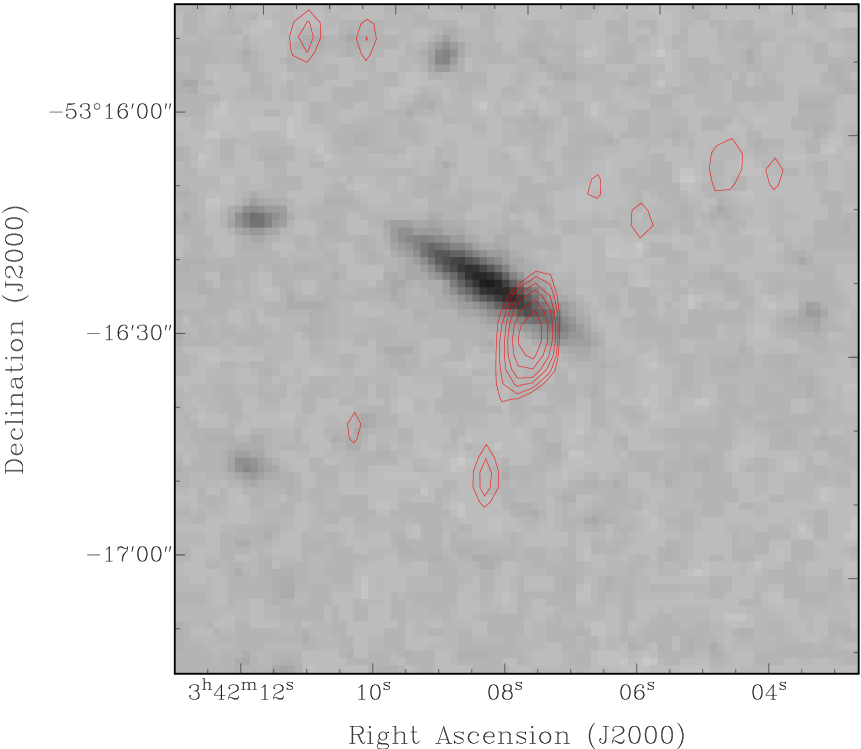
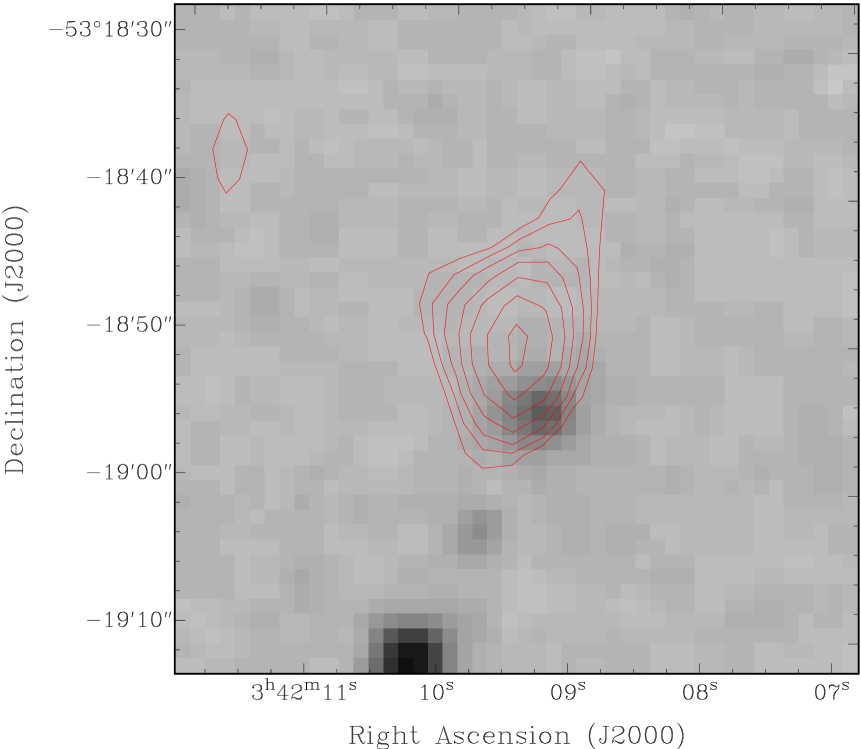
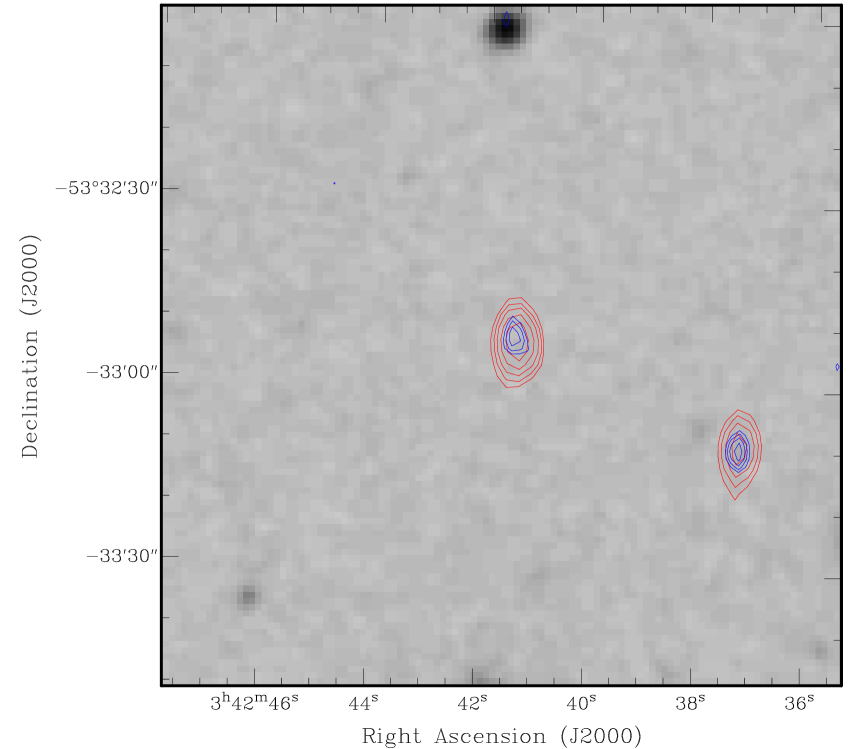
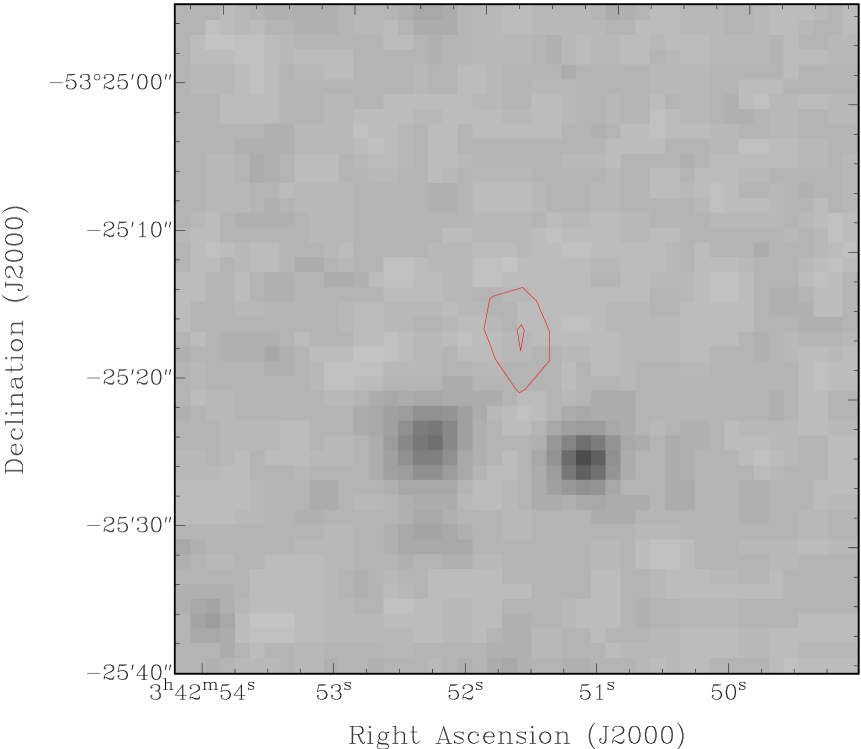
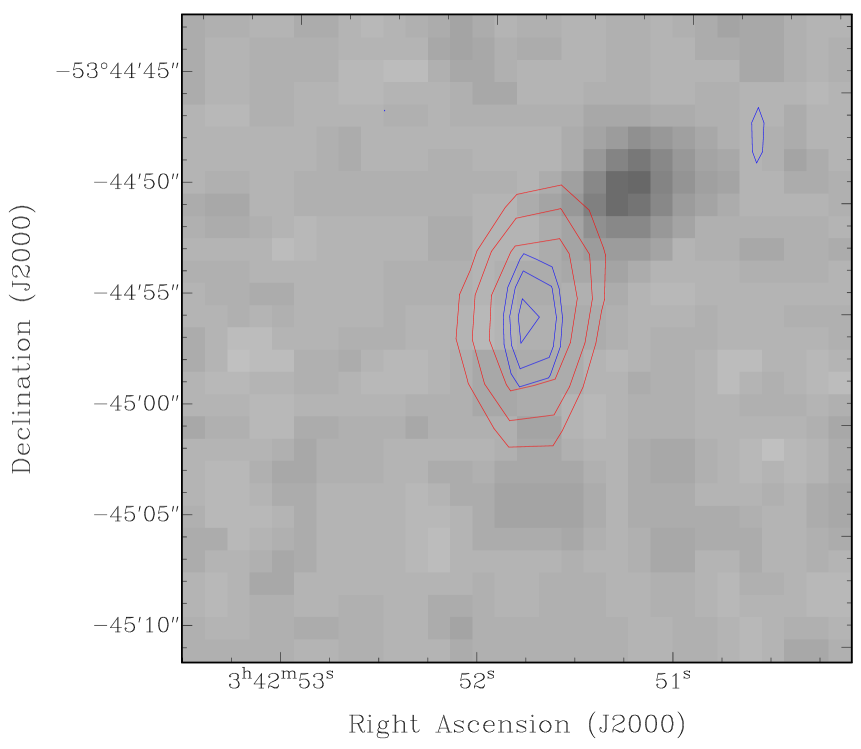
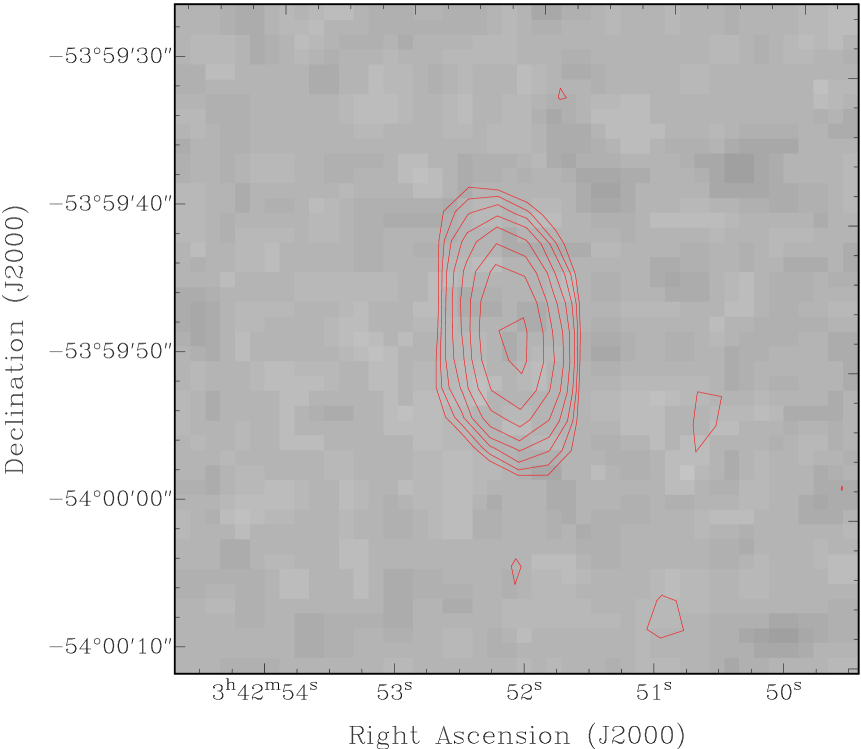
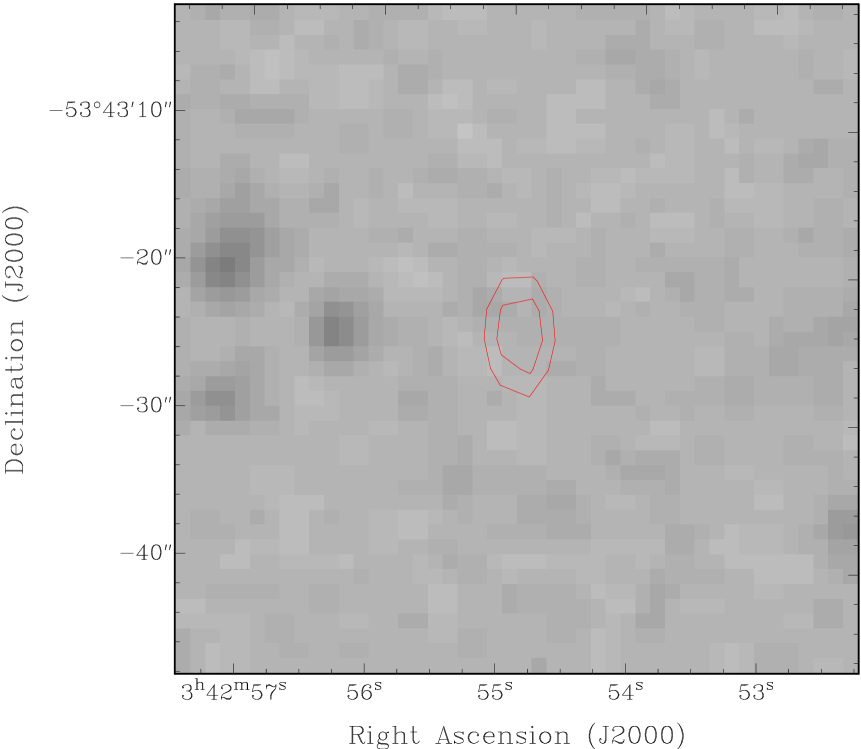
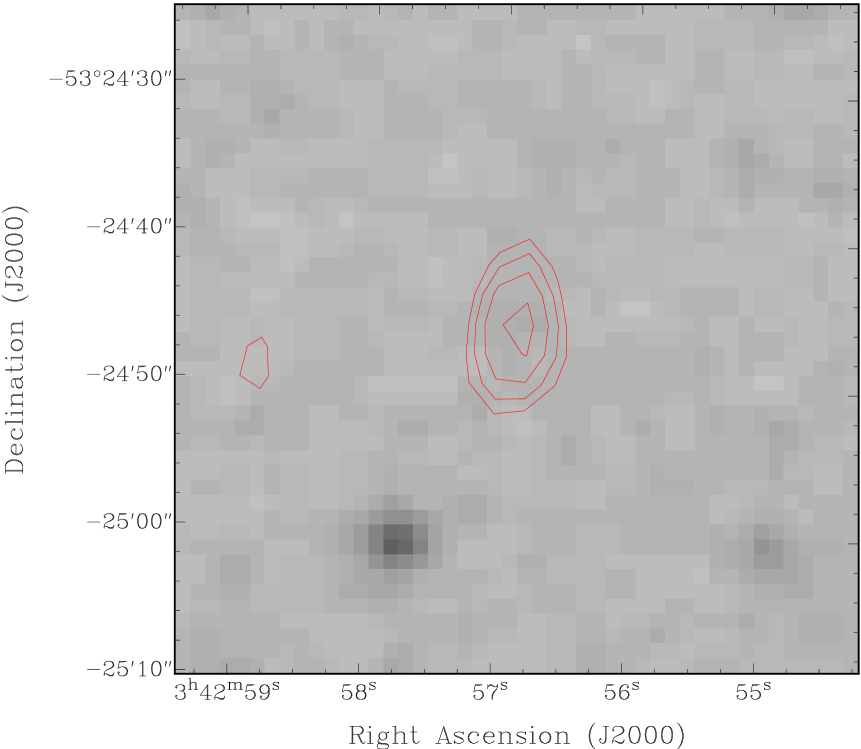
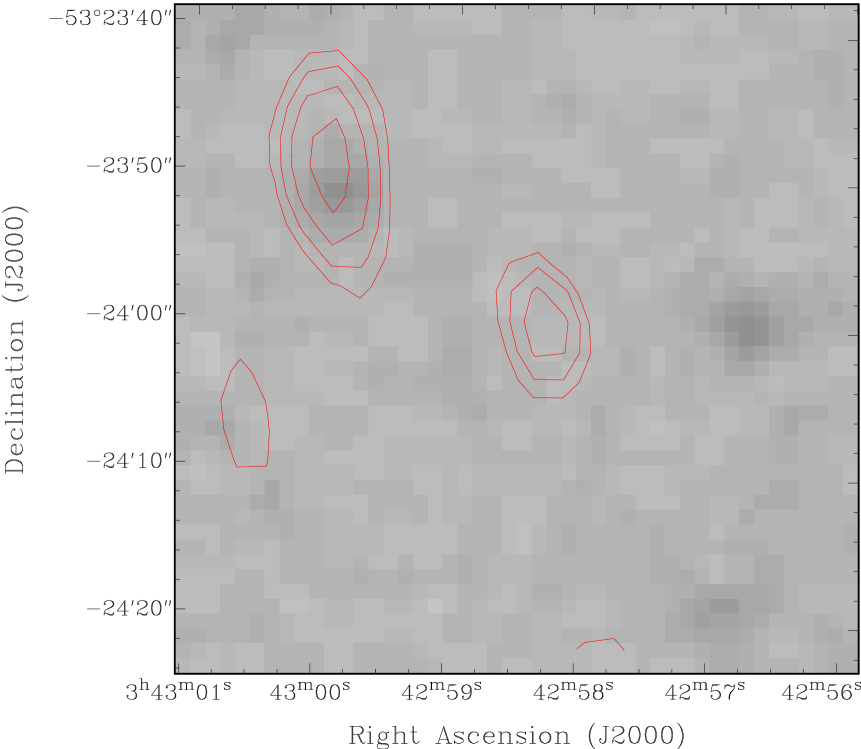
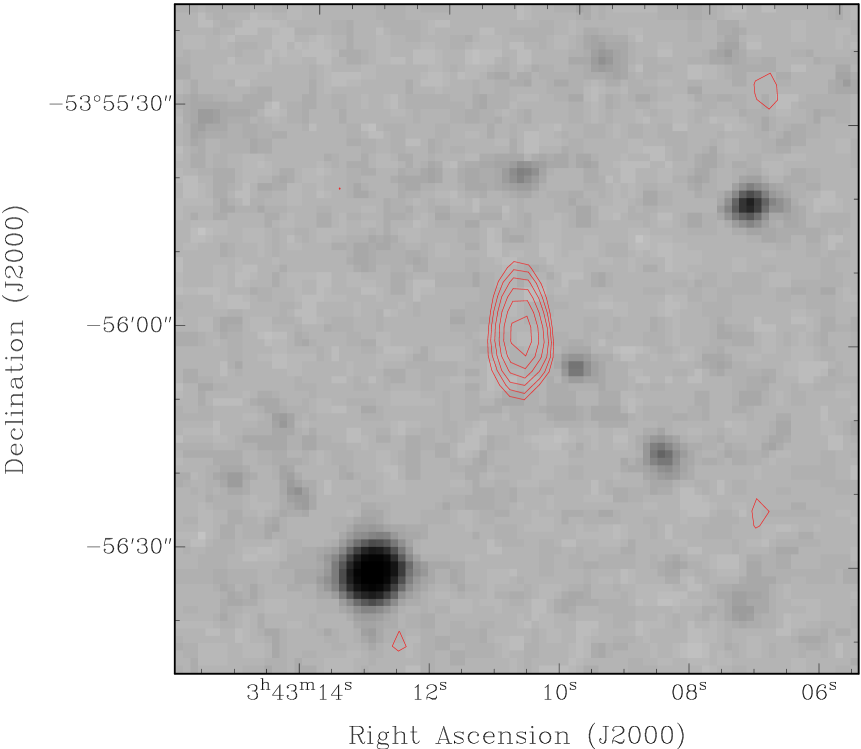
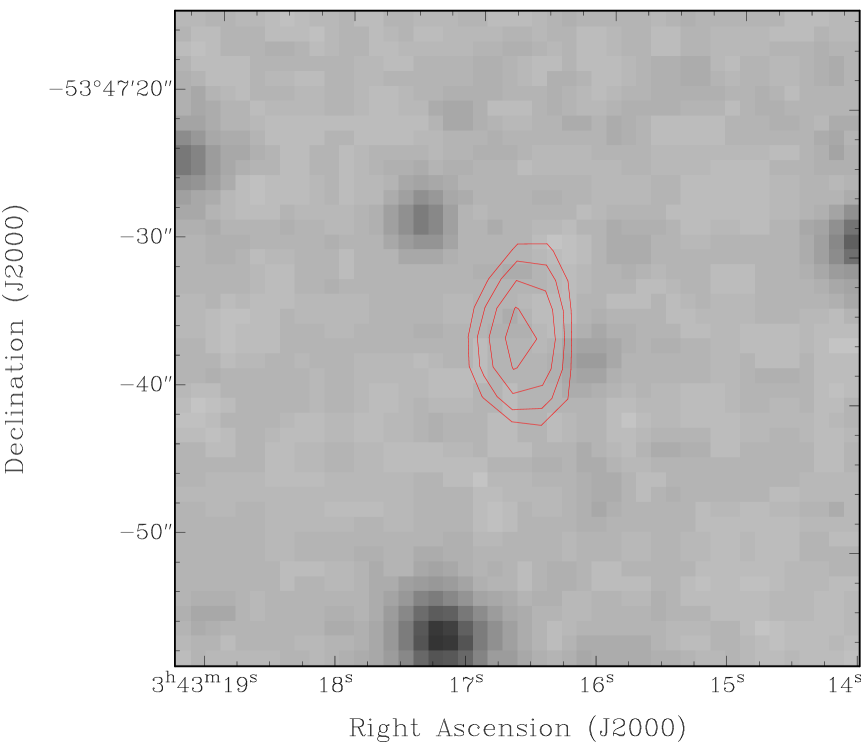
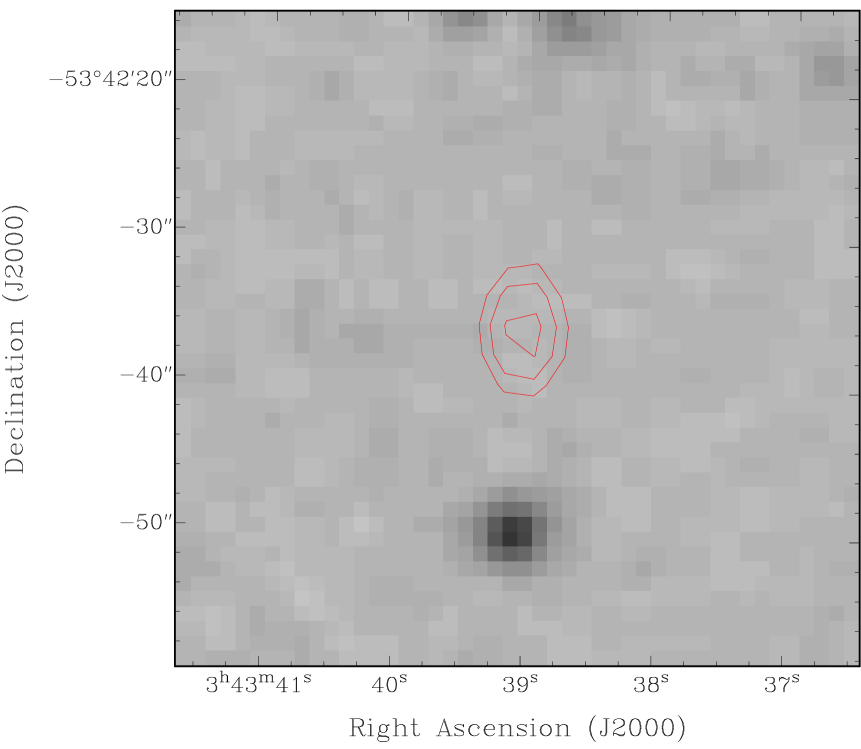
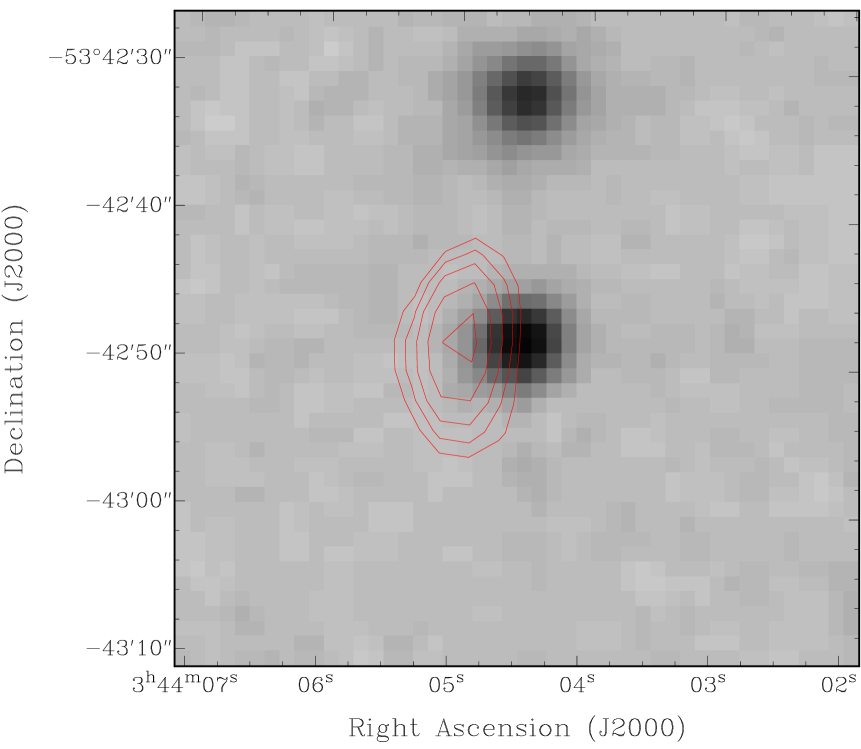
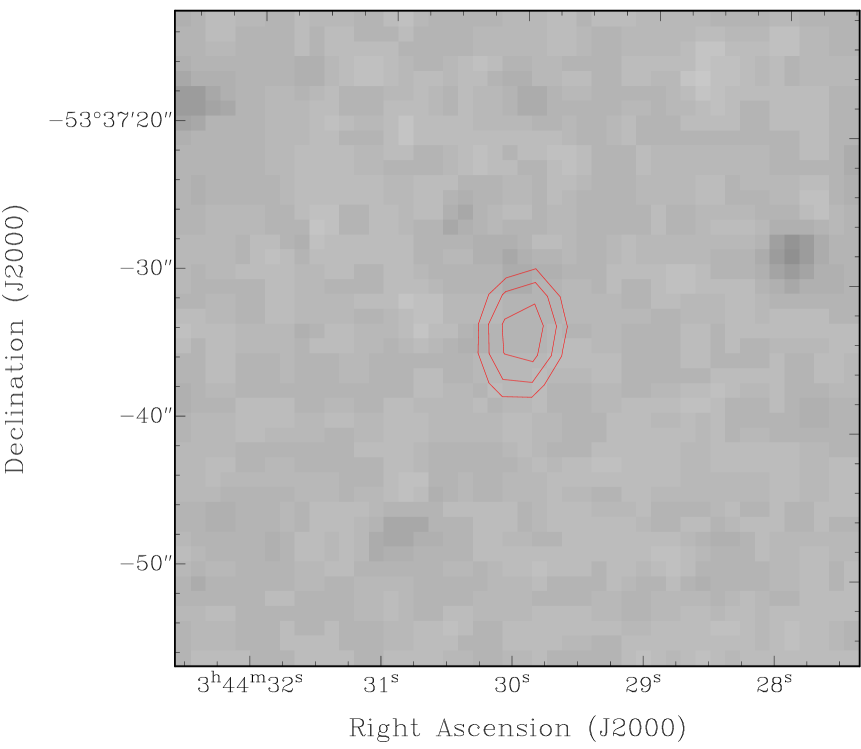
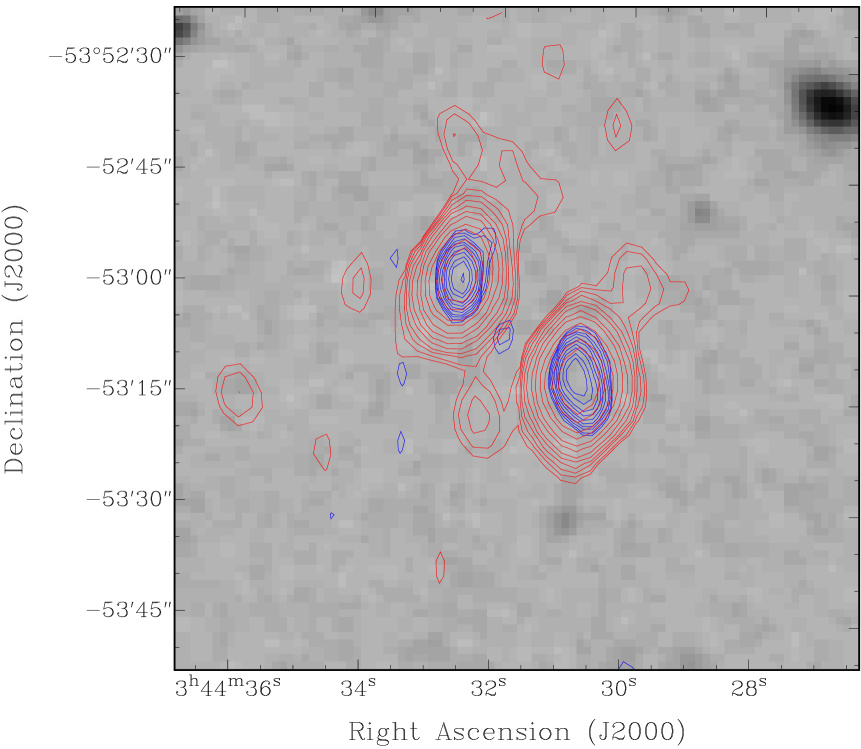
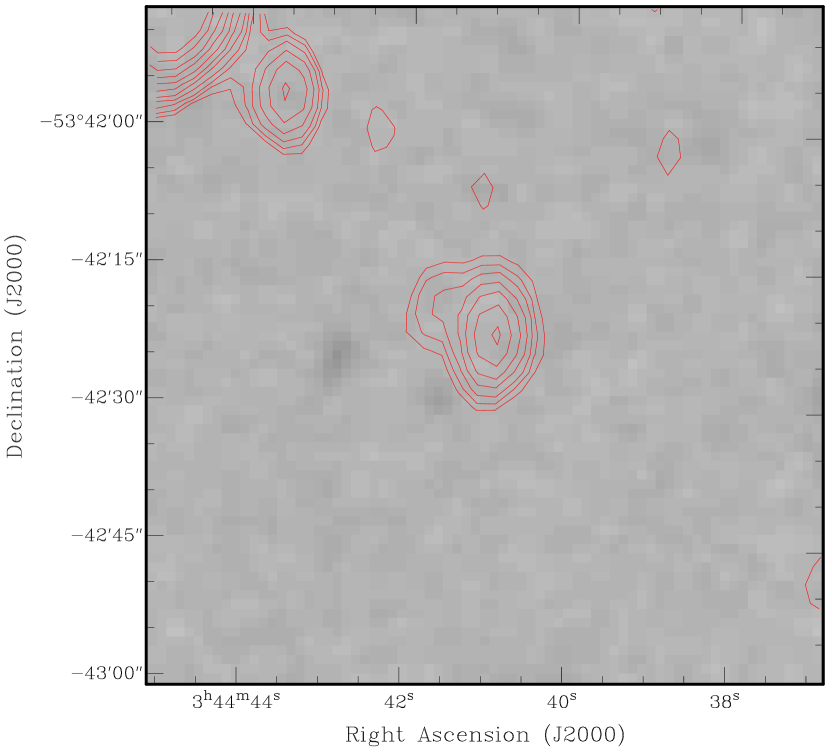
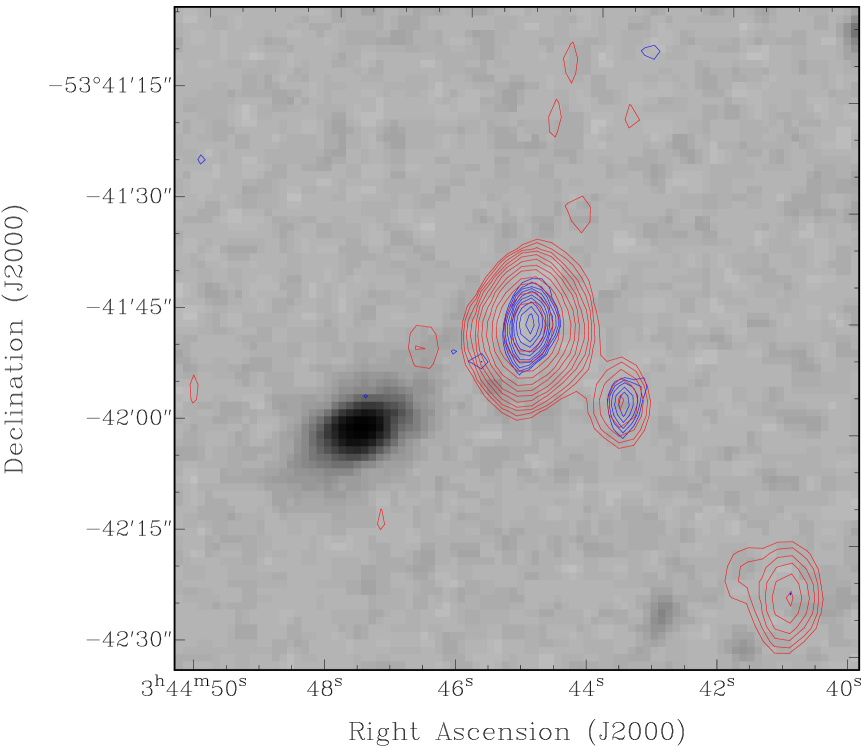
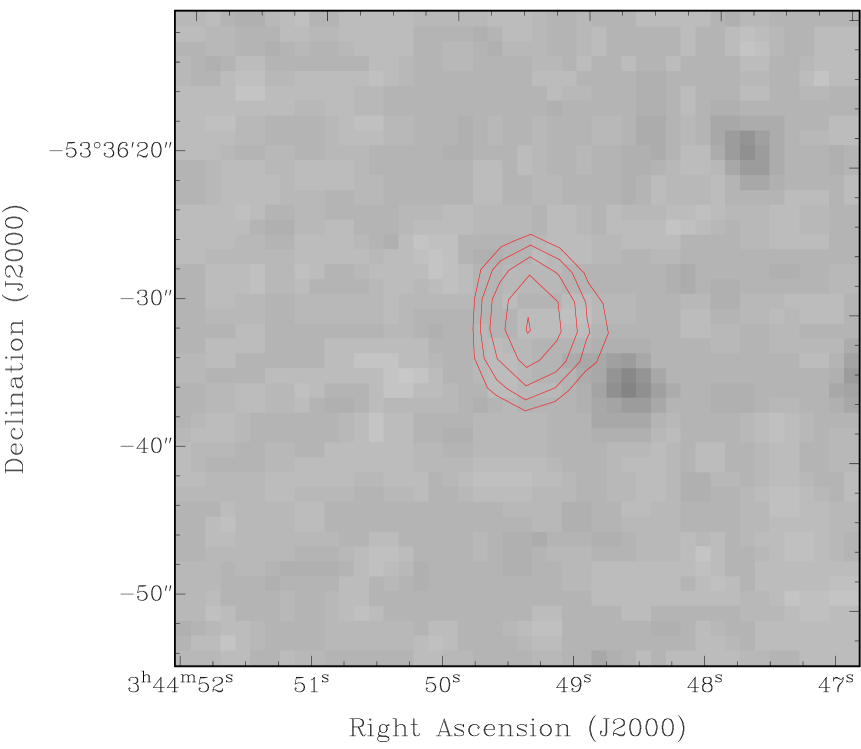
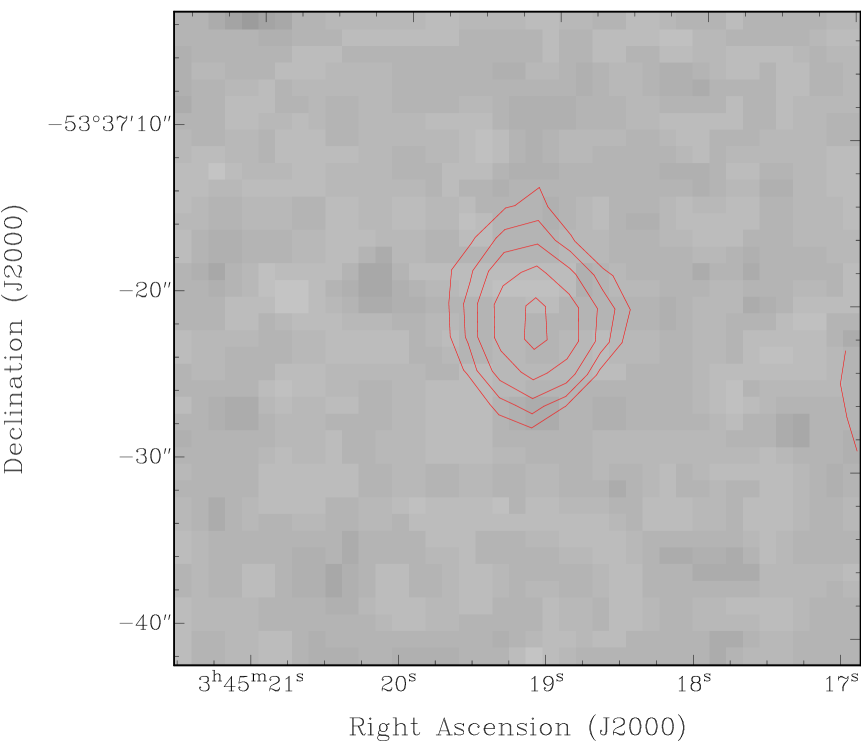
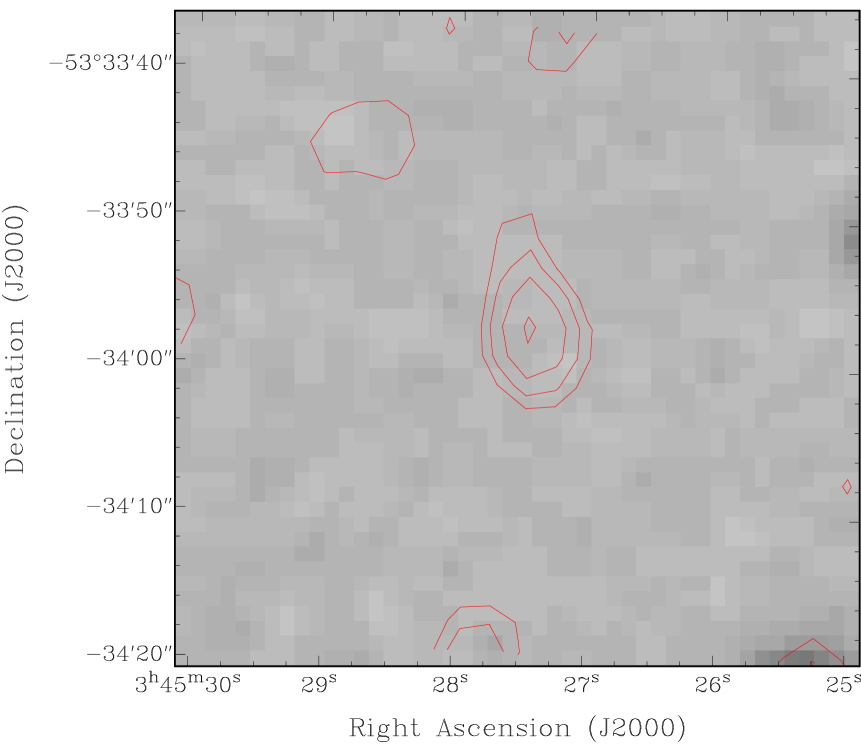
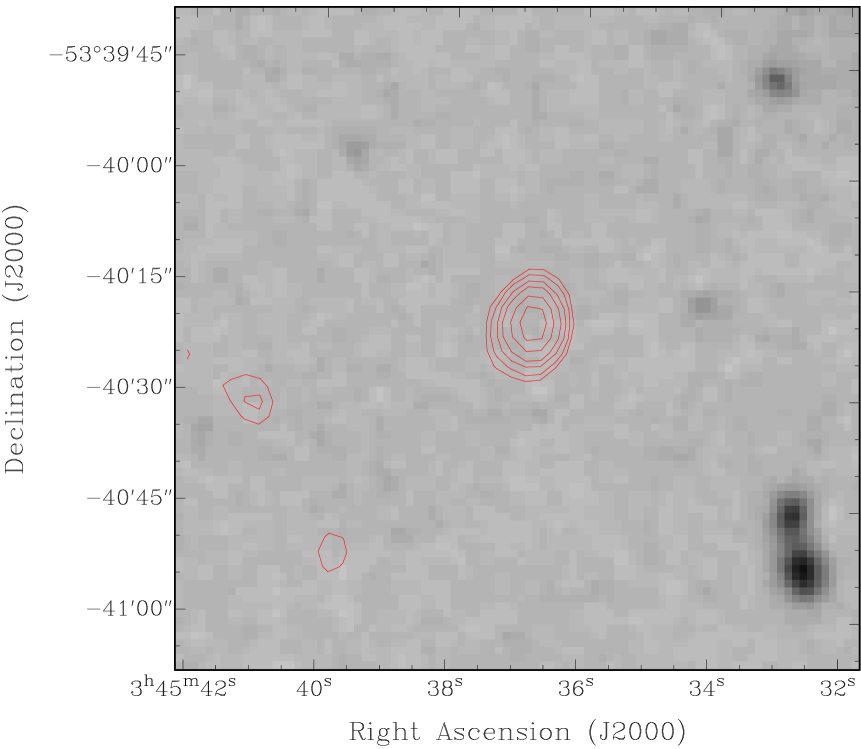
A total of 110 sources have been detected in the 1.4 GHz image, of these 30 are also detected at 2.5 GHz, 62 sources have optical counterparts, while 48 do not. Of the 110 radio sources, 88 were detected in the area over which the beam attenuation is minimal and a radio luminosity function can be calculated; 52 have optical counterparts within 3 arcseconds of the peak radio emission these are shown in Figure 3 and the remaining and 36, shown in Figure 4, have no optical counterpart within 3 arcseconds of the peak radio emission. Properties of the radio galaxies are given in Tables 3, 4 and 5.
In Figures 3 and 4 we show the Digitized Sky Survey (DSS) image overlaid with the radio contours for the 88 sources within the area of interest (the remaining 22 sources found in the image but outside of the region are not shown). 56% of the total 110 sources and 59% of those within of the centre have optical counterparts detected in the DSS (b 22.7) within 3 arcseconds of the brightest radio position, or in the case of extended sources, within 3 arcseconds of the radio core of the object. Venturi et al. (2000) found 26% of radio sources in Shapley had optical counterparts brighter than bJ= 19.5. At this limit we obtain 31% for both the whole sample and the reduced subsample corresponding to the area with little attenuation.
| Radio | Coordinates | S1.4 | S2.5 | |
|---|---|---|---|---|
| RAJ2000 | DECJ2000 | mJy | mJy | |
| 03 40 59.16 | -53 34 19.7 | 0.84 0.03 | ||
| 03 41 11.17 | -53 42 50.7 | 0.34 0.03 | ||
| 03 41 30.82 | -53 48 07.6 | 0.69 0.03 | 2.14 0.04 | 2.10 |
| 03 41 37.60 | -53 48 00.1 | 0.63 0.03 | ||
| 03 41 40.55 | -53 39 38.9 | 1.12 0.03 | ||
| 03 41 41.23 | -53 23 35.6 | 1.44 0.03 | ||
| 03 41 41.44 | -53 47 58.3 | 0.46 0.03 | 0.85 0.03 | 1.14 |
| 03 41 48.26 | -53 19 23.1 | 6.33 0.07 | ||
| 03 42 01.45 | -53 29 45.5 | 0.25 0.03 | ||
| 03 42 07.71 | -53 30 35.9 | 0.30 0.03 | ||
| 03 42 07.74 | -53 16 29.3 | 1.69 0.03 | ||
| 03 42 09.48 | -53 18 49.9 | 1.45 0.03 | ||
| 03 42 19.43 | -53 26 11.7 | 3.43 0.05 | 1.75 0.04 | -1.25 |
| 03 42 34.15 | -53 33 20.7 | 1.62 0.03 | 0.77 0.03 | -1.38 |
| 03 42 41.33 | -53 32 52.8 | 0.95 0.03 | 0.43 0.03 | -1.47 |
| 03 42 44.50 | -53 25 32.0 | 0.44 0.03 | 0.41 0.03 | -0.13 |
| 03 42 51.66 | -53 25 16.0 | 0.22 0.03 | ||
| 03 42 51.87 | -53 44 56.7 | 0.45 0.03 | 0.29 0.03 | -0.82 |
| 03 42 52.09 | -53 59 47.9 | 2.33 0.04 | ||
| 03 42 54.80 | -53 43 24.8 | 0.26 0.03 | ||
| 03 42 56.80 | -53 24 45.9 | 0.48 0.03 | ||
| 03 42 58.37 | -53 23 59.8 | 0.34 0.03 | ||
| 03 43 10.67 | -53 56 00.7 | 1.30 0.03 | ||
| 03 43 16.70 | -53 47 36.2 | 0.53 0.03 | ||
| 03 43 38.73 | -53 42 38.0 | 0.30 0.03 | ||
| 03 44 04.87 | -53 42 48.8 | 0.74 0.03 | ||
| 03 44 07.32 | -53 41 56.7 | 0.32 0.03 | ||
| 03 44 29.90 | -53 37 33.2 | 0.30 0.03 | ||
| 03 44 32.32 | -53 53 17.5 | 176.03 1.76 | 84.73 0.85 | -1.36 |
| 03 44 40.90 | -53 42 22.2 | 1.75 0.04 | ||
| 03 44 44.93 | -53 41 45.9 | 21.45 0.24 | 11.40 0.13 | -1.17 |
| 03 44 49.41 | -53 36 31.5 | 0.64 0.03 | ||
| 03 45 19.13 | -53 37 22.4 | 0.77 0.03 | ||
| 03 45 26.35 | -53 41 27.5 | 57.89 0.58 | ||
| 03 45 27.46 | -53 33 57.3 | 0.38 0.03 | ||
| 03 45 36.86 | -53 40 20.2 | 3.69 0.05 |
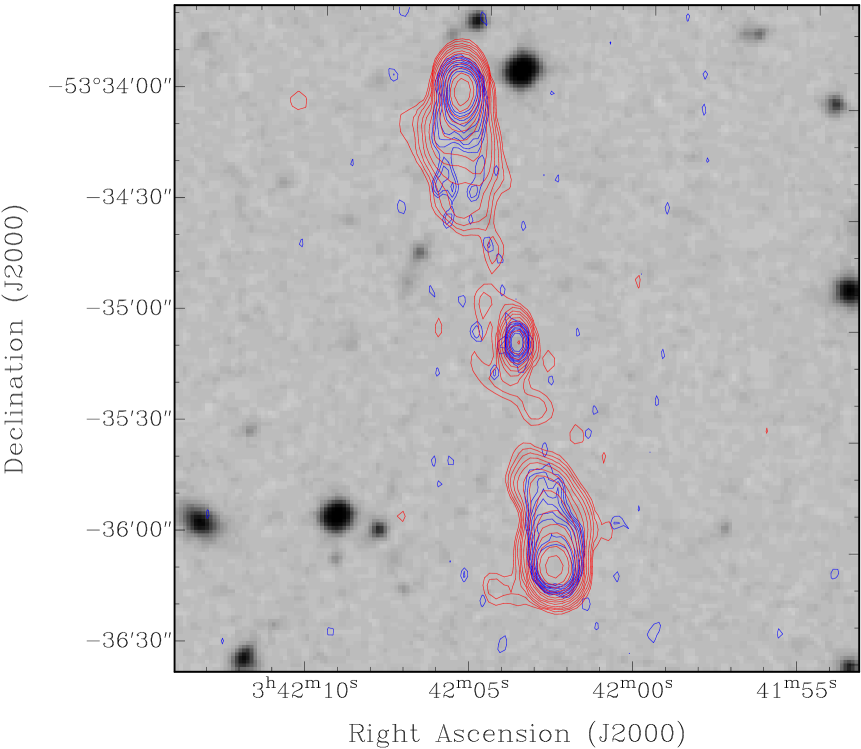
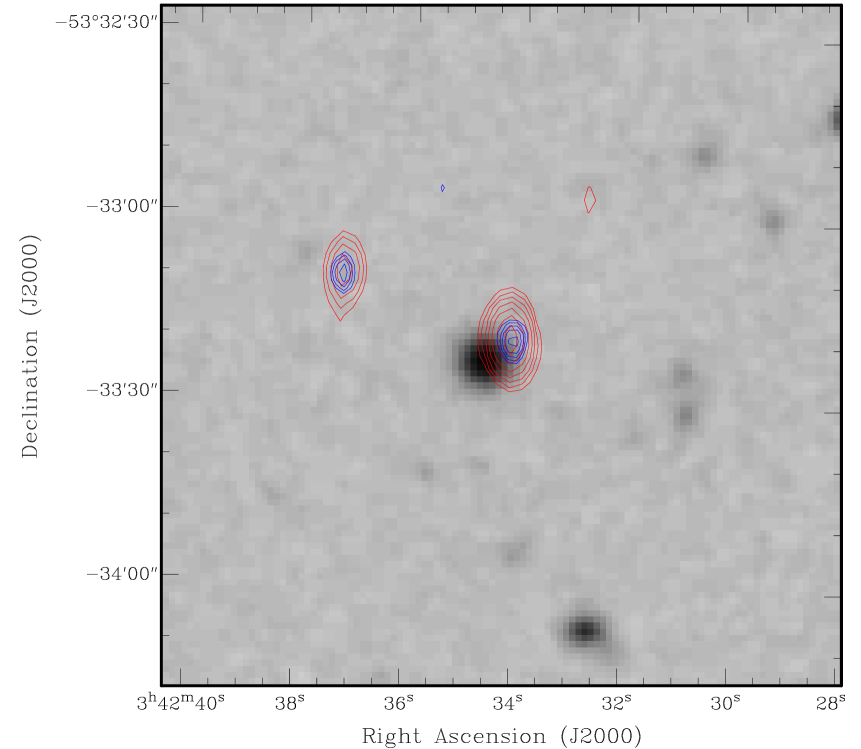
Of the 110 sources detected the vast majority of sources are unresolved. There are 15 extended sources (13.7%) of which only four are double radio galaxies. This compares well with the ATCA observations of the A3558 complex in which around 11% of the 263 radio galaxies found at 1.4 GHz and the same resolution (6 arcseconds) are extended (Venturi et al. 2000 & 2001).


Optical identifications were performed relative to both the SuperCOSMOS catalogue via a software routine, and the Digitized Sky Survey by eye. For the automated routine searching the SuperCOSMOS catalogue we limited the blue magnitude of objects to be less than 23 which is a reasonable limit to ensure objects are real. Results of both processes were consistent in the case of separations between the radio and optical coordinates of less than 3 arcseconds. For extended sources which were more than 3 arcseconds from the optical host the automated routine broke down and these sources were all discovered by inspection of the DSS images overlaid with radio contours.
Of the total there are 62/110 optical sources detected to the limits of the DSS, 29 of which have b 19.5. This compares well with the results for Shapley in which 26% of sources are found to have b 19.5 (Venturi et al. 1997, 2000). All of the double radio galaxies have either no optical counterparts or have counterparts with b 22.98 making them unlikely to be members of A3158. In contrast there are five known Head-tailed galaxies associated with the nearby A3125/A3128 complex (Mao et al. 2008) and five Head-tailed galaxies in the A3558 complex at the centre of the Shapley supercluster (Venturi et al. 2000, Miller 2005). The presence of tailed radio galaxies in clusters has been suggested as a signpost for “cluster weather” (Burns et al. 1998, Mao et al. 2008). Recently, it has been shown that head-tailed galaxies reside in only the most dense regions of clusters and that the local environment is a strong factor in the generation of the radio tails (Mao et al. 2008). The lack of tailed radio galaxies in A3158 might indicate that the cluster either lacks regions of high density or does not exhibit turbulent cluster weather either, because the cluster has not yet undergone such an interaction or because it is seen in the late stages of a merger event, given the current multiwavelength data, the later is more probable.
In Figure 5 we plot the histogram of the number of radio galaxies found to have optical counterparts as a function of flux density (dark grey) compared to the total radio sample (light grey). The shape of each distribution is remarkably similar suggesting that optical identification rate is uniform with respect to the flux density range.
Spectroscopic information from the region was obtained from the NASA Extragalactic Database (NED). Of the available spectroscopic data, 17 redshifts correspond to radio sources in our sample of which 14 (82%) correspond to a velocity range consistent with membership of the HRS.
All of the radio galaxies identified with A3158 (15,000 km s v 35,000 km s-1) are faint with 1.4 GHz radio powers between 5.40 WHz-1 and 6.35 WHz-1 putting them all below the FRI category based on radio power which is a similar result to radio galaxies associated with clusters in Shapley (Venturi et al. 2000). Radio powers in this regime may indicate starformation as the driving mechanism. The brightest galaxy identified with the cluster spectroscopically is the most massive cD galaxy which has a radio flux at 1.4 GHz of S1.4=7.88 mJy.
5 Radio Source Counts
In order to assess the dynamical state of the system, as determined via radio source counts, we compared our findings to the background counts obtained by Prandoni et al. (2001). Prandoni et al. (2001) detected 2960 radio sources above 0.5mJy at 1.4 GHz over an area of 25.82deg2 using the ATCA in a similar observational set-up and thus provides the ideal background source comparison. The sample is complete down to 0.7 mJy and provides the best determination of source counts in the range 0.7 S1.4 2 mJy using the ATCA to date. Our sample of 88 galaxies is found over an area of 0.463 deg2 and there are 52 sources above 0.7 mJy. Figure 6 shows the resulting log N-log S plot over the flux density range from 0.15 to 512 mJy. The differential number of sources in each bin is computed as Ndeg-2 and the errors are Poissonian. Each bin has a width of S = S log(2.5).
The plot clearly shows that our source counts are incomplete below 0.5 mJy, however prior to this point there are several bins in excess of the background found by Prandoni et al. (2001). Specifically, the radio galaxies below 3.96 mJy are several deviations above the background, at the mean redshift of A3158 this corresponds to log P1.4(WHz-1)=22.50. We performed a Kolmogoroff-Smirnov (KS) test against the two distributions above 0.7 mJy (the lower limit of the Prandoni data), the D-statistic was 0.18 – 0.19 depending on if we used only the average value of each data point per bin in the Prandoni data or if we assumed uniform flux densities across each of their bins. This corresponds to a very low chance that distributions are the same (3.3% – 8.2%). In addition, we performed the same analysis for the distributions above 3.96 mJy which returned a D-statistic of 0.22 – 0.24 which corresponds to a probability of 61% – 70% that the distributions are the same. Despite the fact that we are in a very low-number regime for the sub-sample above 3.96 mJy, the improved chance of coincidence in sub-sample over the large sample is suggestive that the lower bins are more strongly different to the background distribution. Similar analysis on a subsample of 145 radio galaxies with S 2 mJy found over a 3.25 deg2 area in Shapley (Venturi et al. 2000) did not show an excess over the background counts.
The effect of sources with multiple components was also considered. Prandoni et al. (2001) estimate that around 10% of sources in radio catalogues are due to different components of multi-component, extended radio galaxies being counted separately. In our data this would correspond to only one source. Via inspection we found two examples where it might be the case that multiple components of the same source had been counted separately. As a check we recomputed the D-statistic on our distribution as compared to Prandoni’s data assuming that these sources should be conflated. The D-statistic for the population above 0.7 mJy now gives 0.17 – 0.18 corresponding to a probablity of 8.2% – 13% that the distributions are drawn from the same population. For the population above 3.96 mJy the result remains unchanged which demonstrates the robustness of this result.
Using the available spectroscopic data we examined the likelihood for radio galaxies in these low-flux bins to be members of A3158. There are 13 sources with spectroscopic redshifts which correspond to sources in the excess low flux bins (0.7 S 3.96 mJy), of which 10 (77%) are members of the HRS compared to only 1 in 3 (33%) for sources with fluxes above this level. We compared the percentage of sources with measured redshift which were in the HRS as a function of flux bin. The results are summarised in Table 6 and show a very strong correlation with the likelihood of a source being in the HRS to increase inversely with radio flux. This strongly suggests that the excess low-powered sources are in the cluster. Given that the change over between AGN and starforming galaxies as the dominate population occurs at powers below log P1.4(WHz-1)=22.8 for rich clusters (Miller & Owen 2002) this result is strongly suggestive of an increased starforming population.
6 Radio Luminosity Function
The radio luminosity function (RLF) at 1.4 GHz was computed using the 88 radio sources detected within of the centre of the radio image. This corresponds to the region in which the primary beam response of the ATCA is essentially uniform and the attenuation negligible.
| Radio | Coordinates | S1.4 | Optical ID | z | Ref. | Mag. | Name | |
|---|---|---|---|---|---|---|---|---|
| RAJ2000 | DECJ2000 | mJy | RAJ2000 | DECJ2000 | ||||
| 03 41 11.43 | -53 19 26.7 | 1.14 0.03 | ||||||
| 03 41 41.79 | -53 59 26.0 | 205.57 2.06 | ||||||
| 03 42 39.82 | -54 04 08.5 | 2.07 0.04 | ||||||
| 03 42 40.55 | -53 09 51.9 | 3.24 0.04 | ||||||
| 03 42 49.22 | -53 10 06.1 | 15.65 0.16 | ||||||
| 03 42 56.86 | -54 02 31.1 | 8.73 0.09 | ||||||
| 03 45 06.75 | -53 15 44.6 | 4.76 0.06 | ||||||
| 03 45 41.95 | -53 39 07.5 | 0.48 0.03 | ||||||
| 03 45 47.18 | -53 36 40.8 | 0.52 0.03 | ||||||
| 03 45 53.65 | -53 39 03.8 | 0.54 0.03 | ||||||
| 03 46 04.90 | -53 15 20.9 | 120.44 1.20 | ||||||
| 03 47 02.60 | -53 44 39.7 | 5.58 0.06 | ||||||
| 03 40 13.27 | -53 32 00.5 | 4.02 0.05 | 03 40 13.19 | -53 32 00.9 | 0.061442 0.000334 | 5 | 16.10 | 2MASX J03401314-5331596 |
| 03 40 48.04 | -53 18 18.3 | 4.07 0.05 | 03 40 48.09 | -53 18 19.0 | 22.42 | |||
| 03 40 52.42 | -53 53 09.7 | 6.19 0.07 | 03 40 52.46 | -53 53 10.8 | 22.56 | |||
| 03 41 28.69 | -53 17 21.5 | 7.54 0.08 | 03 41 29.32 | -53 17 23.6 | 16.90 | |||
| 03 41 50.78 | -54 02 29.5 | 61.74 0.62 | 03 41 50.73 | -54 02 29.3 | 18.10 | 2MASX J03415075-5402298 | ||
| 03 43 33.79 | -54 11 19.1 | 44.89 0.45 | 03 43 33.71 | -54 11 19.8 | 17.55 | |||
| 03 44 16.85 | -54 04 23.7 | 31.74 0.32 | 03 44 16.88 | -54 04 22.5 | 15.81 | ESO 156-IG 009 NED01 | ||
| 03 44 23.84 | -53 59 31.9 | 25.55 0.29 | 03 44 23.84 | -53 59 31.9 | 22.57 | |||
| 03 45 41.98 | -53 32 51.4 | 4.36 0.05 | 03 45 42.04 | -53 32 52.0 | 20.99 | |||
| 03 45 47.33 | -53 22 25.2 | 0.56 0.03 | 03 45 47.42 | -53 22 25.4 | 18.00 | 2MASX J03454747-5322261 |
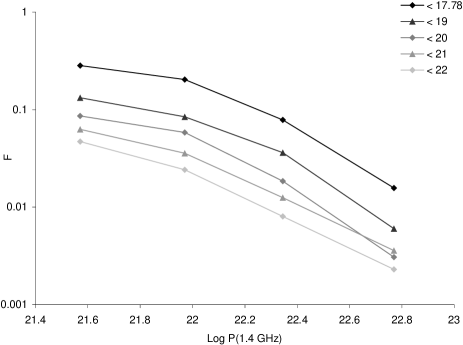
The integral RLF for different optical magnitude cuts offs is shown in Figure 7. The plot expresses the probability of each galaxy, satisfying the selection criteria, having a radio source with radio power log P1.4. It has been well established that brighter optical galaxies are more likely to host radio emission (Ledlow & Owen 1996; Venturi et al. 1997) and our results are consistent with this property with the curves exhibiting the same overall shape. Of course this is not that surprising for integral plots expressed on a log scale as they are not comprised of independent data (i. e. all of the data in the brighter optical magnitude curves is also contained in the fainter ones) and on a log scale small changes will be washed out. Nevertheless given limitations of the plots these results, though coarse, do suggest that brighter galaxies within clusters are more likely to host radio emission.
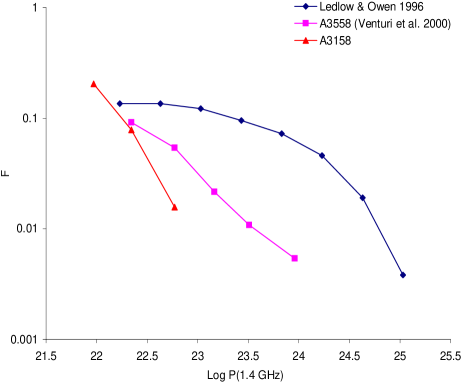
In order to compare the bivariate RLF for A3158 with the cluster sample of Ledlow & Owen (1996), hereafter LO96, our sample had to be matched to their sensitivity limits after being corrected for different cosmologies. This meant that the sample had to be restricted to sources with fluxes over 2.00 mJy which corresponds to logP1.4(WHz-1)=21.78, the LO96 lower limit, and b17.78 assuming that bJ=B-0.2(B-V) (Fukugita et al. 1995) which corresponds to M -20.5 in LO96. There are nine galaxies (eight ellipticals and one spiral) in the sample of 52 with fluxes greater than 2.00 mJy, of which only five have blue magnitudes less than 17.78. Our sample is complete to a lower flux density than LO96 and if we examine the number of sources having the same magnitude limit but with S 0.82 mJy we have a total of 15 galaxies.
The total number of galaxies with b17.78 in the region under consideration was obtained from SuperCOSMOS. This gave 112 galaxies. The total number of galaxies with blue magnitude less than 17.78 from SuperCOSMOS included those of all morphological types over all redshifts. In order to compute the fraction of early-type galaxies we assumed that the spectroscopic samples of Rose et al. (2002) and Fleenor et al. (2005) were representative and that all galaxies for which no emission lines were detected represent early types. We determined the fraction of galaxies likely to be found in the cluster by examining the percentage of galaxies in the Rose and Fleenor samples between 15,000 km s-1 and 30,000 km s-1 which corresponds to velocity coverage of the Horologium-Reticulum Supercluster (Fleenor et al 2006). This gave 78% for the neighbouring A3125/A3128 complex and 70% for the HRS field examined by Fleenor. We averaged these results and adopted 74% as the percentage of galaxies likely to be in the HRS. These results were similar to the values obtained for the Shapley supercluster (Bardelli et al. 1998). We then computed the total fraction of non-emission line galaxies from both the Rose and Fleenor samples finding them to be 44% in both samples. As a check we also examined the fraction of non-emission line galaxies in the restricted velocity range from 15,000 km s-1 to 30,000 km s-1 . The velocity restricted samples returned 44% and 47% emission line galaxies. These values seemed at odds with known properties of clusters (ie that the majority of galaxies would be elliptical) and results for similar studies in Shapley which found over 80% ellipticals. The problem relates to the fact that it is not uncommon for early-types to have at least one emission line, usually [OII]3727 and occasionally two with [NII]6583 being likely (Kennicutt 1992). Thus, a better indicator is not the total lack of emission lines but rather the use of absorption features as the main indicator of redshift. Unfortunately the spectroscopic samples only specify if there were emission or absorption lines present, there is no indication of how many. We have assumed that all objects for which either absorption only or both emission and absorption features where used to generate the redshift correspond to early-type galaxies. Doing this the fraction of early-types were found to be 77% and 71% for the Rose et al (2002) and Fleenor et al (2005) samples respectively. In the velocity limited subsample we obtained 78% and 74% respectively. This small difference in the velocity restricted examination is likely due to the differences in how the spectroscopic samples were obtained. Whereas the spectroscopic sample of Rose et al. (2002) covered the neighbouring clusters A3125 and A3128, the Fleenor sample covered the inter-cluster regions of the supercluster. Given both samples and the velocity restricted analysis of the Rose data, which is a better match to A3158, all returned 77% we adopted this value. Correcting for this fraction gives 64 galaxies which are likely to be both early-type and within A3158.
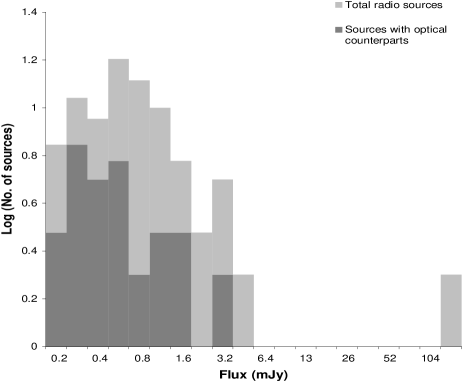
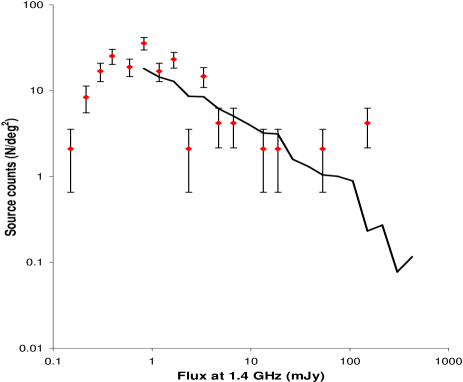
Figure 8 shows the resultant bivariate RLF for A3158 along with data for a sample of clusters from LO96 and data for the A3558 complex located in the centre of the Shapley supercluster generated by Venturi et al. (2000). Details of the bivariate luminosity function data are found in Table 7 . If the LO96 cluster sample were representative of A3158 we would expect 18 radio sources with S 2.00 mJy compared to the five observed. Like the data for A3558 we see that the RLF is lower than for LO96 meaning the probability for a radio source to be found in A3158 with radio power 1021.77 W Hz-1 is lower than in other cluster environments and the field. However, in the bin just fainter than the LO96 cut off we find a sharp increase in the likelihood of having radio emission in A3158 which is again consistent with the excess in the low end of the source counts. We note that our estimation of the fraction of early-type galaxies in A3158 is possibly an overestimate, but that even if the number of early-types is half of what we have used the bivariate RLF will still be significantly below both that found for LO96 and Shapley except in the bin just fainter than the LO96 cut-off. Thus, even if our estimate is vastly wrong the general result remains unchanged.
| Flux bin | 0.7-0.99 | 0.99-1.4 | 1.4-1.98 | 1.98-2.80 | 2.80-3.96 |
|---|---|---|---|---|---|
| (mJy) | |||||
| A3158 | 2 | 3 | 3 | - | 2 |
| background | - | 1 | 1 | - | 1 |
| % in A3158 | 100% | 75% | 75% | - | 66% |
The cross over point between AGN and star-formation dominated radio emission depends on the richness of the system. Typically it can be said that above P AGNs dominate (Condon et al. 2002, Mauch & Sadler 2007). However, for rich clusters, where the fraction of early-type galaxies is higher, this shifts slightly to P (Miller & Owen 2002). Considering, that A3158 has a richness class of two, and the fact that the break point between the two populations can only ever be determined statistically, it is fair to say our results are broadly consistent with a star-forming population. This is further supported by the excess in source counts below P as discussed in Section 5 above.
We examined the colours of the galaxies which corresponded to the excess i. e. those with 0.7 S3.9 mJy. Finding there to be a substantially higher number of blue galaxies in these flux bins (48%) as compared to either higher bins (26%). Examination of the colour magnitude diagram (B-R vs R) for the region for all galaxies in the SuperCOSMOS catalogue shows that 13 out of 27 galaxies corresponding to radio sources in the flux range 0.7 S3.9 mJy are bluer than the Red Cluster Sequence (RCS) as compared to only 7 galaxies which are redder (the rest are on the sequence) i. e. 48% of objects are bluer than the sequence compared to 26% which are redder. In comparison, at higher flux values the percentage of objects above and below the RCS is the same (25%). Without spectroscopic confirmation of cluster membership, it is impossible to categorically argue that the larger number of objects bluer than the RCS in the flux range from 0.7 S3.9 mJy definitely correspond to blue galaxies in the cluster. However, the bias in the scatter of objects in this flux bin to the blue compared to an even distribution about the RCS line at the higher flux bin is suggestive of a blue, low radio power population.
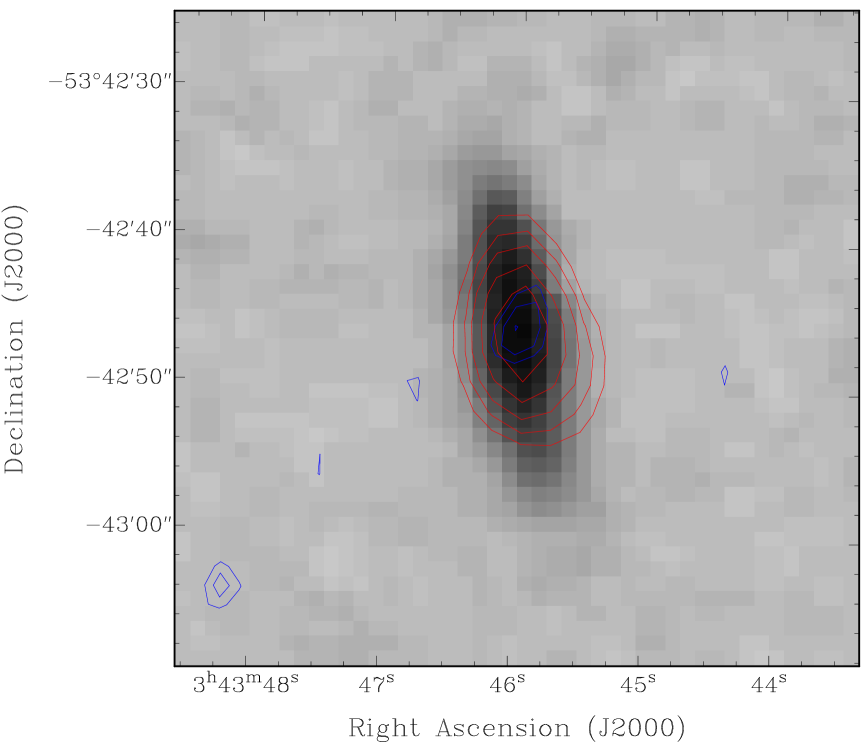
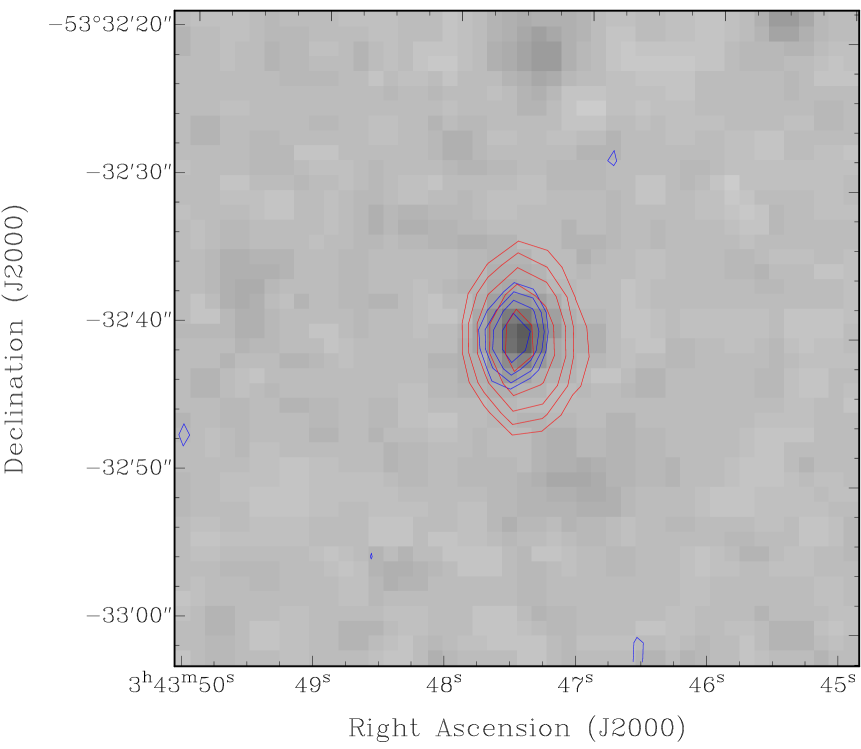
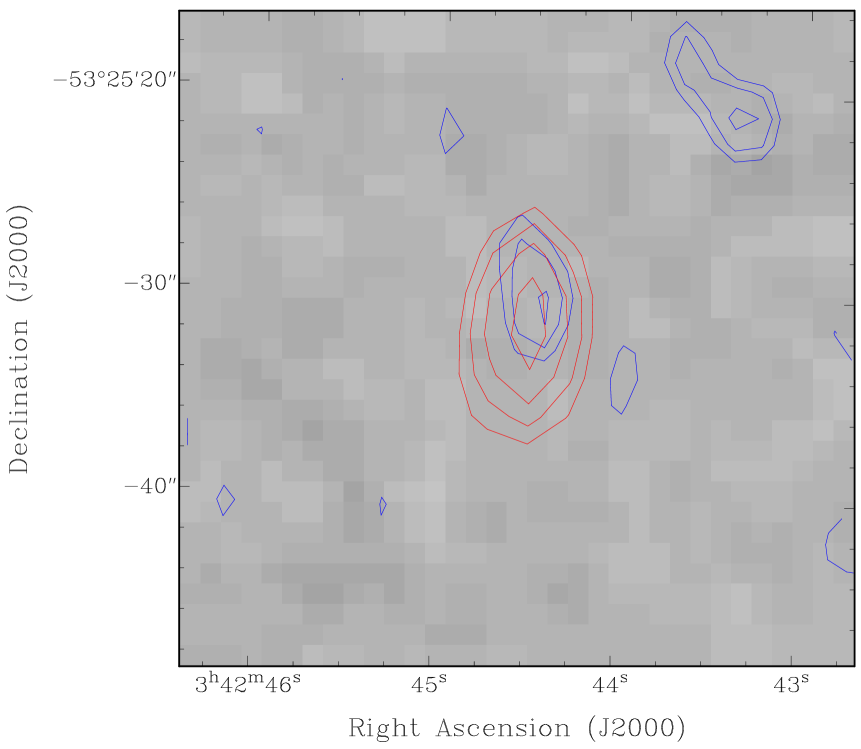
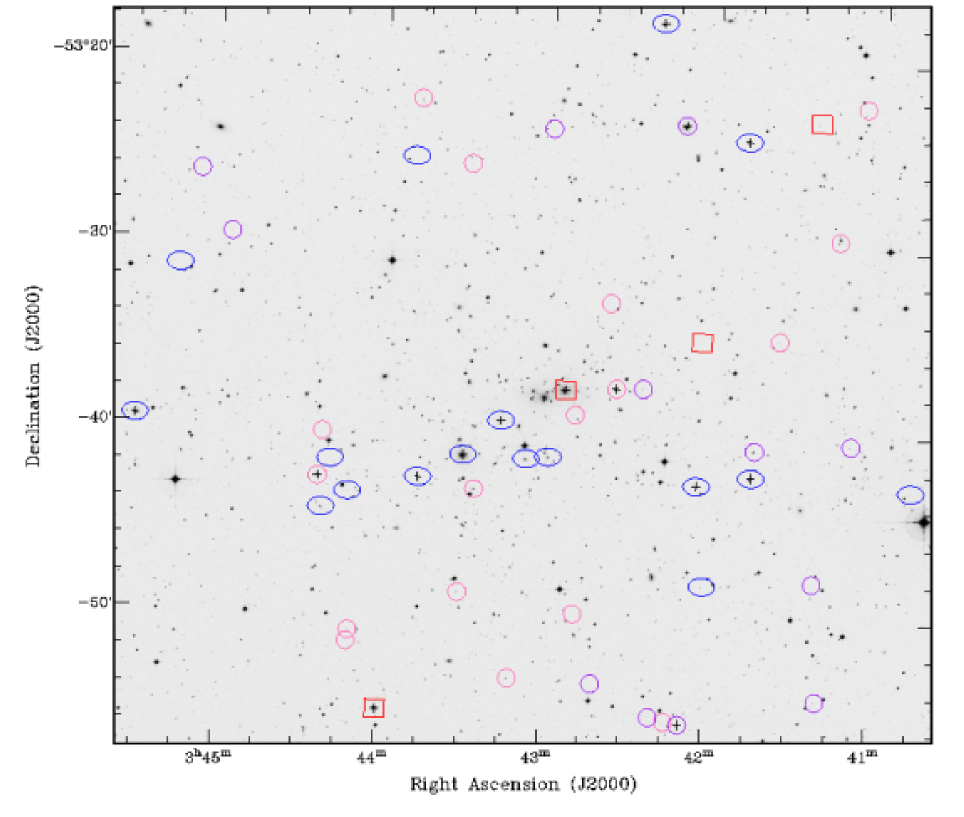
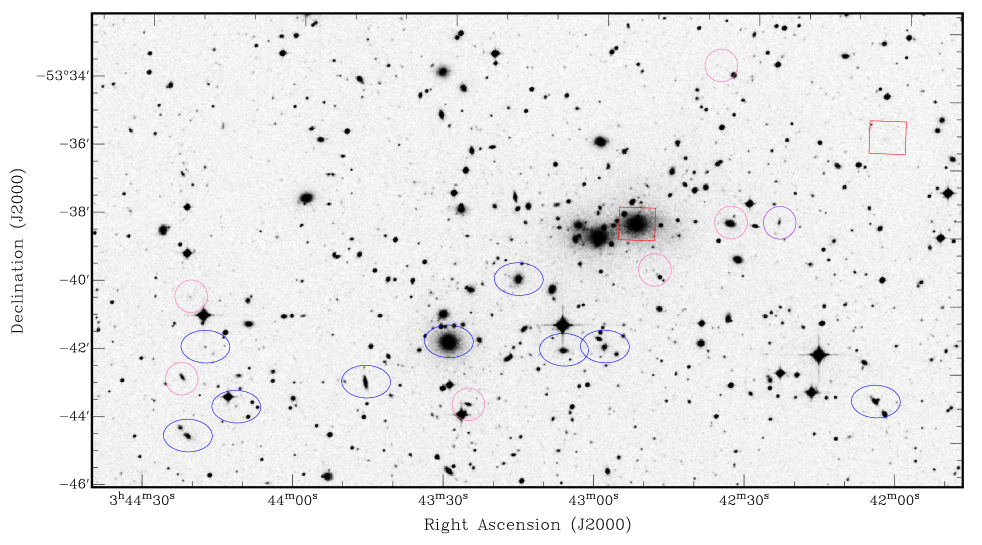
In addition, we examined the spatial distribution of these objects, finding them to be strongly elongated about the NW-SE axis of the cluster aligned toward the A2135/A3128 system. In Figure 9 we show the DSS image of the entire cluster with radio objects with a detected optical host marked with either circles, ellipses or squares based on the radio power bins used in the source count analysis. Pink circles show the positions of radio galaxies with radio fluxes at 1.4 GHz of less than 0.7 mJy, purple circles denote radio galaxies with fluxes in the range 0.7 - 0.98 mJy, blue ellipses are for galaxies with radio fluxes in the range 0.98 to 3.96 mJy and red squares are sources with fluxes greater than 3.96 mJy. Source with fluxes between 0.7 and 3.96 mJy represent those for which an excess over the background counts is detected. Sources which have been spectroscopically confirmed as members of A3158 are marked with crosses. Figure 10 shows a magnified region around the cD galaxies where most of the faint, blue radio galaxies reside. The Figure shows radio emission from two of the three cD galaxies and, what appears to be, a chain of low-powered radio galaxies linking them.
| log P1.4 | S1.4 | Fractional BLF | Integral BLF |
|---|---|---|---|
| 21.77 – 22.17 | 0.82 – 2.06 | 8/64 | 0.1250 |
| 22.17 – 22.52 | 2.06 – 5.15 | 4/64 | 0.0625 |
| 22.57 – 22.97 | 5.15 – 12.88 | 1/64 | 0.0156 |
| 22.97 – 23.36 | 12.88 – 32.19 | 0/64 | 0 |
| 23.36 – 23.76 | 32.19 – 80.47 | 0/64 | 0 |
| 23.76 – 24.16 | 80.47 – 201.2 | 0/64 | 0 |
7 Discussion
Several studies have been conducted to examine the way in which the cluster environment affects the radio galaxy population either via composite studies such as that undertaken in Ledlow and Owen (1996), “LO96”, or detailed studies of individual clusters or regions. Unfortunately, the results of the individual studies are often conflicting, possibly as a result of low number statistics, however some clear trends are emerging with respect to the three main indicators of the status of the radio population: source counts, radio luminosity functions and colour analysis of faint excesses. Of these, source counts provide an effective way to search for enhancements over the expected background. To date there have been several source count studies undertaken for parts of the Shapley Supercluster (Venturi et al. 1997, 2000, 2001, 2002) all of which have returned results which are consistent with the predicted background suggesting that the increased optical density of the supercluster environment is not at all reflected in the radio galaxy population. However, all of these studies have been relativity shallow, typically only examining sources with log P1.4 21.8 and are thus, barely probing the regime of starforming galaxies.
The situation with radio luminosity functions and in particular those for early-type galaxies seems to be complex. Venturi et al. (1997) examined the RLF for A3556 in Shapley and found it to be consistent with that found in other environments, hence concluding that, in this case, the dynamical state of the cluster played no role in the likelihood of radio galaxies forming. However, in a further study Venturi et al. (2000) presented a detailed study of the A3558 complex in the center of the Shapley supercluster finding that neither local nor the cluster environment played a significant role in the power distribution of radio sources in the region. Therefore, Venturi et al. (2000) conclude that the probability of forming low-powered radio sources (log P 22.5 ) in Shapley is lower than in both the field and (composite) cluster environments. Furthermore, they suggest that cluster merging switches off previously active radio galaxies, i. e. , mergers anti-correlate with radio emission in early-type galaxies. Next they examined the A3528 cluster complex in Shapley again finding that the RLF was consistent with that found in other environments (Venturi et al. 2001). Finally, they considered the radio emission in A3571 (Venturi et al. 2002) again finding that it was suppressed with respect to the expected results from LO96. Giacintucci et al. (2004) reobserved the outskirts of the A3558 complex and found the RLFs for both early and late-type galaxies to be consistent with the “universal” RLFs of Ledlow and Owen (1996) and Gavazzi & Boselli (1999) respectively, suggesting that the deficit of radio galaxies in the previous observation was entirely due to the rich cluster A3558 itself.
Venturi et al. (2001, 2002) attribute the difference in the RLFs to different stages in the merger history of the regions playing a critical role in the determination of radio emission in cluster galaxies. In the case of early mergers suggested for A3556 and the A3528 complex they suggested that the radio galaxy population has not yet been affected, whereas for the late-stage merger in A3571 and A3558, in the very core of Shapley, the radio galaxy population has been switched off by the merging. Given that cluster mergers are particularly long lived ( Gyr) compared to the lifetimes of radio sources which are typically only 106 -108 years it seems likely that the radio population could give vital clues as to the exact point in a cluster’s dynamical history, thus providing to be an extremely important evolutionary indicator. This is particularly true if the radio emission is considered together with other signposts of cluster dynamics such as X-ray observations.
Despite not being evident via an excess in source counts, Giacintucci et al. (2004) found a population of low powered (log P 22) galaxies on the outskirts of the A3558 complex, many of which showed a blue excess which they suggested are likely to be starbursts, although they noted that their observations provided only weak evidence that the fraction of radio-emitting galaxies was higher than in non-merging environments. Miller (2005) conducted a deeper observations of the A3558 complex over 7 deg2 and, on the basis of colour and radio luminosity, confirmed the presence of an increased starforming population associated with the recent merging of SC 1329-313 and A3562 with the rest of the supercluster. An excess of low-powered blue galaxies was also observed in the merging clusters A2125 (Owen et al. 2005), A2255 (Miller et al. 2003) and in A2111 (Miller et al. 2006) which despite lacking statistical evidence of substructure at right angles to the plane of the sky, is likely to be dynamically active. In both cases the authors attribute the excess of dusty starburst galaxies to the merger activity. In all cases an increase in low-power, blue galaxies either confirmed via spectroscopic analysis as starburst (Owen et al. 2005) or assumed through colour analysis (Giacintucci et al. 2004) has been associated with recently merging clusters.
In the case of A3158 we see both an excess of low-powered radio galaxies (log P 22) in the source counts and a suppression of the early-type RLF with respect to universal indicators. Thus, we seem to be seeing both a suppression of AGN as observed in the late mergers in A3571 and A3558 (Venturi et al. 2000 and 2002) and an increase in the low-powered, blue galaxies, likely to be starbursts, as seen in the mergers for A2125, A2255, A2111 (Owen et al. 2005, Miller et al. 2003 & Miller et al. 2006 respectively) and the outskirts of A3558 (Giacintucci et al. 2004). In addition, the axis of the starforming galaxy candidates is elongated and aligned in the direction which connects A3158 to the more massive A3125/A3128 complex which lies at the southern centre of the HRS. This is similar to the distribution of star-forming galaxies seen in A2125. Additionally the lack of HT galaxies is similar to both A3571 and A3558 and was used by Venturi et al. (2001) to argue for these clusters being in the later stages of a dynamical encounter.
8 Conclusions
We present the the first of a series of papers investigating radio emission in the Horologium-Reticulum Supercluster. In this paper we present radio imaging at 1.4 and 2.5 GHz of the cluster A3158, from which we detect 109 radio sources of which 64 are found to have optical counterparts. By considering a reduced subsample of 87 sources within a radius, over which the primary beam attenuation of the ATCA is negligible, we are able to investigate the statistical properties of radio emission in the cluster. Our results can be summarised as follows.
(1) The radio source counts in A3158 are unlikely to be consistent with the background source counts and in particular there appears to be an excess of galaxies with S 3.96 mJy; a KS test of the entire sample against the background only returns a 3% - 8% chance that the distributions are drawn from the same population, while a KS test over the sample with S 3.96 mJy gives a much higher chance (60%) that the distributions are drawn from the same population suggesting that the low-powered excess is the significant difference.
(2) The percentage of radio galaxies associated with the cluster as determined by spectroscopic redshifts is highly correlated to radio flux/power which is consistent with the excess source counts being the result of low-powered radio galaxies associated with A3158; in addition colours of these galaxies suggest they are blue which is likely to indicate starformation as a driving mechanism.
(3) The alignment of the candidate starforming galaxies associated with the increased source counts follows the bridge of galaxies connecting A3158 to the A3125/A3128 complex suggestive of merger-induced formation.
(4) The radio luminosity function for early-type galaxies is significantly lower than for other composite cluster environments and the field; this result is similar to the results for the late merger in A3558 obtained by Venturi et al. (2000).
Thus, if we can use the radio galaxy population as an indicator of merger history it is likely that A3158 is observed in a late merger state with a significant excess of low-powered, blue galaxies aligned along the axis connecting this cluster to the A3125/A3128 complex. These galaxies are likely the result of merger-induced starformation.
Acknowledgments
We thank the anonymous referee for their careful reading of the manuscript and insightful comments. MJ.-H. acknowledges the support of IRGS grant J0015125 & J0016583 administered by the University of Tasmania. M.S. was supported in this work via a University of Tasmania Vacational Scholarship in Astrophysics. J.A.G acknowledges the support of a Dave Warren Scholarship administered by the University of Tasmania. A.-M.B. was supported by a University of Tasmania Honours Scholarship. This research was supported by the DFG cluster of excellence “Origin and Structure of the Universe”. A portion of this work was supported by NSF grants AST-9900720 and AST-0406443 to the University of North Carolina-Chapel Hill. The Australia Telescope Compact Array is part of the Australia Telescope which is funded by the Commonwealth of Australia for operation as a National Facility managed by CSIRO. This research has made use of the NASA/IPAC Extragalactic Database (NED) which is operated by the Jet Propulsion Laboratory, California Institute of Technology, under contract with the National Aeronautics and Space Administration. The Digitized Sky Surveys were produced at the Space Telescope Science Institute under U.S. Government grant NAG W-2166. The images of these surveys are based on photographic data obtained using the Oschin Schmidt Telescope on Palomar Mountain and the UK Schmidt Telescope. The plates were processed into the present compressed digital form with the permission of these institutions.
References
- (1) Abell, G. O., Corwin, Jr., H. G., Olowin, R. P., 1989, ApJS, 70, 1
- (2) Balogh, M. L., Schade, D., Morris, S. L., Yee, H. K. C., Carlberg, R. G., Ellingson, E., 1998, ApJ, 504, L75
- (3) Bekki, K., 1999, ApJ, 510, L15
- (4) Bardelli, S., Zucca, E., Zamorani, G., Vettolani, G., Scatsmella, R., 1998, MNRAS, 296, 599
- (5) Burns, J. O., Roettiger, K., Ledlow, M., Klypin, A., 1994, ApJ, 427, L87
- (6) Burns, J. O., 1998, Science, 280, 400
- (7) Cadwell, N., Rose, J. A., 1997, AJ, 113, 492
- (8) Condon, J. J., Cotton, W. D., Broderick, J. J., 2002, AJ, 124, 675
- (9) Dalton, G. B., Efstathiou, G., Maddox, S. J., Sutherland, W. J., 1992, ApJ, 390, L1
- (10) Dalton, G. B., Croft., R. A. C., Efstathiou, G., Sutherland, W. J., Maddox, S. J., Davis, M., 1994, MNRAS, 271, L47
- (11) de Vaucouleurs, G., de Vaucouleurs, A., Corwin, Jr, H. G., Buta, R. J., Paturel, G., Fouque, P., 1991, ‘Third Reference Catalogue of Bright Galaxies’, vol 1–3, XII, 20009, Spinger–Verlag Berlin.
- (12) Dupke, R. A., Bregman, J. N, 2005, ApJS, 161, 224
- (13) Ebeling, H., Voges, W., Böhringer, H., Edge, A. C., Huchra, J. P., Briel, U. G., 1996, MNRAS, 281, 799
- (14) Einasto, M., Jaaniste, J., Einasto, J., Heinämäki, P., Müller, V., Tucker, D. L., 2003, AAP, 405, 821
- (15) Fleenor, M. C., Rose, J. A., Christiansen, W. A., Hunstead, R. W., Johnston-Hollitt, M., Drinkwater, M. J., 2004, in IAU Colloq. 195: Outskirts of Galaxy Clusters: Intense Life in the Suburbs, Ed. Diaferio, A., 89
- (16) Fleenor, M. C., Rose, J. A., Christiansen, W. A., Hunstead, R. W., Johnston-Hollitt, M., Drinkwater, M. J., Saunders, W., 2005, AJ, 130, 957
- (17) Fleenor, M. C., 2006, PhD Thesis, University of North Carolina, Chapel Hill.
- (18) Fleenor, M. C., Rose, J. A., Christiansen, W. A., Johnston-Hollitt, M., Hunstead, R. W., Drinkwater, M. J., Saunders, W., 2006, AJ, 131, 1280
- (19) Fujita, Y., Tazikawa, M., Nagashima, M., Enoki, M., 1999, PASJ, 51, L1
- (20) Fukugita, M., Shimasaki, K., Ichikawa, T., 1995, PASP, 107, 945
- (21) Giacintucci, S., Venturi, T., Bardelli, S., Dallacasa, D., Zucca, E., 2004, A&A, 419, 71
- (22) Havlen, R. J., Quintana, H., 1978, 220, 14
- (23) den Hartog, R., Katgert, P., 1996, 279, 349
- (24) Hudson, M. J., Smith, R. J., Lucey, J. R., Schlegel, D. J., Davies, R. L., 1999, ApJL, 512, L795
- (25) Johnston-Hollitt, M., Fleenor, M., Rose, J., Christiansen, W., Hunstead, R. W., 2004, in IAU Colloq. 195: Outskirts of Galaxy Clusters: Intense Life in the Suburbs, Ed. Diaferio, A., 423
- (26) Katgert, P., Mazure, A., den Hartog, R., Adami, C., Biviano, A., Perea, J., 1998, A&AS, 129, 399
- (27) Kennicutt, R. C., Jr, AJS, 79, 255
- (28) Ku, W. H.-M., Abramopulos, F., Nulsen, P. E. J., Fabian, A. C., Stewart, G. C., Chincarini, G. L., Tarenghi, M, 1983, MNRAS, 203, 253
- (29) Lambas, D. G., Nicotra, M., Muriel, H., Ruiz, L., 1990, AJ, 100, 1006
- (30) Ledlow, M. J., Owen, F. N., 1996, AJ, 112, 9
- (31) Lokas, E. L., Wojtak, R., Gottlöber, S., Mamon, G. A., Prada, F., 2006, MNRAS, 367, 1463
- (32) Loveday, J., Peterson, B. A., Maddox, S. J., Efstathiou, G., 1996, ApJS, 107, 201
- (33) Lucey, J. R., Dickens, R. J., Mitchell, R. J., Dawe, J. A., 1983, MNRAS, 203, 545
- (34) Mao, M. Y., Johnston-Hollitt, M., Stevens, J. B., Wotherspoon, S. J., MNRAS, 2008, (submitted)
- (35) Melnick, J., Quintana, H., 1975, ApJ, 198, L97
- (36) Miller, N. A., Owen, F. N., 2002, AJ, 124, 2453
- (37) Miller, N. A., 2005, AJ, 130, 2541
- (38) Miller, N. A., Owen, F. N., 2003, AJ, 125, 2427
- (39) Miller, N. A., Oegerle, W. R., Hill, J. M., 2006, AJ, 131, 2426
- (40) Mauch, T., Sadler, E. M., 2007, MNRAS, 375, 931
- (41) Ohata, Y., Kumai, Y., Wantanabe, M., Furuzawa, A., Akimoto, F., Tawara, Y., Sato, S., Yamashita, K., Arai, K., Shiratori, Y., Miyoshi, S., Mazure, A., 2001, Proc. ASP Conf. Series, 251
- (42) Owen, F. N., Ledlow, M. J., Keel, W. C., Morrison, G. E., 1999, AJ, 118, 633
- (43) Owen, F. N., Ledlow, M. J., Keel, W. C., Wang, Q. D., Morrison, G. E., 2005, AJ, 129, 31
- (44) Prandoni, I., Gregorini, L., Parma, P., de Ruiter, H. R., Vettolani, G., Wieringa, M. H., Ekers, R. D., A&A, 2001, 365, 392
- (45) Quintana, H., Havlen, R. J., 1979, A&A, 79, 70
- (46) Rose, J. A., Gaba, A. E., Christiansen, W. A., Davis, D. S., Caldwell, N., Hunstead, R. W., Johnston-Hollitt, M., 2002, AJ, 123, 1216
- (47) Sault R.J., Teuben P.J., Wright M.C.H., 1995, in Astronomical Data Analysis Software and Systems IV, ed. R. Shaw, H.E. Payne, J.J.E. Hayes, ASP Conf. Ser., 77, 433.
- (48) Sérsic, J. L., 1974, Ap&SS, 28, 365
- (49) Smith, R. J., Hudson, M. J., Nelan, J. E., Moore, S. A. W., Quinney, S. J., Wegner, G. A., Lucey, J. R., Davies, R. L., Malecki, J. J., Schade, D., Suntzeff, N. B., 2004, AJ, 128, 1558
- (50) Venturi, T., Bardelli, S., Morganti, R., Hunstead, R. W., 1997, MNRAS, 285, 898
- (51) Venturi, T., Bardelli, S., Morganti, R., Hunstead, R. W., 2000, MNRAS, 314, 594
- (52) Venturi, T., Bardelli, S., Zambelli, G., Morganti, R., Hunstead, R. W., 2001, MNRAS, 324, 1131
- (53) Venturi, T., Bardelli, S., Zagaria, M., Prandoni, I., Morganti, R., 2004, A&A, 385, 39
- (54) Wieringa, M. H., Kesteven, M. J.,1992, ATCA Technical Memo Series, 39.2/010
- (55) Zucca, E., Zamorani, G., Scaramella, R., Vettolani, G., 1993, ApJ, 407, 470