Time-Resolved AU-Scale Jets Traced by Masers in the IRAS 4A/B Regions of NGC1333
Abstract
We present results of VLBI observations of the water masers associated with IRAS 4A and IRAS 4B in the NGC 1333 star-forming region taken in four epochs over a two month period. Both objects have been classified as extremely young sources and each source is known to be a multiple system. Using the Very Long Baseline Array, we detected 35 masers in Epoch I, 40 masers in Epoch II, 35 in Epoch III, and 24 in Epoch IV. Only one identified source in each system associates with these masers. These data are used to calculate proper motions for the masers and trace the jet outflows within 100 AU of IRAS 4A2 and IRAS 4BW. In IRAS 4A2 there are two groups of masers, one near the systemic cloud velocity and one red-shifted. They expand linearly away from each other at velocities of 53 km s-1 . In IRAS 4BW, masers are observed in two groups that are blue-shifted and red-shifted relative to the cloud velocity. They form complex linear structures with a thickness of 3 mas (1 AU at a distance of 320 pc) that expand linearly away from each other at velocities of 78 km s-1 . Neither of the jet outflows traced by the maser groups align with the larger scale outflows. We suggest the presence of unresolved companions to both IRAS 4A2 and 4BW.
1 Introduction
Water masers are excellent probes of astrophysical flows. Their large flux densities and exceedingly compact sizes make them perfect Very Long Baseline Interferometer (VLBI) targets. Many masers observed in star-forming regions are thought to form in shocks either in or along the outflow of material commonly seen associated with young stellar objects (YSOs). They provide a high resolution probe of the base of the stellar wind that is unaffected by extinction from dust or extensive interaction with ambient material. The milliarcsecond resolution of VLBI is critical to resolve the individual maser components and outflows, particularly in high stellar density environments.
Long term total power monitoring has shown that masers around low mass YSOs are more episodic than those around higher mass YSOs, however, their detectable phases are sufficiently long for proper motion measurements if the observations are spaced by no more than two to three weeks (Furuya et al., 2003; Brand et al., 2003; Claussen et al., 1996; Wilking et al., 1994). Furthermore, if they arise in the warm (400K) spatially confined post-shock region, as postulated in various models (Elitzur, Hollenbach, & McKee, 1992, 1989; MacLow et al., 1994; MacLow & Elitzur, 1992), they should have space velocities sufficient to produce measurable proper motions over one to three weeks. However, regular monitoring of low mass YSOs is necessary to ensure that VLBI observations are conducted during periods of high maser activity.
Using the NRAO’s 111The National Radio Astronomy Observatory is a facility of the National Science Foundation operated under cooperative agreement by Associated Universities, Inc. Very Long Baseline Array (VLBA), proper motion studies have been made of water masers associated with high mass and intermediate mass YSOs such as Cepheus A HW2 (Torrelles et al., 2001), S 106 FIR (Furuya et al., 2000), NGC 2071 (Seth et al., 2002), and IRAS 20050+2720 MMS1 (Furuya et al., 2005) as well as with lower mass YSOs such as Serpens SMM1, RNO 15-FIR, and IRAS 05413-0104 (Moscadelli et al., 2006; Claussen et al., 1998). For example, water masers in IRAS 05413-0104 (associated with HH 212 at a distance of 450 pc), were found to lie in a structure of 10 AU in length and less than 0.5 AU thick. The masers appeared to arise in shock-related structures which showed proper motions along the axis of the outflow of 60 km s-1 and displayed coherent structures over time scales of two to three weeks (but which was less discernible over time scales as long as several months). Comparison with molecular and infrared observations of IRAS 05413-0104 clearly demonstrated that proper motion studies of water masers in the region (within 40 AU) of the central source are among the best tools for studying the kinematics of the jets emanating from embedded YSOs.
IRAS 4, comprised of multiple sources whose submillimeter-dominated ’Class 0’ spectral energy distributions suggest extreme youth, is located in the NGC 1333 star-forming region. As a nearby active and multiple young object, it presents a prime candidate for VLBI observations of its associated water masers. Located at a distance of 320 pc (de Zeeuw et al., 1999), the NGC 1333 molecular cloud hosts a double infrared cluster of about 200 YSOs identified in near-infrared surveys (Strom et al., 1976; Aspin et al., 1994; Lada, Alves, & Lada, 1996; Wilking et al., 2004) and x-ray surveys (Preibisch, 1997; Getman et al., 2002; Preibisch, 2003). Far-infrared observations have not only revealed the higher luminosity sources in NGC 1333, but also YSOs in the earliest phase of evolution such as the Class 0 sources IRAS 4 and IRAS 2 (Harvey, Wilking, & Joy, 1984; Jennings et al., 1987). IRAS 4 was found to be a binary at submillimeter wavelengths (Sandell et al., 1991); hence IRAS 4A and 4B. IRAS 4A is located 31 to the NW of 4B at a position angle of -45∘. Subsequently, both IRAS 4A and 4B were found to be binary systems. Lay, Carlstrom, & Hills (1995) performed single baseline interferometry in the submillimeter and found that 4A was a binary with an angular separation of 1.8 (or 580 AU at 320 pc). Interferometric observations in the millimeter and radio continuum confirmed the separation and determined that the position angle of separation was (Looney, Mundy, & Welch, 2000; Reipurth et al., 2002). While the easternmost source (IRAS 4A1) dominates the millimeter and radio continuum emission, the westernmost source IRAS 4A2) appears to be relatively more evolved with a warm ammonia core (Wootten & Mangum, 1993; Shah, 2000) and a wealth of complex organic molecules (Bottinellii 2007, priv. comm.). Submillimeter and millimeter wave continuum observations have confirmed the prediction of Lay, Carlstrom, & Hills (1995) that IRAS 4B is also a binary with components (4BE and 4BW) separated by about 10 (3200 AU in projection) along an E-W direction (Smith et al., 2000; Looney, Mundy, & Welch, 2000; Sandell & Knee, 2001). 222We adopt the naming convention introduced by Sandell & Knee (2001). The western (eastern) source is referred to as IRAS 4BI (IRAS 4BII) by Smith et al. (2000), as IRAS 4B (IRAS 4C) by Looney, Mundy, & Welch (2000), and as IRAS 4B (4B) by (Di Francesco et al., 2001). As in the case of IRAS 4A2, complex organic molecules have been detected toward IRAS 4B (Bottinelli et al., 2007), presumably from a hot core associated with 4BW. We note that IRAS 4BE has yet to be detected in the radio continuum (Reipurth et al., 2002) or demonstrate any sign of outflow activity. Infall motions have been detected toward IRAS 4A and 4B (Di Francesco et al., 2001), unambiguously toward the former, and strongly indicated toward the latter.
The detection of water masers toward IRAS 4A and 4B suggests that they are YSOs also associated with mass outflow. Water masers were first detected in single dish observations by Haschick et al. (1980) and later monitored by Claussen et al. (1996). These observations established the maser emission as highly variable on monthly time scales, sometimes being completely absent while at other times reaching peaks of 10 Jy. Detected emission was found from 10 to 15 km s-1 but the angular resolution was not sufficient to determine which masers were associated with 4A and 4B. Beginning in 1983, VLA observations have shown water maser activity associated only with IRAS 4A2 and/or 4BW (Rodríguez et al., 2002; Wootten, 1998; Furuya et al., 2003). VLBA observations of the water masers in IRAS 4A and 4B, acquired in 2003, have been presented by Desmurs et al. (2006). While masers were detected in only two of the four epochs observed, they confirmed the association of masers with IRAS 4A2 and expansion motion between the two spots was detected. In IRAS 4BW, the five maser spots detected were red-shifted and formed a chain 80 mas in extent with some masers displaying proper motion toward the north.
Molecular outflows have been mapped toward both IRAS 4A and 4B. IRAS 4A is associated with a highly collimated outflow about 20,000 AU in extent seen in HCN and SiO with a position angle close to 20∘ (Girart, Crutcher, & Rao, 1999; Choi, 2001, 2005). The origin of the outflow is likely IRAS 4A2 (Choi, 2005). On a larger scale ( AU), the outflow defined by CO and molecular hydrogen has a position angle of 45∘ (Blake et al., 1995; Choi et al., 2006). The shift in position angle from small to large scale is perhaps due to a combination of a shift in the direction of the magnetic field, an encounter with denser ambient gas, and precession of the outflow axis (Choi et al., 2006). A more compact outflow is associated with IRAS 4BW, with a position angle close to 0∘ (Blake et al., 1995; Choi, 2001) with perhaps a second outflow with a position angle of -35∘ (Di Francesco et al., 2001).
In this paper we present VLBA observations of water masers associated with the IRAS 4 region obtained over four epochs in 1998 and spaced by about one month. We also describe Very Large Array (VLA) observations, taken one month in advance of the start of the VLBA observations, that showed IRAS 4 to be a very active maser source and yielded absolute positions for the masers and the 1.3 cm continuum sources IRAS 4A1 and IRAS 4BW. With the VLBA, we detected 35 masers in Epoch I, 40 masers in Epoch II, 35 in Epoch III, and 24 in Epoch IV associated with IRAS 4A2 and IRAS 4BW. We use these data to reveal the structure of shock fronts associated with stellar winds from these YSOs and to estimate proper motions for masers detected in all four epochs. The origin of the maser emission and its relationship to the stellar winds and larger scale molecular outflows from these YSOs is discussed.
2 Observations and Reductions
2.1 VLA Observations
The VLA was used on August 12, 1998 to observe the water masers toward IRAS 4A and IRAS 4B to check that the masers were strong enough to observe subsequently with the VLBA. The array was in the B configuration. The phase tracking center for the array was set to be midway between the IRAS 4A and IRAS 4B positions. spread over a range of hour angles to optimize the u, v coverage. Two observation modes were used. In the first, observations were made with both circular polarizations, a total bandwidth of 1.5625 MHz (total velocity extent of 21 km s-1 ) and a correlator setup which gave 127 spectral channels each with width of 12.2 kHz (0.16 km s-1 ). In this mode the water masers were observed with reasonably high spectral resolution in order to spectrally resolve the masers, and the observations lasted for 42 minutes (on source),
In the second mode, the correlator was configured for continuum observations with one polarization pair (of IFs) set to a center frequency of 22264.9 MHz and a bandwidth of 50 MHz, while the other polarization pair were set to a bandwidth of 0.781 kHz, and the center frequency adjusted so that the strongest masers were placed at the center of the narrow band. This setup allowed the phases to be tracked using the strong signal in the narrow band, in order to calibrate tropospheric phase changes to apply to the 50 MHz continuum band (away from the maser emission). In this mode the continuum emission from the IRAS 4 region was observed for 3.5 hours (on source).
The data were edited, calibrated, and imaged with the NRAO Astronomical Image Processing System (AIPS, Greisen 2003) in the standard manner. In the high spectral resolution data, Stokes I images were made using uniform weighting of the u,v data, of each spectral channel, and were CLEANed to an rms noise (in channels without strong maser features) of 20 mJy beam-1. The synthesized beam was 300 by 275 milliarcseconds (mas) at a position angle of 83∘. The strong masers in SSV13, some 196 arcseconds to the north-northwest, contributed sidelobe emission in some spectral channels. In general, however, those channels affected did not have maser emission from IRAS 4A or 4B. With this angular resolution, many spectral features mapped to the same position, although two groups each of spatially separated masers were seen toward both IRAS 4A and 4B. The positions of these four maser groups, as estimated with Gaussian fits to the strongest maser in each group using the AIPS task JMFIT, are listed in Table 1.
For the continuum observations, after the standard calibration, the narrow band data were imaged and used in an iterative self-calibration procedure. The self-calibration solutions obtained were applied to the broad band data, which were imaged with natural weighting of the u,v data (which increases the sensitivity relative to uniform weighting). The synthesized beam for this mode was 360 by 325 mas at a position angle of 77. The rms noise in this image was 120 Jy beam-1. Unfortunately, the weather was not particularly good, and the system temperatures were elevated by about a factor 1.5 - 2.0 over good weather conditions. Integrated flux densities at =1.3 cm for IRAS 4A1 and 4BW were 1.33 mJy and 0.54 mJy, respectively. IRAS 4A2 and 4BE were not detected to a 3 peak flux density limit of 0.36 mJy beam-1.
2.2 VLBA Observations
We have used the VLBA to obtain four epochs of observation of the water maser emission associated with a number of low-mass YSOs. Two subsequent papers will present results on IRAS 16293-2422 and SVS 13. A previous paper (Claussen et al., 1998) presented results for IRAS 05413-0104. Preliminary results of the observations presented here have appeared as Marvel et al. (2002), while those of IRAS 16293-2422 and SVS 13 have appeared as Wootten et al. (1999) and Wootten et al. (2002).
The observations were made with one polarization pair (both right and left circular polarization) of baseband channels, each with 4 MHz of bandwidth. This provides 54 km s-1 of total velocity coverage. Correlation was made with 256 spectral channels per baseband channel, yielding a velocity width in each spectral channel of 0.21 km s-1 . Although the velocity coverage is then only 27 km s-1 from the systemic, no published higher velocity water masers have been detected from the IRAS 4 sources (Claussen et al., 1996; Brand et al., 2003; Furuya et al., 2003).
Since IRAS 4A and 4B are located close together on the sky (within the primary beam of the VLBA antennas), we were able to direct the antennas of the VLBA to a position between the two sources and then perform two separate correlation passes with the VLBA correlator at the precise positions of the sources without loss of sensitivity. The correlation positions coincide with the centimeter continuum positions (see Table 1). Since the data were obtained contemporaneously, simply being correlated in separate passes, the two data sets share identical time ranges and mid-times of observation. Each of the four observations were separated in time by approximately three weeks. This separation was chosen based on past single dish monitoring observations (Claussen et al., 1996; Wilking et al., 1994), which indicated significant flux changes on this timescale. The dates of the observations, mid-times of each epoch and Julian date of the mid-times are given in Table 2 along with the number of days between each pair of the observations.
The data from each epoch were reduced using AIPS. Strong continuum sources were observed during each epoch to calibrate both the bandpass response of the receiver systems of each antenna as well as allowing determination of any residual delays uncompensated for by the correlator model. After residual delay removal, a strong maser feature displaying simple structure was selected for determination of delay changes during the observations. After the removal of these residual delay rates, the same channel was split from the data set for iterative self-calibration. The amplitude and phase self-calibration solutions were then applied to all spectral channels and the data were edited for poorly calibrated amplitudes.
After all calibrations were applied, the data were mapped using the AIPS task IMAGR. Spectral cubes were formed with pixel cell sizes of 85 arcseconds. The restoring beam varied in size, but was typically about 800 arcseconds by 400 arcseconds with a position angle very close to 10.0∘ east of north. The resolution varied for each epoch depending on the details of the self-calibration process and whether or not good self-calibration solutions were obtained for given antennas at given times. The exact imaging parameters for each epoch and rms noises for typical channels (those channels whose noise floor is not dictated by dynamic range constraints) are listed in Table 3.
To aid in the analysis of the maser motions observed, two-dimensional Gaussian components were fit to each maser spot in each channel where the emission from an individual spot exceeded five times the RMS noise for that channel. This was carried out using an automated routine in AIPS (SAD) in an iterative process that first fit the strongest Gaussians in a given channel, subtracted the resulting component from the map and then reiterated the search for Gaussian components above the noise cutoff in the map. This produces a fairly reliable set of Gaussian components without the very tedious process of fitting each component above the limit in each channel manually. The resulting positions were then grouped together in velocity space and position in tabular form. Only masers detected in two or more channels above the cutoff and no more than one beamwidth offset in position were retained. Fewer than 10% of the components were excluded in this process, pointing to the reliability of the iterative fitting process.
The surviving component fits were then visually inspected using the 3-dimensional data analysis tool XGOBI333XGOBI, a multivariate data analysis tool that operates under the X11 system is freely available for download at http://www.research.att.com/areas/stat/xgobi/. Using XGOBI, it is possible to excise spurious Gaussian fits that result from the automated Gaussian fitting routine we utilized. If a fit was called into question by the XGOBI inspection process, the original maps were inspected prior to deleting the data point. Usually, spurious fits were caused by residual sidelobes being fit in several channels by the SAD routine in AIPS and occurred in channels that were dynamic-range limited. The components were then used for all subsequent fitting and analysis as described in Appendix A.
3 Description and Analysis of the Maser Regions
3.1 IRAS 4A
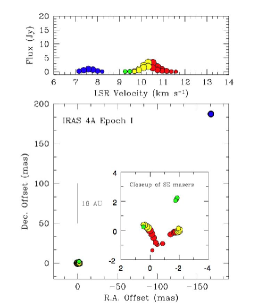
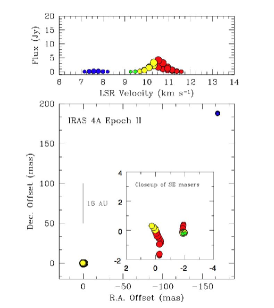
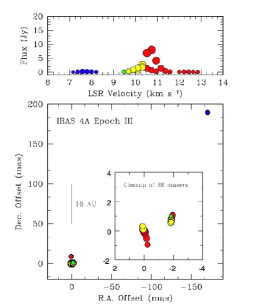
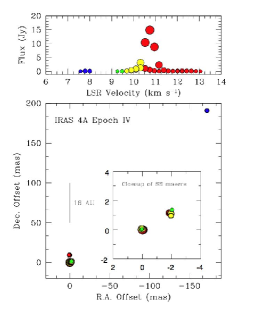
At the time of our observations, the water masers of IRAS 4A were found in two dominant regions, separated by 251 milliarcseconds (Epoch I) or 80.3 AU. A line connecting the two maser regions lies at a position angle of about 50∘ (north through east) roughly perpendicular to the CO outflow axis. Comparison with our VLA observations show that the masers are associated with IRAS 4A2. Figure 1 shows the spatial and kinematic distribution of the masers for all four epochs, each with a closeup of the SE maser component.
The NW region exhibited only a single maser spot. Its peak flux decreased in time from 0.97 Jy at the first epoch to 0.12 Jy at the final epoch. The maser is at or slightly red-shifted relative to the molecular core velocity of 6.7 km s-1 . The SE region contains more highly red-shifted maser spots in Epochs I and II, including the maser used to self-calibrate each epoch and another weaker maser just west of the reference spot. In Epochs III and IV, another maser appeared 10 mas north of the reference feature at a velocity of 12.5 km s-1 (Figure 1). Because we self-calibrated the data using the brightest spot as the reference, its position remains constant over time and appears at the origin.
The separation vector from the reference feature to the NW feature increased in magnitude over time, expanding from 80.4 AU in the first epoch to 82.3 AU in the final epoch. The projected speed of expansion is 53.0 km s-1 given the assumed distance of 320 pc to the source. Since the line of sight velocity difference between the two regions is only 2 km s-1 and assuming that this velocity difference and the proper motion result from the projected velocity of an outflow jet, we can calculate an inclination for the outflow of 2∘. The true space velocity is therefore nearly equal to that measured in the plane of the sky, namely 53 km s-1 . As shown in Table 4, the proper motion vectors for the NW feature relative to the reference feature has a position angle of 49.8∘, identical to the position angle of the separation vector.
3.2 IRAS 4B
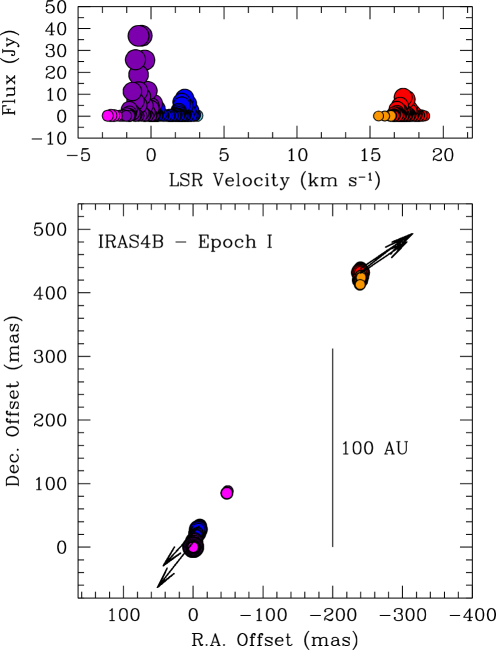
Similar to IRAS 4A, IRAS 4B exhibits water maser emission in two dominant well-separated regions associated with IRAS 4BW: one to the NW and another to the SE. Masers in the NW region are red-shifted relative to the cloud velocity of 7 km s-1 with velocities ranging from 13 to 20 km s-1 . Masers in the SE regions are blue-shifted with velocities ranging from -3 to 4 km s-1 . The radial velocities for the NW and SE groups are consistent with those in the northern and southern lobes of the bipolar HCN outflow observed by Choi (2001) and the bipolar H2CO outflow mapped by Di Francesco et al. (2001). A complete list of the maser component velocities, fluxes, and positions can be found in Appendix A.
Figures 2 and 3 show the overall spatial and kinematic distribution of the maser emission as observed in each epoch for the two maser groups in IRAS 4B. Over time, the masers in the NW expand away from the reference feature at (0,0) in the SE maser group. A line connecting the two regions lies at a position angle of roughly 29∘ and the two regions are separated by 488 milliarcseconds (mas) or 156 AU. The SE grouping is roughly arc-like with an overall extent of 38 mas (12 AU) and a thickness of 2 mas (0.6 AU), while the NW clump is more linear and extends about 26 mas (8.3 AU) with a thickness roughly the same as the SE clump. The highest velocity maser emission lies at the northern tip of the NW group (+20 km s-1 ) and at the southern tip of the SE arc (3 km s-1 ). In addition, a small maser group is located approximately 100 mas (32 AU) to the NNW of the main SE arc. This region’s structure changed during the epochs, but usually consisted of two or three well-separated maser features (by several mas or about 0.3 AU). This distinct region is located close to the line connecting the NW and SW maser groups. If the active maser regions mark the interaction of a bipolar jet from IRAS 4BW with ambient gas, then the opening angle of the jet would be 10∘.
Beginning in the second epoch, but much more clearly shown in the third and fourth epochs, a new arc-like ridge of lower velocity emission became visible to the south of the other masers in the NW region. This region is not well-characterized by point-like emission, but is more diffuse and seems to be an extended ridge of maser emission. By the fourth epoch, the entire NW feature had grown to roughly 40 mas (12.8 AU) in extent.
We compared the positions of the reference feature, which is present in all epochs in the SE clump (B-REF in Table 4), with a maser in the NW clump that persisted through all four epochs (B-5 in Table 4). The separation vector for the two masers increased over 59.81262 days from 499.59 mas (159.87 AU) to 508.25 mas (162.64 AU). A linear regression fit to the magnitude of the separation vector as a function of time yields an expansion velocity of 78.2 km s-1 with a formal error of 3.9 km s-1 . The radial velocity difference between the two masers of 18.5 km s-1 suggests an inclination of the outflow of about 13∘ from the plane of the sky.
To investigate the proper motions of the masers associated with IRAS 4BW, we identified all components that were present in all four epochs of observation. Three components were identified in the NW and two were identified in the SE. We averaged the mean positions of the NW and SE components and averaged these two positions to estimate an average geometric fiducial position for each epoch. This position was then subtracted from each maser component. These referenced positions are presented along with the fluxes and original positions in Table 4. Finally, we fit straight lines to the positions of the components as a function of time. The resulting tangential velocities and position angles from these fits are also presented in Table 4 and are very similar for all five maser components. Their motions are very uniform over the four epochs with average values of 43 2 km s-1 at a position angle of 38∘ 2∘. Figure 4 shows all of the maser components as observed in Epoch 1 and their corresponding proper motion vectors. Again, an overall expansion is apparent along the axis connecting the two regions.
4 Discussion
4.1 IRAS 4A
Since the water masers toward IRAS 4A have always been found coincident with the position of A2 (when they were detected), we consider three alternatives for the origin of the water maser emission seen using the VLBA: 1) the water masers are in an outflow which is the close-in extension of the large-scale molecular outflow, driven by IRAS 4A2; 2) the water masers are excited by an interaction of the close-in flow and the accretion disk itself and 3) the water maser outflow is driven by a companion to IRAS 4A2, as yet unresolved. We consider each of these alternatives in turn.
4.1.1 Alignment with the large scale outflow
The alignment of the water maser outflow is curious in that it does not have the same position angle as any of the larger-scale outflows emanating from the two sources in IRAS 4A. The axis of the large-scale outflow defined by the SiO, CS, CO, and H2 emission (Choi et al., 2006; Choi, 2005; Blake et al., 1995), and driven by A2, may be drifting with a rate of 0.011 degrees/yr (counterclockwise as seen on the sky) and a zero-point angle of around 166∘ (i.e., presumably the jet-injection angle), depending upon the fit of the large-scale emission (see Figure 3a of Choi et al. 2006). For the large-scale flow, the blue-shifted emission is generally in the south to southwest and the red-shifted emission is generally in the north and northeast. The maser outflow, however, on a scale of 200 mas, has a position angle of 50∘, and has the more highly red-shifted emission to the southeast. Thus, if the masers were marking the close-in extension to the flow, the position angle of the flow would have to change from 130∘ to 165∘, in a counterclockwise direction, from 40 to 300 AU from the star. We consider that such a shift in jet direction is very unlikely, if not unphysical.
4.1.2 Interaction with the A2 accretion disk
The jet direction near the base of the flow, as indicated by Choi et al. (2006), and also by the CS J76 emission (Blake et al., 1995) appears to be about 0 degrees (i.e. north-south). If the masers were excited by an interaction of the outflow with the A2 accretion disk itself, then the opening half-angle of the jet at its base would have to encompass the direction of the maser axis. Thus the opening half-angle of the jet would be . Such a large opening angle would seem inconsistent with the Class 0 phase and the high degree of collimation seen in the larger scale outflow.
4.1.3 An unresolved companion to IRAS 4A2
Perhaps the simplest explanation for the direction of the axis of the water maser emission is that it is not related directly at all to the large-scale molecular outflow, but that the masers are located in an independent outflow from another young stellar object. A large fraction of the water masers around low-luminosity YSOs, which have been observed and mapped with very high angular resolution, show bipolar flows and structural evidence for bow shocks as the jet impinges on and sweeps up ambient molecular material. Although the structural evidence is sparse (because of the small number of maser spots) for IRAS 4A, the bipolar velocity separation strongly suggests that the masers are tracing a jet outflow as, for example, in IRAS 05413-0104 (Claussen et al., 1998). It is clear from VLA observations (e.g., Furuya et al. 2003; this paper) that the water masers toward IRAS 4A are always found toward A2 rather than A1, so A1 cannot drive the maser outflow. Therefore we suggest, that, in this scenario, there must be a companion to A2 that drives the water masers. Since the masers are clearly associated with the position of A2, and not A1, it is clear that the maser outflow, in this scenario, is not associated with A1. Indeed, the presence of a companion to A2 separated by 30-80 AU has been proposed by Choi et al. (2006) to explain the drifting of the 4A2 outflow axis. A companion within 100 mas (32 AU) of A2 would be consistent with it not being resolved in =3.6 cm continuum observations with the VLA (Reipurth, 2000).
4.2 IRAS 4B
While the masers trace a jet similar in velocity to the HCN outflow, the position angle of 29∘ is significantly different from the north-south orientation of the outflow. Choi (2001) suggests a dynamical lifetime for the molecular outflow of 200 years (corrected to a distance of 320 pc). This is much longer than the dynamical lifetime of the maser emission which is on the order of a year. We conclude that the jet must be precessing in such a way as to move the projected outflow axis from a position angle of 0∘ to 29∘ in several hundred years. In this picture, the jet would be impacting the walls of the outflow cavity as it precessed “clockwise” in the plane of the sky. The NW maser group would represent the western wall of the pre-existing cavity and the SE maser group the eastern wall. This would explain the linear, arc-like structure of the maser groups and the appearance of new masers at the southern extent of the NW group. This model can only be reconciled with observations of dense outflowing gas traced in H2CO by Di Francesco et al. (2001) if there were a second outflow from an unresolved companion to IRAS 4BW. If our picture is correct, one would expect future VLBI observations to reveal new masers south (north) of the NW (SE) group. One would also expect that on a larger scale, tracers of the jet would display a characteristic S-shape, bending back to a north-south orientation. Indeed, slow precessing jets have been proposed for a number of YSO outflows (Matthews et al., 2006; Hodapp et al., 2005; Terquem et al., 1999) that suggest the presence of a nearby companion (Terquem, 1998).
The proper motion vectors for the five persistent maser spots relative to a fiducial point (Figure 4) suggests a larger position angle than that of the outflow axis defined by the relative motion of SE and NW masers (38∘ vs. 29∘, see Table 4). This is reminiscent of the proper motions seen in the triple radio continuum source in Serpens (Curiel et al., 1993), where the outer components of the radio jet have the same tangential velocity but are moving in slightly different directions. Although the maser emission in IRAS 4B traces the jet at scales 40 times smaller than that traced by the radio continuum in the Serpens jet, this difference in relative motions may be suggestive of similar physical processes in the two jets.
The larger position angle defined by the proper motion vectors in IRAS 4B suggest that, in addition to the tangential velocity imparted to the masing gas by the outflow jet at a position angle of 29∘, there is an additional component of about 6 km s-1 perpendicular to the outflow axis. It is possible that this motion is related to the expansion of the outflow cavity into the ambient cloud.
4.3 Maser Geometry
We estimate that the maser outflows in both IRAS 4A and 4B are nearly in the plane of the sky (inclination of only 2∘ for IRAS 4A and about 13∘ for IRAS 4B). In Claussen et al. (1998) we estimated that the inclination of the maser outflow for IRAS 05413-0104 was only 4∘. Models of maser emission (e.g. Hollenbach 1997) suggest that the masers trace shocks produced by the interaction of the jet and ambient material along the jet. Shocks that propagate close to the plane of the sky provide much longer maser coherence lengths than those that propagate at larger inclination angles. Thus outflows that have inclinations close to the plane of the sky provide a more favorable maser geometry, perhaps explaining why some well-known outflows from low-mass YSOs do not show maser emission.
5 Conclusions
We have observed the water masers associated with IRAS 4A and 4B at VLBI resolutions in four epochs over three months. We have determined that the masers are related to the jets emanating from these YSOs due to their spatio-kinematic distribution. In both sources the masers are found associated with known single components of multiple systems, with total separation velocities between 53 and 78 km s-1.
This is further confirmed by the large proper motions measured for both sources, which clearly rules out rotation due to the mass constraints placed on the central objects by other observations. The water masers of IRAS 4B form arc-like structures roughly 10 AU in length and less than 0.6 AU in thickness. The structure of these structures changes rapidly with time, with many new maser components appearing and disappearing in just one month. The orientation of the structures in the plane of the sky does not agree with larger scale outflow angle, which we attribute to a possible unseen very close companion. Future observations will have to sample the source more frequently than once every three weeks, with once every 3-5 days probably providing the best results.
Appendix A Table of Maser Components for IRAS 4B
Maser component fits were averaged using a flux-squared weighting scheme, that emphasizes the strongest portion of the maser emission and produces a reliable location for the maser. As some masers are present for only three channels, a full Gaussian fit to the maser as a function of velocity was deemed impractical, although it could have been used for the masers that existed over many channels. We opted to use the same position-determining scheme for all features. These averaged component fits and their corresponding errors are given in Table 5 for IRAS 4B. Note that the uncertainty in position for the reference channel is simply the error on the mean position values determined for the spot and is indicative of the reliability of the Gaussian fitting routines in the presence of noise in the images.
References
- André, et al. (2000) André, P., Ward-Thompson, D., & Barsony, M. 2000, in Protostars and Planets IV, eds. V. Mannings, A. P. Boss, & S. S. Russell, Univ. of Arizona Press: Tucson, p. 59
- Aspin et al. (1994) Aspin, C., Sandell, G., & Russell, A. P. G. 1994, A&AS, 106, 165
- Blake et al. (1995) Blake, G. A., Sandell, G., van Dishoeck, E. F., Groesbeck, T. D., Mundy, L. G., & Aspin, C. 1995, ApJ, 441, 689
- Bottinelli et al. (2007) Bottinelli, S., Ceccarelli, C., Williams, J. P., & Lefloch, B. 2007, A&A, 463, 601
- Brand et al. (2003) Brand, J., Cesaroni, R., Comoretto, G., Felli, M., Palagi, F., Palla, F., & Valdettaro, R. 2003, A&A, 407, 573
- Choi (2001) Choi, M. 2001, ApJ, 553, 219
- Choi (2005) Choi, M. 2005, ApJ, 630, 976
- Choi et al. (2006) Choi, M., Hodapp, K., Hayashi, M., Motohara, K., Pak, S., & Pyo, T.-S 2006, ApJ, 646, 1050
- Claussen et al. (1998) Claussen, M. J., Marvel, K. B., Wootten, A., & Wilking, B. A. 1998, ApJ, 507, L79
- Claussen et al. (1996) Claussen, M. J., Wilking, B. A., Benson, P. J., Wootten, A., Myers, P. C., & Terebey, S. 1996, ApJS, 106, 111
- Curiel et al. (1993) Curiel, S., Rodriguez, L. F., Moran, J. M., & Canto, J. 1993, ApJ, 415, 191
- Desmurs et al. (2006) Desmurs, J.-F., Codella, C., Santiago-Garcia, J., Tafalla, M., & Bachiller, R. 2006, in Proceedings of the 8th European VLBI Network Symposium, ed. A. Marecki, p.65
- de Zeeuw et al. (1999) de Zeeuw, P. T., Hoogerwerf, R., de Bruijne, J. H. J., Brown, A. G. A., & Blaauw, A. 1999, AJ, 117, 354
- Di Francesco et al. (2001) Di Francesco, J., Myers, P. C., Wilner, D. J., Ohashi, N., & Mardones, D. 2001, ApJ, 562, 770
- Elitzur, Hollenbach, & McKee (1992) Elitzur, M., Hollenbach, D. J., & McKee, C. F. 1992, ApJ, 394, 221
- Elitzur, Hollenbach, & McKee (1989) Elitzur, M., Hollenbach, D. J., & McKee, C. F. 1989, ApJ, 346, 983
- Furuya et al. (2003) Furuya, R. S., Kitamura, Y., Wootten, H. A., Claussen, M. J., & Kawabe, R. 2003, ApJS, 144, 71
- Furuya et al. (2000) Furuya, R. S., Kitamura, Y., Wootten, H. A., Claussen, M. J., Saito, M., Marvel, K. B., & Kawabe, R. 2000, ApJ, 542, L135
- Furuya et al. (2005) Furuya, R. S., Kitamura, Y., Wootten, A., Claussen, M. J., & Kawabe, R. 2005, A&A, 438, 571
- Getman et al. (2002) Getman, K. V., Feigelson, E. D., Townsley, L., Bally, J., Lada, C. J., & Reipurth, B. 2002, ApJ, 575, 354
- Girart, Crutcher, & Rao (1999) Girart, J., Crutcher, R., & Rao, R. 1999, ApJ, 525, L109
- Greisen (2003) Greisen, E. W. 2003, in Information Handling in Astronomy, ed. A. Heck (Dordrecht: Kluwer), 109
- Harvey, Wilking, & Joy (1984) Harvey, P., Wilking, B., & Joy, M. 1984, ApJ, 278, 156
- Haschick et al. (1980) Haschick, A. D., Moran, J. M., Rodriguez, L. F., Burke, B. F., Greenfield, P., & Garcia-Barreto, J. A. 1980, ApJ, 237, 26
- Hodapp et al. (2005) Hodapp, K., Bally, J., Eisloffel, J. & Davis, C. 2005, AJ, 129, 1580
- Hollenbach (1997) Hollenbach, D. 1997, in IAU Symp. 182, Herbig-Haro Flows and the Birth of Low Mass Stars, ed. B. Reipurth & C. Bertout (Dordrecht: Kluwer), 181
- Jennings et al. (1987) Jennings, R. E., Cameron, D. H. M., Cudlip, W., & Hirst, C. J. 1987, MNRAS, 226, 461
- Lada, Alves, & Lada (1996) Lada, C. J., Alves, J., & Lada, E. A. 1996, AJ, 111, 1964
- Lay, Carlstrom, & Hills (1995) Lay, O. P., Carlstrom, J. E., & Hills, R. E. 1995, ApJ, 452, L73
- Looney, Mundy, & Welch (2000) Looney, L. W., Mundy, L. G., & Welch, W. J. 2000, ApJ, 529, 477
- MacLow et al. (1994) MacLow M., Elitzur, M., Stone, J. M., & Konigl, A. 1994, ApJ, 427, 914
- MacLow & Elitzur (1992) MacLow, M. & Elitzur, M. 1992, ApJ, 393, L33
- Marvel et al. (2002) Marvel, K., Claussen, M., & Wootten, A. 2002, IAU Symposium, 206, 63
- Matthews et al. (2006) Matthews, B., Hogerheijde, M., Jorgensen, J. & Bergin, E. 2006, ApJ, 652, 1374
- Moscadelli et al. (2006) Moscadelli, L., Testi, L., Furuya, R., Goddi, C., Claussen, M., Kitamura, Y., & Wootten, A. 2006, A&A, 446, 985
- Preibisch (1997) Preibisch, T. 1997, A&A, 324, 690
- Preibisch (2003) Preibisch, T. 2003, A&A, 401, 543
- Reipurth et al. (2002) Reipurth, B., Rodríguez, L. F., Anglada, G., & Bally, J. 2002, AJ, 124, 1045
- Reipurth (2000) Reipurth, B. 2000, AJ, 120, 3177
- Rodríguez et al. (2002) Rodríguez, L. F., Anglada, G., Torrelles, J. M., Mendoza-Torres, J. E., Haschick, A. D., & Ho, P. T. P. 2002, A&A, 389, 572
- Sandell et al. (1991) Sandell, G., Aspin, C., Duncan, W. D., Russell, A. P. G., & Robson, E. I. 1991, ApJ, 376, L17
- Sandell & Knee (2001) Sandell, G. & Knee, L. B. G. 2001, ApJ, 546, L49
- Strom et al. (1976) Strom, S. E., Vrba, F. J., & Strom, K. M. 1976, AJ, 81, 314
- Terquem (1998) Terquem, C. 1998, ApJ, 509, 819
- Terquem et al. (1999) Terquem, C., Eisloffel, J., Papaloizou, J. & Nelson, R. 1999, ApJ, 512, L131
- Torrelles et al. (2001) Torrelles, J. M., et al. 2001, ApJ, 560, 853
- Seth et al. (2002) Seth, A. C., Greenhill, L. J., & Holder, B. P. 2002, ApJ, 581, 325
- Shah (2000) Shah, R. 2000, Ph.D. Thesis, University of Virginia
- Smith et al. (2000) Smith, K. W., Bonnell, I. A., Emerson, J. P., & Jenness, T. 2000, MNRAS, 319, 991
- Wilking et al. (1994) Wilking, B. A., Claussen, M. J., Benson, P. J., Myers, P. C., Terebey, S., & Wootten, A. 1994, ApJ, 431, L119
- Wilking et al. (2004) Wilking, B. A., Meyer, M. R., Greene, T. P., Mikhail, A., & Carlson, G. 2004, AJ, 127, 1131
- Wootten & Mangum (1993) Wootten, A. & Mangum, J. 1993, Bulletin of the American Astronomical Society, 25, 1367
- Wootten (1998) Wootten, H. A., 1998, unpublished observations
- Wootten et al. (1999) Wootten, A., Claussen, M., Marvel, K., & Wilking, B. 1999, The Physics and Chemistry of the Interstellar Medium, Proceedings of the 3rd Cologne-Zermatt Symposium, held in Zermatt, September 22-25, 1998, Eds.: V. Ossenkopf, J. Stutzki, and G. Winnewisser, GCA-Verlag Herdecke, ISBN 3-928973-95-9, 295
- Wootten et al. (2002) Wootten, A., Claussen, M., Marvel, K., & Wilking, B. 2002, IAU Symposium, 206, 100
| Property | Value | Reference |
|---|---|---|
| IRAS4A | ||
| A1 2.7 mm Position (J2000.0) | 3h 29m 10s.510 +31o 13′31″.01 | Looney, Mundy and Welch 2000 |
| A1 1.3 cm Position (J2000.0) | 3h 29m 10s.527 +31o 13′31″.06 | This study |
| A1 3.6 cm Position (J2000.0) | 3h 29m 10s.529 +31o 13′31″.05 | Reipurth et al. 2002 |
| A2 2.7 mm Position (J2000.0) | 3h 29m 10s.413 +31o 13′32″.20 | Looney, Mundy and Welch 2000 |
| A2 3.6 cm Position (J2000.0) | 3h 29m 10s.421 +31o 13′32″.21 | Reipurth et al. 2002 |
| A2 H2O NW Position (J2000.0) | 3h 29m 10s.4101 +31o 13′32″.235 | VLA-12Aug98; This study |
| A2 H2O SE Position (J2000.0) | 3h 29m 10s.4226 +31o 13′32″.142 | VLA-12Aug98; This study |
| A1 Peak Flux (2.7 mm) | 107 mJy | (2″) Looney, Mundy, & Welch 2000 |
| A2 Peak Flux (2.7 mm) | 23 mJy | (2″) Looney, Mundy, & Welch 2000 |
| A1 Peak Flux (3.6 cm) | 0.32 mJy | Reipurth et al. 2002 |
| A2 Peak Flux (3.6 cm) | 0.11 mJy | Reipurth et al. 2002 |
| Bolometric Luminosity (L⊙) | 14 | André, Ward-Thompson, & Barsony 2000 |
| Bolometric Temperature (K) | 34 | André, Ward-Thompson, & Barsony 2000 |
| IRAS4B | ||
| 2.7 mm Position (J2000.0) | 3h 29m 11s.988 +31o 13′08″.10 | Looney, Mundy, & Welch 2000 |
| 1.3 cm Position (J2000.0) | 3h 29m 12s.001 +31o 13′08″.16 | This study |
| 3.6 cm Position (J2000.0) | 3h 29m 12s.003 +31o 13′08″.14 | Reipurth et al. 2002 |
| B H2O NW Position (J2000.0) | 3h 29m 11s.9923 +31o 13′08″.363 | VLA-12Aug98; This study |
| B H2O SE Position (J2000.0) | 3h 29m 12s.0104 +31o 13′07″.955 | VLA-12Aug98; This study |
| Peak Flux (2.7 mm) | 58 mJy | (2″) Looney, Mundy, & Welch 2000 |
| Peak Flux (3.6 cm) | 0.33 mJy | Reipurth et al. 2002 |
| Bolometric Luminosity (L⊙) | 14 | André, Ward-Thompson, & Barsony 2000 |
| Bolometric Temperature (K) | 36 | André, Ward-Thompson, & Barsony 2000 |
| Epoch | Date | Mid-time | Julian Date | Time [d] |
|---|---|---|---|---|
| of 1998 | UT | -2451000.0 | ||
| I | September 15 | 11:01:23 | 71.95928 | 0.00000 |
| II | October 4 | 10:01:30 | 90.91771 | 18.95843 |
| III | October 27 | 08:01:30 | 113.83437 | 41.87509 |
| IV | November 14 | 06:31:30 | 131.77187 | 59.81259 |
| Epoch | Beam Dimensions | Beam Position Angle | RMS |
|---|---|---|---|
| [arcsec.] | [∘ E of N] | [mJy/Beam] | |
| 4A-I | 1260 910 | 11.8 | 10.4 |
| 4A-II | 830 440 | -21.2 | 6.8 |
| 4A-III | 810 400 | -19.1 | 11.7 |
| 4A-IV | 650 370 | -8.2 | 9.6 |
| 4B-I | 650 350 | -14.4 | 13.9 |
| 4B-II | 620 330 | -12.4 | 7.6 |
| 4B-III | 590 330 | -10.8 | 9.9 |
| 4B-IV | 720 420 | -5.8 | 6.0 |
| Epoch ID | Velocity | Peak Flux | X-Offset | Xref | Y-Offset | Yref |
|---|---|---|---|---|---|---|
| (km sec-1) | (Jy) | (mas) | (mas) | (mas) | (mas) | |
| IRAS 4A | ||||||
| I-A-REFaaStrongest maser in IRAS 4A used as both a position and velocity reference. | 10.40 | 3.29 | 0.083 | 0.073 | ||
| II-A-REF | 10.55 | 4.14 | -0.063 | -0.185 | ||
| III-A-REF | 10.68 | 7.97 | 0.007 | -0.030 | ||
| IV-A-REF | 10.72 | 14.9 | -0.005 | 0.002 | ||
| I-A-1 | 7.61 | 0.969 | -167.543 | -167.626 | 187.223 | 187.150 |
| II-A-1 | 7.65 | 0.211 | -169.013 | -168.950 | 187.985 | 188.170 |
| III-A-1 | 7.71 | 0.208 | -170.631 | -170.638 | 189.606 | 189.636 |
| IV-A-1 | 7.85 | 0.123 | -172.098 | -172.093 | 190.924 | 190.921 |
| vexp | 53.02 | |||||
| PA(Deg) | -49.82° | |||||
| I-A-2 | 10.34 | 1.90 | -1.859 | -1.942 | -0.086 | -0.160 |
| II-A-2 | 10.36 | 2.26 | -1.906 | -1.844 | -0.118 | 0.067 |
| III-A-2 | 10.29 | 1.74 | -1.844 | -1.851 | 0.695 | 0.725 |
| IV-A-2 | 10.35 | 1.27 | -1.938 | -1.933 | 1.113 | 1.108 |
| IRAS 4B | ||||||
| I-B-REFbbStrongest maser in IRAS 4B used as a position reference only. Proper motions are measured relative to a fiducial point for each epoch given as Xref and Yref for this maser (see text). | -0.750 | 36.8 | -0.020 | 122.668 | 0.0782 | -227.845 |
| II-B-REF | -1.161 | 20.4 | -0.001 | 123.598 | -0.041 | -228.993 |
| III-B-REF | -0.224 | 56.6 | -0.000 | 124.475 | -0.013 | -229.284 |
| IV-B-REF | -0.273 | 34.3 | -0.002 | 125.498 | 0.010 | -230.661 |
| I-B-1 | 0.380 | 0.368 | -1.736 | 120.932 | 10.016 | -217.830 |
| II-B-1 | 0.302 | 2.14 | -1.677 | 121.921 | 9.384 | -219.549 |
| III-B-1 | 0.485 | 0.256 | -1.626 | 122.849 | 8.726 | -220.559 |
| IV-B-1 | -0.158 | 0.09 | -1.732 | 123.767 | 8.912 | -221.749 |
| vexp | 45.40 | |||||
| PA(Deg) | 144.12° | |||||
| I-B-2 | 2.81 | 0.829 | -9.429 | 113.239 | 33.556 | -194.290 |
| II-B-2 | 3.05 | 0.134 | -9.531 | 114.067 | 33.844 | -195.089 |
| III-B-2 | 3.25 | 1.24 | -9.074 | 115.402 | 32.605 | -196.679 |
| IV-B-2 | 3.39 | 0.218 | -9.417 | 116.082 | 32.975 | -197.686 |
| vexp | 41.03 | |||||
| PA(Deg) | 140.07° | |||||
| I-B-3 | 17.46 | 0.634 | -239.832 | -117.165 | 432.737 | 204.892 |
| II-B-3 | 17.07 | 2.80 | -241.622 | -118.024 | 434.953 | 206.020 |
| III-B-3 | 17.27 | 0.521 | -243.675 | -119.200 | 436.448 | 207.164 |
| IV-B-3 | 17.13 | 0.318 | -245.662 | -120.163 | 439.063 | 208.402 |
| vexp | 41.90 | |||||
| PA(Deg) | -40.50° | |||||
| I-B-4 | 17.74 | 2.31 | -239.610 | -116.943 | 430.618 | 202.772 |
| II-B-4 | 17.66 | 5.90 | -241.452 | -117.853 | 432.924 | 203.991 |
| III-B-4 | 17.60 | 1.50 | -243.359 | -118.884 | 434.451 | 205.167 |
| IV-B-4 | 17.43 | 0.862 | -245.111 | -119.612 | 437.038 | 206.377 |
| vexp | 41.47 | |||||
| PA(Deg) | -36.51° | |||||
| I-B-5 | 17.95 | 0.643 | -239.816 | -117.148 | 438.361 | 210.516 |
| II-B-5 | 17.99 | 0.957 | -241.704 | -118.106 | 440.878 | 211.947 |
| III-B-5 | 17.84 | 1.24 | -243.767 | -119.292 | 442.811 | 213.527 |
| IV-B-5 | 17.22 | 1.55 | -245.495 | -119.997 | 445.035 | 214.374 |
| vexp | 46.15 | |||||
| PA(Deg) | -36.44° |
| Epoch ID | Other | Velocity | Peak Flux | X-Offset | Y-Offset | ||
|---|---|---|---|---|---|---|---|
| (km s-1 ) | (Jy) | (mas) | (mas) | (as) | (as) | ||
| I-SE-1 | B-2 | 2.81 | 0.83 | -9.428 | 33.555 | 4.4 | 8.0 |
| I-SE-2 | 2.30 | 8.24 | -7.362 | 27.891 | 0.1 | 1.1 | |
| I-SE-3 | 2.21 | 4.97 | -5.722 | 21.858 | 1.1 | 1.3 | |
| I-SE-4 | 2.27 | 0.76 | -5.966 | 22.825 | 5.5 | 5.3 | |
| I-SE-5 | 2.10 | 0.44 | -6.433 | 23.448 | 7.8 | 12.9 | |
| I-SE-6 | 1.94 | 0.76 | -5.327 | 20.908 | 3.8 | 5.5 | |
| I-SE-7 | 1.88 | 1.76 | -5.883 | 22.016 | 1.2 | 2.5 | |
| I-SE-8 | 1.74 | 0.58 | -5.247 | 20.739 | 6.1 | 11.8 | |
| I-SE-9 | 1.33 | 0.37 | -4.515 | 18.473 | 7.6 | 14.6 | |
| I-SE-10 | 1.29 | 0.38 | -3.104 | 15.207 | 8.1 | 14.7 | |
| I-SE-11 | B-1 | 0.38 | 0.37 | -1.735 | 10.010 | 6.6 | 8.8 |
| I-SE-12 | 0.23 | 0.62 | -1.442 | 8.355 | 3.7 | 2.9 | |
| I-SE-13 | 0.16 | 5.84 | -1.571 | 9.156 | 0.3 | 1.2 | |
| I-SE-14 | 0.10 | 0.41 | -1.281 | 6.440 | 6.7 | 12.1 | |
| I-SE-15 | -0.01 | 0.48 | -1.392 | 7.743 | 7.2 | 21.2 | |
| I-SE-16 | B-REF | -0.75 | 36.76 | -0.020360 | 0.07815 | 0.007 | 0.04 |
| I-SE-17 | -1.57 | 0.20 | -49.551 | 88.150 | 14.0 | 25.6 | |
| I-SE-18 | -2.68 | 0.38 | -48.231 | 84.987 | 7.42 | 13.1 | |
| I-NW-1 | B-5 | 17.95 | 0.64 | -239.816 | 438.361 | 4.8 | 9.4 |
| I-NW-2 | B-4 | 17.74 | 2.31 | -239.610 | 430.618 | 1.4 | 3.5 |
| I-NW-3 | 17.71 | 0.39 | -239.404 | 429.748 | 6.2 | 4.5 | |
| I-NW-4 | 17.70 | 0.27 | -239.354 | 427.401 | 8.8 | 23.2 | |
| I-NW-5 | B-3 | 17.46 | 0.63 | -239.832 | 432.737 | 5.1 | 2.2 |
| I-NW-6 | 17.34 | 8.64 | -239.793 | 431.960 | 0.1 | 1.0 | |
| I-NW-7 | 17.31 | 0.52 | -239.674 | 431.152 | 4.5 | 2.4 | |
| I-NW-8 | 17.13 | 2.13 | -239.178 | 420.144 | 1.6 | 5.1 | |
| I-NW-9 | 16.93 | 3.15 | -239.996 | 425.710 | 1.3 | 3.3 | |
| I-NW-10 | 16.88 | 0.72 | -240.000 | 424.172 | 5.2 | 22.2 | |
| I-NW-11 | 16.71 | 0.46 | -239.842 | 421.856 | 7.3 | 24.4 | |
| I-NW-12 | 16.28 | 0.23 | -239.074 | 413.088 | 14.8 | 31.3 | |
| I-NW-13 | 16.11 | 0.12 | -239.817 | 415.178 | 28.7 | 54.5 | |
| II-SE-1 | 3.08 | 0.13 | -9.929 | 34.227 | 18 | 28 | |
| II-SE-2 | B-2 | 3.05 | 0.13 | -9.532 | 33.844 | 18 | 23 |
| II-SE-3 | 2.53 | 0.32 | -6.009 | 22.195 | 6 | 10 | |
| II-SE-4 | 2.38 | 1.09 | -7.803 | 28.253 | 2 | 3 | |
| II-SE-5 | 2.26 | 0.46 | -6.057 | 22.259 | 5 | 7 | |
| II-SE-6 | 2.24 | 0.23 | -6.545 | 23.227 | 10 | 17 | |
| II-SE-7 | 1.63 | 0.18 | -2.539 | 15.374 | 11 | 21 | |
| II-SE-8 | 1.60 | 0.48 | -4.945 | 19.856 | 5 | 9 | |
| I-SE-9 | 1.50 | 0.64 | -4.899 | 19.603 | 3 | 1 | |
| II-SE-10 | 1.48 | 1.23 | -4.751 | 18.793 | 2 | 5 | |
| II-SE-11 | 1.22 | 0.25 | -3.393 | 15.304 | 10 | 17 | |
| II-SE-12 | 1.13 | 0.14 | -2.706 | 13.848 | 19 | 30 | |
| II-SE-13 | 1.10 | 0.17 | -2.724 | 13.181 | 10 | 22 | |
| II-SE-14 | 0.84 | 0.53 | -2.317 | 11.923 | 4 | 10 | |
| II-SE-15 | 0.43 | 2.44 | -1.758 | 9.760 | 1 | 1 | |
| II-SE-16 | 0.43 | 1.05 | -1.558 | 8.746 | 1 | 1 | |
| II-SE-17 | B-1 | 0.30 | 2.14 | -1.677 | 9.383 | 1 | 2 |
| II-SE-18 | 0.21 | 1.03 | -1.298 | 6.382 | 2 | 4 | |
| II-SE-19 | 0.11 | 0.29 | -0.580 | 2.781 | 6 | 13 | |
| II-SE-20 | 0.05 | 0.70 | -1.401 | 7.519 | 2 | 5 | |
| II-SE-21 | -0.97 | 12.80 | -0.132670 | 0.679741 | 0.002 | 0.005 | |
| II-SE-22 | B-REF | -1.16 | 20.41 | -0.000980 | -0.041125 | 0.004 | 0.007 |
| II-SE-23 | -1.52 | 2.11 | 0.244 | -1.140 | 1 | 1 | |
| II-SE-24 | -1.90 | 0.32 | -46.0974 | 77.935 | 6 | 11 | |
| II-SE-25 | -2.04 | 0.24 | 1.360 | -6.688 | 6 | 11 | |
| II-SE-26 | -2.37 | 0.29 | -47.5718 | 82.438 | 7 | 17 | |
| II-NW-1 | B-5 | 17.99 | 0.96 | -241.704 | 440.878 | 2 | 5 |
| II-NW-2 | 17.99 | 0.86 | -241.869 | 449.662 | 2 | 4 | |
| II-NW-3 | B-4 | 17.66 | 5.90 | -241.452 | 432.924 | 1 | 1 |
| II-NW-4 | 17.61 | 1.48 | -241.606 | 433.736 | 2 | 10 | |
| II-NW-5 | 17.10 | 0.34 | -241.901 | 429.900 | 9 | 38 | |
| II-NW-6 | 17.09 | 0.56 | -241.571 | 427.050 | 5 | 5 | |
| II-NW-7 | B-3 | 17.07 | 2.80 | -241.622 | 434.953 | 1 | 1 |
| II-NW-8 | 17.04 | 3.58 | -241.631 | 428.024 | 1 | 2 | |
| II-NW-9 | 17.03 | 0.26 | -241.059 | 423.332 | 11 | 6 | |
| II-NW-10 | 17.02 | 3.29 | -241.073 | 422.442 | 1 | 1 | |
| II-NW-11 | 16.97 | 0.37 | -241.235 | 421.489 | 6 | 7 | |
| II-NW-12 | 16.95 | 0.26 | -241.421 | 424.037 | 9 | 28 | |
| II-NW-13 | 16.90 | 0.43 | -241.797 | 429.376 | 6 | 12 | |
| II-NW-14 | 16.87 | 0.54 | -241.683 | 426.113 | 5 | 19 | |
| III-SE-1 | B-2 | 3.25 | 1.24 | -9.074 | 32.605 | 2 | 2 |
| III-SE-2 | 3.19 | 0.32 | -4.623 | 22.469 | 6 | 11 | |
| III-SE-3 | 1.83 | 0.18 | -2.942 | 16.312 | 11 | 17 | |
| III-SE-4 | 1.65 | 0.18 | -4.944 | 18.837 | 9 | 23 | |
| III-SE-5 | 1.38 | 0.14 | -4.707 | 17.604 | 12 | 22 | |
| III-SE-6 | 0.99 | 0.81 | -2.259 | 10.991 | 3 | 5 | |
| III-SE-7 | 0.60 | 0.18 | -1.151 | 6.024 | 10 | 22 | |
| III-SE-8 | 0.51 | 0.12 | -1.388 | 7.749 | 13 | 23 | |
| III-SE-9 | B-1 | 0.48 | 0.26 | -1.626 | 8.726 | 8 | 18 |
| III-SE-10 | 0.30 | 0.16 | -1.118 | 5.494 | 9 | 28 | |
| III-SE-11 | 0.09 | 0.73 | -0.421 | 1.823 | 3 | 7 | |
| III-SE-12 | B-REF | -0.22 | 56.60 | -0.000320 | -0.013123 | 0.001 | 0.005 |
| III-SE-13 | -0.26 | 2.17 | 0.134 | -0.762 | 1 | 1 | |
| III-SE-14 | -0.67 | 0.22 | 1.200 | -4.693 | 11 | 21 | |
| III-SE-15 | -0.84 | 2.92 | -45.799 | 75.965 | 1 | 1 | |
| III-SE-16 | -0.97 | 0.16 | 2.054 | -8.797 | 9 | 29 | |
| III-SE-17 | -1.01 | 0.13 | 0.504 | -2.326 | 14 | 21 | |
| III-SE-18 | -1.34 | 1.33 | 1.165 | -5.231 | 1 | 3 | |
| III-SE-19 | -1.34 | 0.23 | 0.947 | -4.513 | 7 | 9 | |
| III-SE-20 | -1.69 | 0.20 | -45.966 | 76.791 | 10 | 11 | |
| III-SE-21 | -2.72 | 0.39 | -48.936 | 84.458 | 6 | 10 | |
| III-NW-1 | 17.99 | 3.58 | -243.777 | 451.560 | 0.3 | 1 | |
| III-NW-2 | B-5 | 17.84 | 1.24 | -243.767 | 442.811 | 2 | 4 |
| III-NW-3 | 17.64 | 0.52 | -243.826 | 442.337 | 5 | 10 | |
| III-NW-4 | B-4 | 17.60 | 1.50 | -243.359 | 434.451 | 1 | 3 |
| III-NW-5 | 17.34 | 0.99 | -244.031 | 441.137 | 2 | 4 | |
| III-NW-6 | 17.28 | 1.26 | -243.607 | 435.704 | 2 | 4 | |
| III-NW-7 | B-3 | 17.27 | 0.52 | -243.675 | 436.448 | 4 | 6 |
| III-NW-8 | 17.14 | 0.31 | -243.397 | 430.521 | 8 | 23 | |
| III-NW-9 | 17.02 | 1.00 | -243.439 | 429.509 | 3 | 5 | |
| III-NW-10 | 16.94 | 0.60 | -243.038 | 424.096 | 3 | 6 | |
| III-NW-11 | 16.86 | 0.14 | -243.471 | 427.598 | 13 | 33 | |
| III-NW-12 | 16.83 | 0.30 | -243.662 | 431.119 | 10 | 24 | |
| III-NW-13 | 16.49 | 0.39 | -244.642 | 437.123 | 6 | 13 | |
| III-NW-14 | 16.20 | 0.10 | -244.699 | 434.707 | 25 | 84 | |
| IV-SE-1 | B-2 | 3.39 | 0.22 | -9.417 | 32.975 | 7 | 12 |
| IV-SE-2 | 2.30 | 0.48 | -0.527 | 10.169 | 4 | 7 | |
| IV-SE-3 | 1.18 | 0.08 | 1.014 | 2.647 | 22 | 36 | |
| IV-SE-4 | B-1 | -0.16 | 0.09 | -1.732 | 8.912 | 17 | 25 |
| IV-SE-5 | B-REF | -0.27 | 34.28 | -0.001790 | 0.009699 | 0.001 | 0.004 |
| IV-SE-6 | -1.46 | 0.09 | 2.713 | -10.796 | 19 | 33 | |
| IV-SE-7 | -1.52 | 0.31 | -46.019 | 76.637 | 5 | 10 | |
| IV-SE-8 | -1.65 | 0.07 | -46.833 | 78.663 | 24 | 5 | |
| IV-NW-1 | 19.07 | 0.19 | -245.612 | 458.674 | 7 | 13 | |
| IV-NW-2 | 18.99 | 2.04 | -245.643 | 456.618 | 1 | 1 | |
| IV-NW-3 | 18.80 | 0.48 | -245.576 | 458.611 | 3 | 14 | |
| IV-NW-4 | 18.60 | 0.47 | -245.375 | 460.263 | 3 | 5 | |
| IV-NW-5 | 18.29 | 0.30 | -245.403 | 453.824 | 4 | 8 | |
| IV-NW-6 | 17.81 | 0.59 | -245.703 | 449.530 | 3 | 6 | |
| IV-NW-7 | B-4 | 17.43 | 0.86 | -245.111 | 437.038 | 2 | 6 |
| IV-NW-8 | B-5 | 17.22 | 1.55 | -245.495 | 445.035 | 1 | 2 |
| IV-NW-9 | 17.13 | 0.92 | -245.701 | 443.219 | 2 | 4 | |
| IV-NW-10 | B-3 | 17.13 | 0.32 | -245.662 | 439.063 | 9 | 14 |
| IV-NW-11 | 17.09 | 0.35 | -245.643 | 444.135 | 6 | 8 | |
| IV-NW-12 | 17.05 | 0.61 | -246.666 | 446.387 | 3 | 8 | |
| IV-NW-13 | 16.27 | 0.14 | -246.060 | 440.124 | 15 | 16 | |
| IV-NW-14 | 16.14 | 0.99 | -246.162 | 439.176 | 2 | 4 | |
| IV-NW-15 | 14.33 | 0.52 | -247.708 | 425.411 | 2 | 7 |